
Abstract
Array-based comparative genomic hybridization is rapidly becoming a standard assay for research and clinical cytogenetics laboratories. Certain automated workflows are used to achieve economies in running this relatively expensive assay. Here, we describe the ways in which our medium throughput laboratory has investigated automation at various points in our workflow to achieve economies and improve the resulting data for our investigators. We investigate an automated hybridization station to improve microarray hybridization, an autoloading scanner to facilitate the rapid scanning of multiple arrays, and a software package that allows for quick and easy access to many external resources to extend the analysis.
Keywords
Introduction
Array-based comparative genomic hybridization (aCGH) offers a high-resolution robust assay that determines copy number variant (CNV) and is becoming a routine laboratory technique to better define cytogenetic breakpoints, identify or confirm aberrations under 5 Mb, and expand on traditional g-banded karyotype analysis. aCGH involves the hybridization of a test versus reference DNA, each labeled with a different colored dye, and the quantitation of fluorescense using a laser scanner. aCGH applications are becoming a standard testing option for determining the underlying genetic causes for developmental disabilities or congenital anomalies. 1 Many new microdeletion/microduplication syndromes have been identified via aCGH.24 It is also becoming a more critical assay with regard to disease susceptibility and prognosis as more groups are reporting CNV in relation to disease status. 5 Our work uses DNA from human embryonic stem cells, induced pluripotent stem cells, and related cell lines as starting material. The characterization of copy number changes in stem cells will become more important as we move toward potential therapies using these cells. 6
Sample preparation
The starting material for aCGH is genomic DNA of very high quality with 260/230 ratios ≥ 1.85 and 260/280 ≥ 1.75. We use a DNeasy Blood and Tissue Kit (Qiagen, Valencia, CA) to isolate DNA from cells. Samples are then labeled with Cy-3 and Cy-5 fluorescent dyes (Tri-Link, San Diego, CA) followed by overnight Klenow (New England Biolabs, Ipswich, MA) amplification. DNA is isopropanol precipitated, dried in a SpeedVac (Thermo Scientific, Waltham, MA), and reconstituted. Alexa Fluor (Life Technologies, Carlsbad, CA) dyes are added followed by another isopropanol precipitation and SpeedVac centrifugation until dry. 7 Dried pellets are then rehydrated in VWR water (VWR, West Chester, PA) or sample tracking control (Roche Nimblegen, Madison, WI).
Hybridization and washing
The sample/hybridization solution is added to the Roche NimbleGen (www.nimblegen.com) array/hybridization chamber (Roche Nimblegen, Madison, WI) assembly and incubated with active mixing on the Roche NimbleGen Hybridization System (Roche Nimblegen, Madison, WI) for 40-72 h at 48 °C (Fig. 1). This station facilitates the hybridization of aCGH samples to microarrays by using air bladders to push the labeled sample back and forth over the array. This reduces the amount of labeled sample needed, ensures complete mixing, and avoids any uneven hybridization because of pooling or air bubbles. Active mixing reduces the number of arrays that need to be rerun because of poor hybridization.
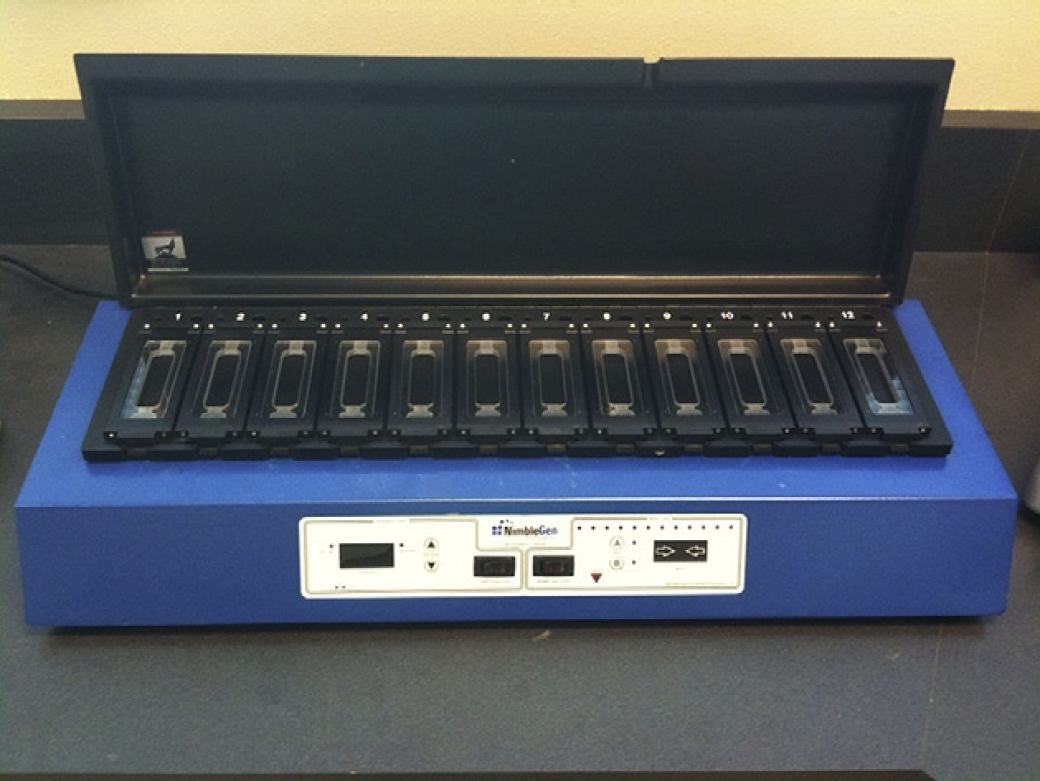
Roche Nimblegen Hybridization System image. The Roche Nimblegen hybridization chamber continually mixes the labeled sample across the surface of the microarray while a constant temperature is maintained.
After hybridization is concluded and the array/hybridization chamber assembly is removed from the hybridization system, the hybridization chamber is disassembled, and the arrays are carefully washed and dried via centrifugation in a low-light, low-ozone environment. Array washing is an area that many aCGH laboratories have chosen to target for automation. The technician-dependent nature of slide washing and the dramatic effects washing can have on the microarray make an automated washing system with consistent movements and conditions very desirable. Although this is not a workflow where we have implemented an automated solution, it is an attractive target for automation.
Fluorescent scanning
To scan multiple arrays in an automated way, we have investigated the use of the INNOPSYS (www.innopsys.fr) InnoScan I-900AL scanner (Innopsys, Carbonne, France), a high-resolution laser scanner, which can scan down to 1 μm with autofocusing and autoloading features. This allows the user to scan arrays overnight, saving many hours of technician time. The autoloading feature of this scanner allows for the loading of up to 24 microarrays for automated processing (Fig. 2).
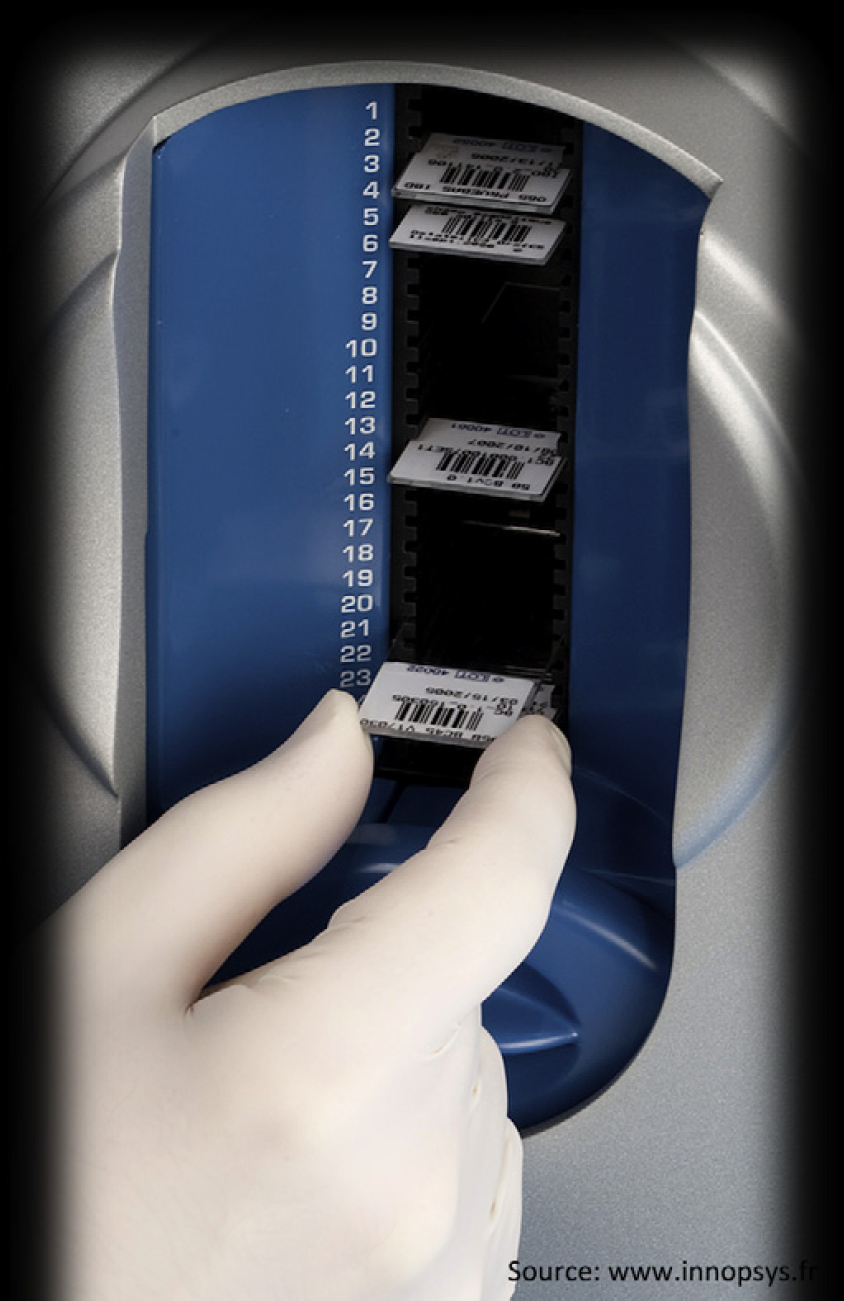
Image of the autoloading feature of the INNOPSYS InnoScan. Autoloading scanner that can hold up to 24 microarray slides and scan automatically during off-hours (such as overnight) allowing for technician time savings.
Although adequate fluorescent signal is gathered from standard density arrays (> 15-μm diameter spot size) when scanned at 5-μm resolution, higher resolution scanning combined with autofocusing produces more reliable data because of higher number of pixels (Fig. 3).
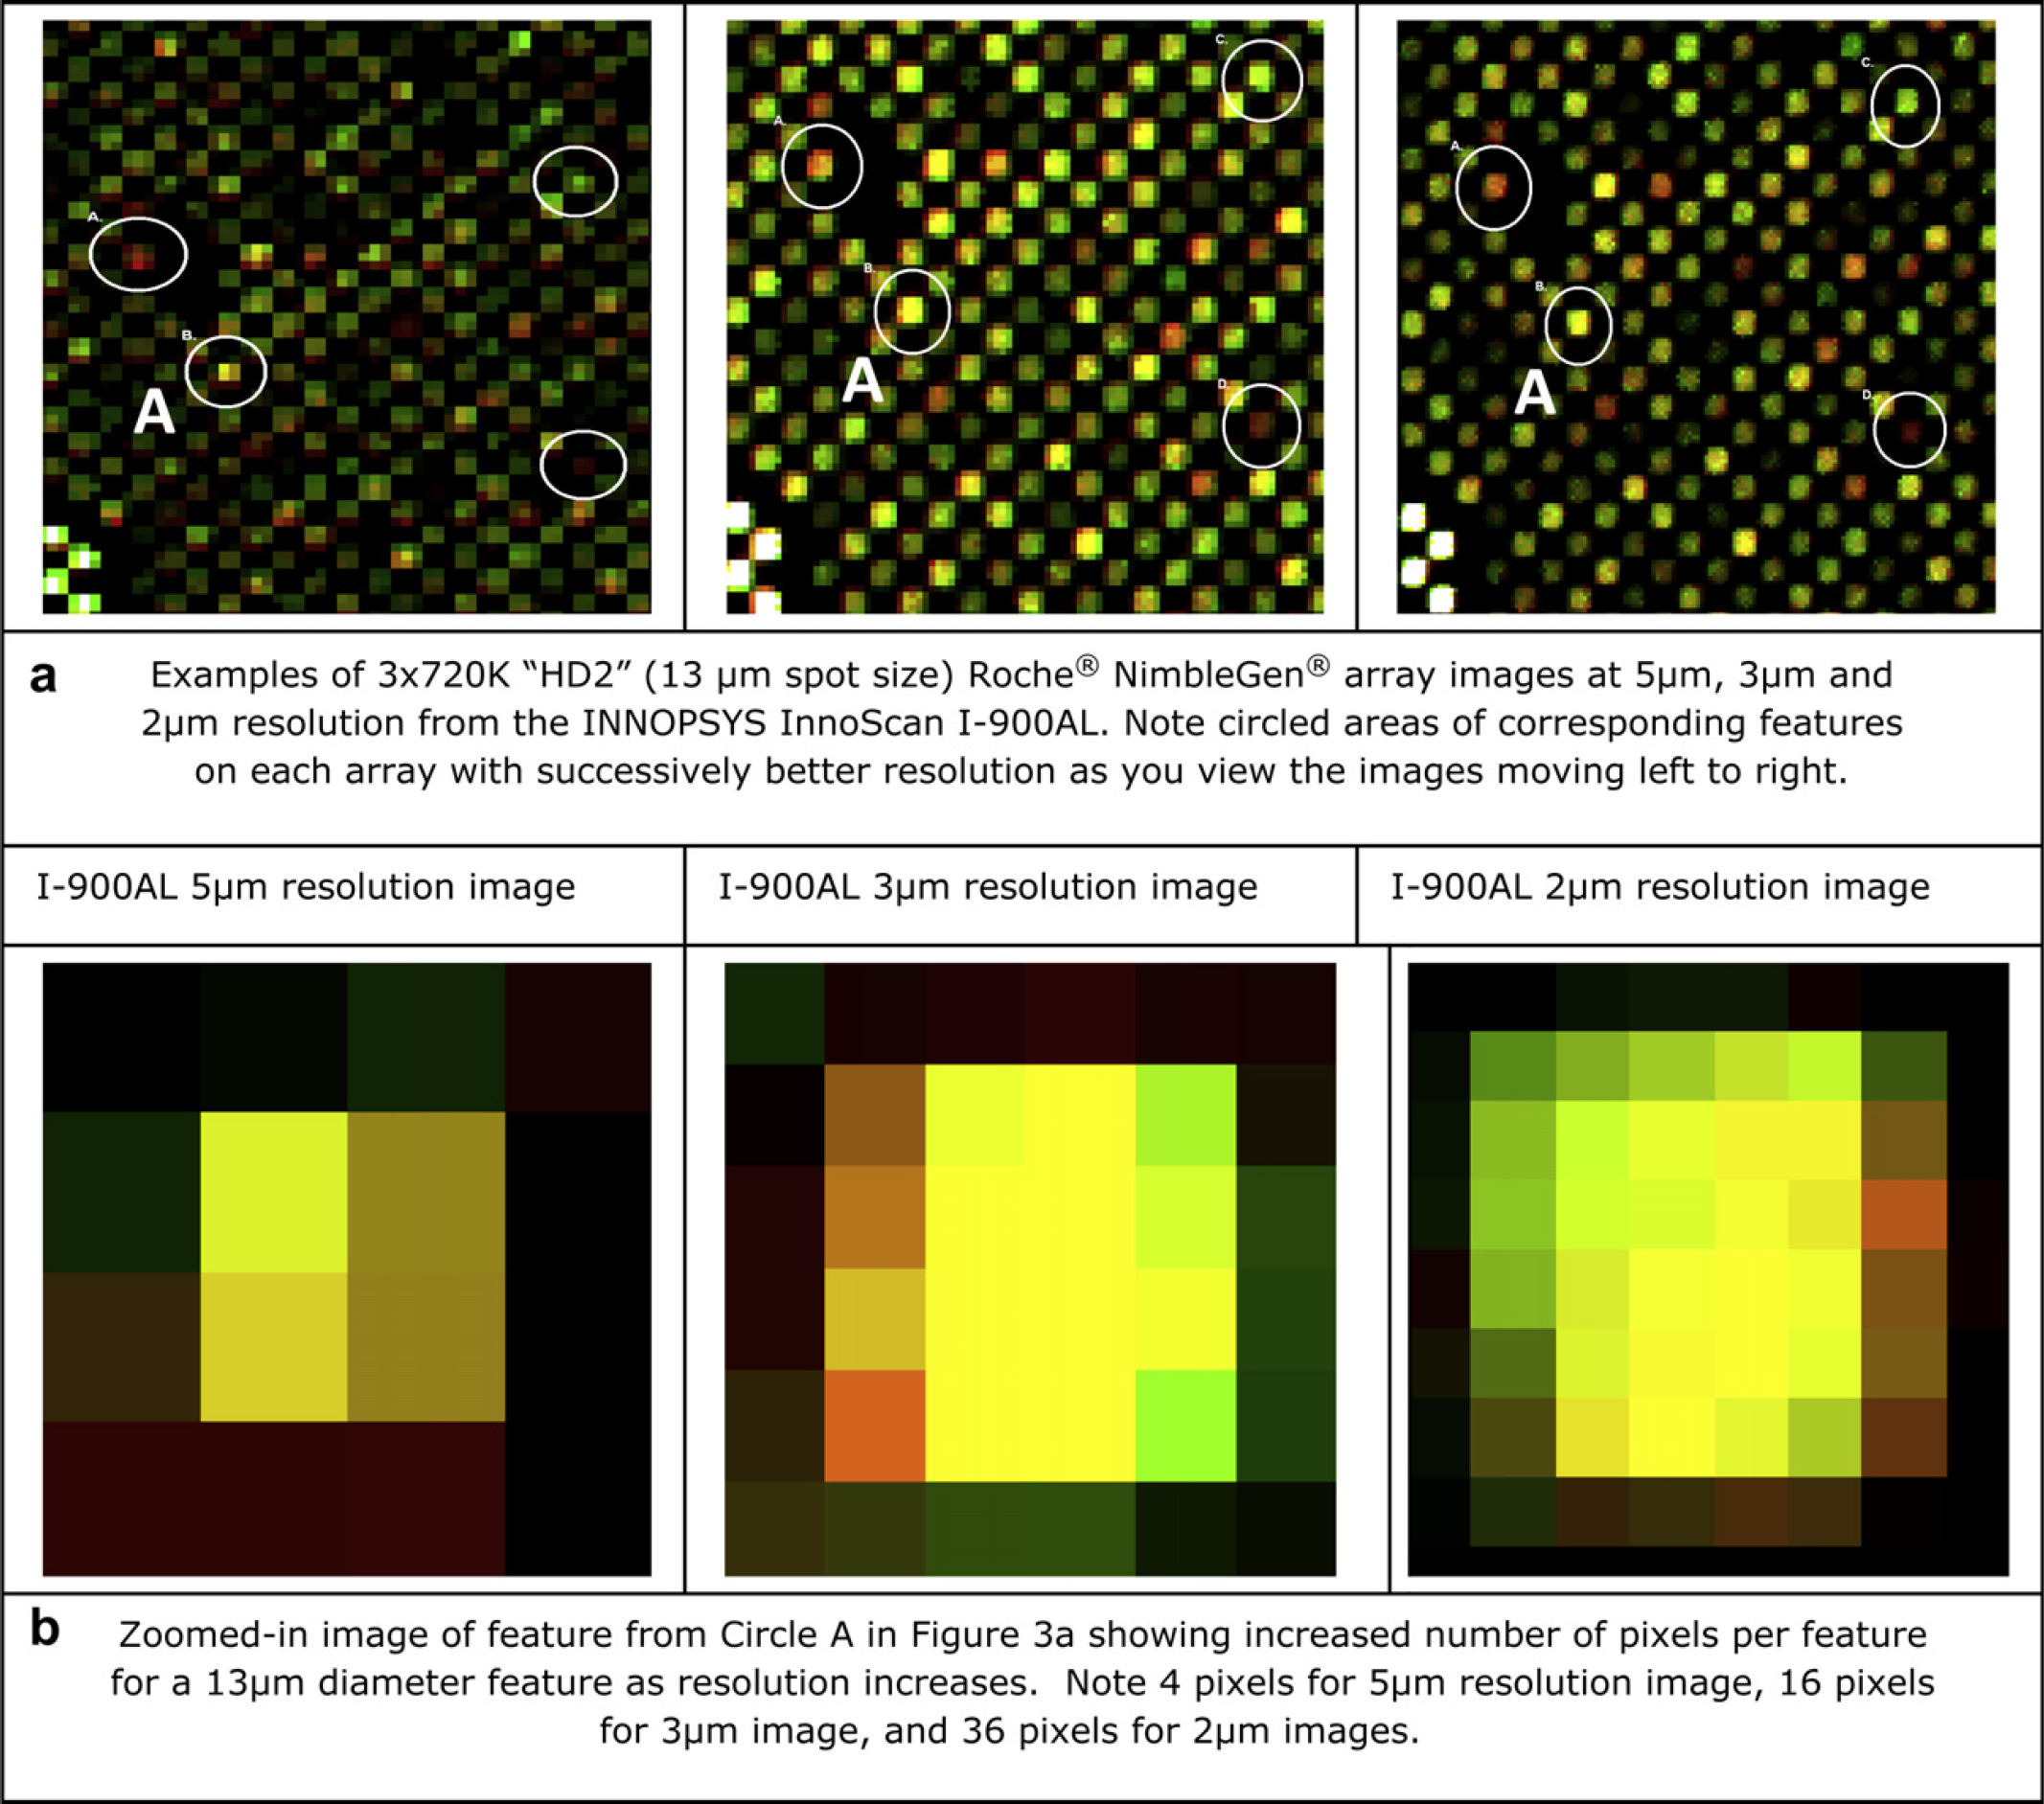
Comparison of resolutions and feature clarity. (a) Examples of 3 × 720 K “HD2” (13-μm spot size) Roche NimbleGen array images at 5-, 3-, and 2-μm resolution from the INNOPSYS InnoScan I-900AL. (b) Zoomed-in image of feature from Circle A in Figure 3a showing increased number of pixels per feature for a 13-μm diameter feature as resolution increases.
For higher density arrays (approximately 13-μm spot size), fluorescent signal from 3-μm resolution scanning typically provides 16 pixels per feature, which translates to improved confidence in the resulting data and increased number of reference copy number variants (CNVs) detected when compared with 5-μm resolution scanning. When scanning the same arrays at 2-μm resolution, at least 36 pixels per feature are generated; which greatly enhances the fluorescent data leading to more accurate calls and increased confidence in the final examination and reporting of chromosomal aberrations (Fig. 4).
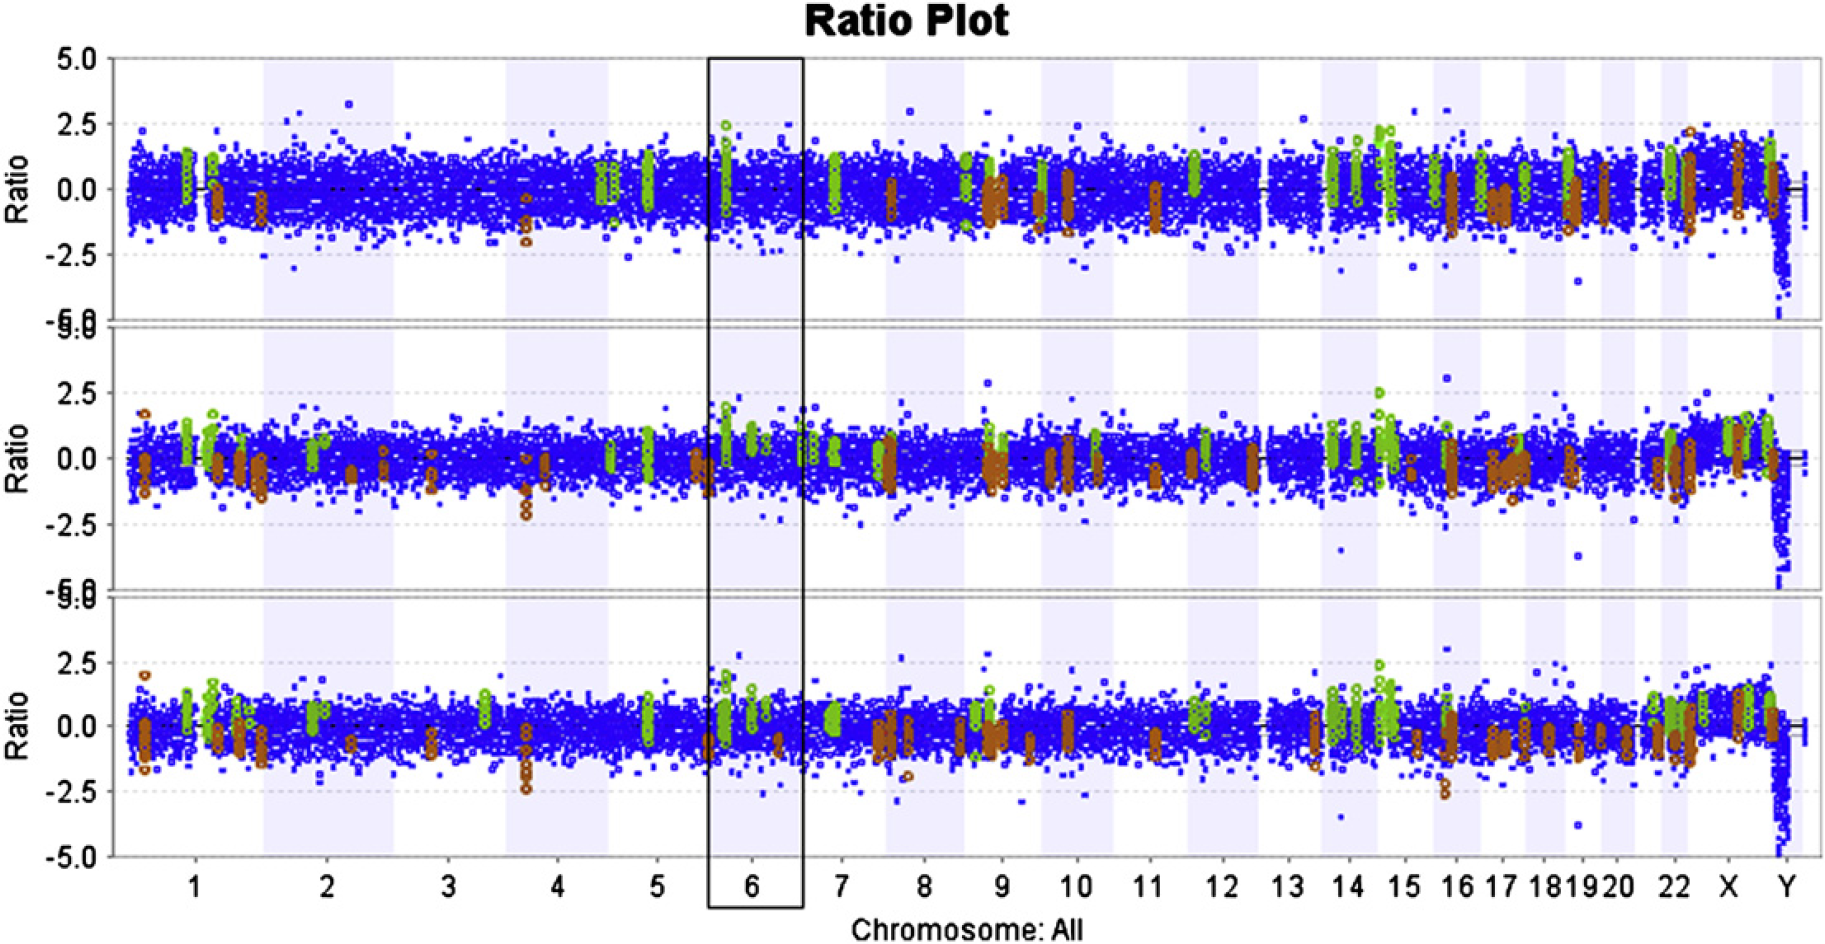
Comparison of aCGH plots using different scanner resolutions. Comparison of ratio plots of the same microarray scanned at 5 μm (top), 3 μm (middle), and 2 μm (bottom) resolution on the INNOPSYS I-900AL. Note, for example, that in chromosome 6 (in box) successively more aberrations (gain in green or loss in red) were detected at 3-μm resolution than at 5-μm resolution; and still more were detected at 2-μm resolution than at 3-μm resolution.
Feature extraction
Scanned microarray images are stored as .tif files. We use batching features in NimbleScan v2.5 software (Roche NimbleGen, Madison, WI) to facilitate the rapid feature extraction of many arrays simultaneously. This requires some amount of technician time to set up, but after the initial work, the data processing can take place largely unattended. We use the NimbleScan algorithm segMNT to process our files.
Data analysis
Once the data have been normalized and segmented, we use the InfoQuant (www.infoquant.com) software CGHFusion (InfoQuant, London, UK) to analyze our data. In this software package, the data are subjected to a “robust circular binary segmentation” algorithm. 8 It is this algorithm that determines when there is a copy number gain or loss relative to adjacent probes and the specific breakpoints of those changes.
These data are then pulled into the CGHFusion viewer for analysis. Much of the resulting data can be generated from within the software. We generate segmentation calls across the whole genome and then focus on areas of interest. The software facilitates this analysis by specifically reporting on critical regions from a user-generated text file. Some of these analyses require viewing all the different chromosomes and interrogating regions of gain and loss visually for probe coverage as well as general quality of data. The combination of these different analysis methods allows us to give our investigators a very clear idea of CNVs taking place in their samples, whether these changes have been noted before, and whether they are occurring in regions of interest or if they involve certain genes.
The method of quality control (QC) that we have developed revolves around understanding our reference sample. The known CNVs in our reference sample are used as a QC check of our test samples. This process takes a number of arrays to establish, but once complete, provides a very reliable QC standard for our analyses (Table 1).
Chart of reference CNVs and the different resolution scans performed using the reference CNV QC metric
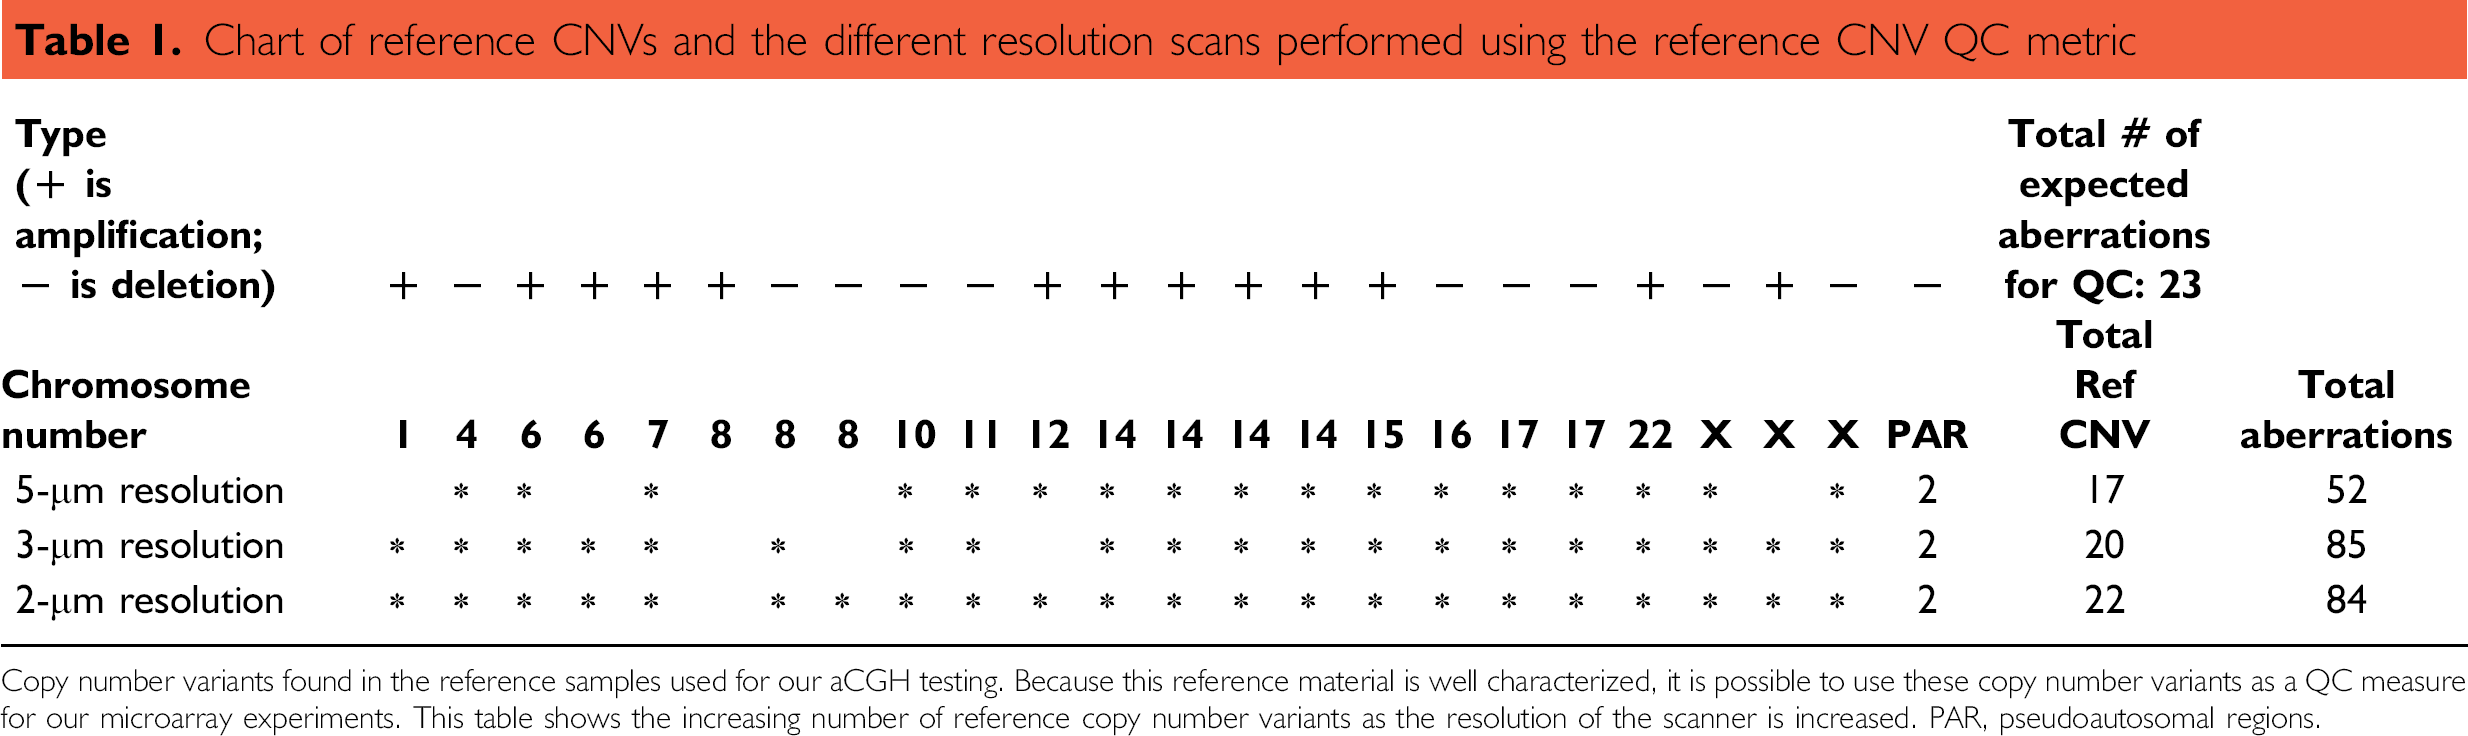
Copy number variants found in the reference samples used for our aCGH testing. Because this reference material is well characterized, it is possible to use these copy number variants as a QC measure for our microarray experiments. This table shows the increasing number of reference copy number variants as the resolution of the scanner is increased. PAR, pseudoautosomal regions.
Another way we use the CGHFusion software package to automate the analysis process is through links to external databases and resources such as Database of Chromosomal Imbalance and Phenotype in Humans using Esembml Resources (DECIPHER), Online Mendelian Inheritance in Man (OMIM), Database of Genomic Variants (DGV), and University California Santa Cruz (UCSC) Genome browser among others. One resource that we use frequently is the DGV. When we see large changes in the copy number of certain genomic intervals, we examine the DGV to see if it overlaps with a known region of variability in normal clinical samples. This direct link and display of that database in CGHFusion facilitates the rapid screening of the copy number changes for possible significance (Fig. 5).
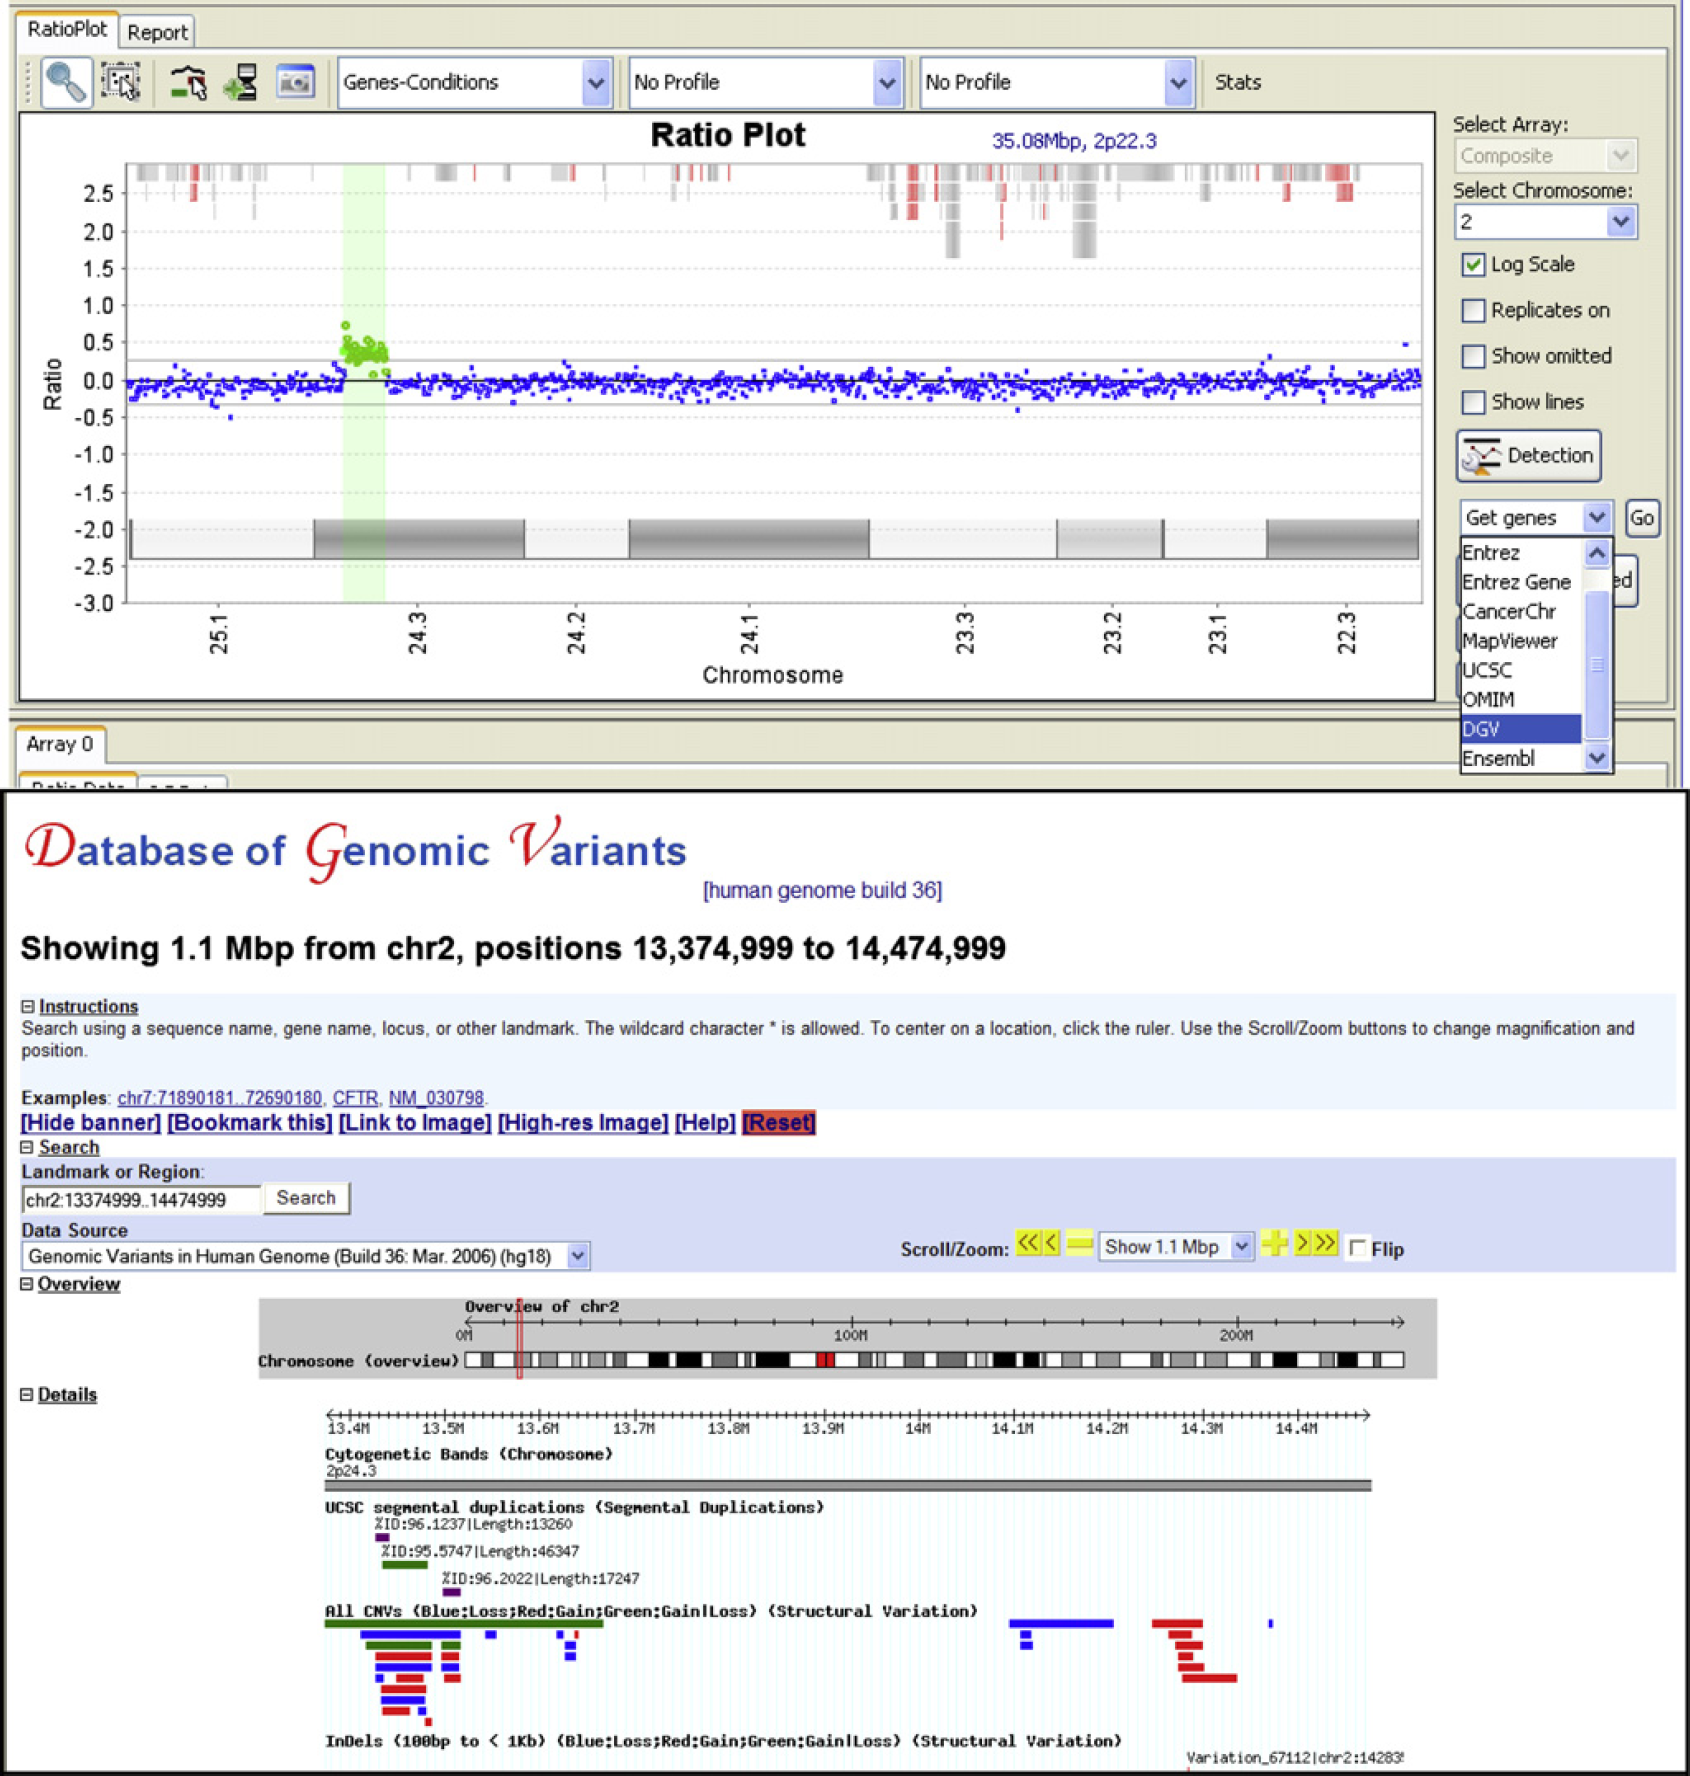
Highlighting links to outside sources. By selecting the large gain (in green) seen by aCGH and by selecting the external database, we are able to jump directly to the database within our analysis software to gather additional information about the variant and whether it has been frequently seen in healthy individuals. Alternative links will give you additional information about genes within this region and what conditions are associated with those genes.
Conclusion
aCGH is a powerful assay that requires considerable infrastructure to support. The workflow described here highlights three ways in which a midsize laboratory can automate this process to allow for greater throughput and faster turnaround for investigators. Automated hybridization allowed for greater hybridization efficiency, allowing for reproducible results and shorter hybridization times. Automated scanning with autofocusing allows for the laser scanning of many aCGH arrays simultaneously without technician input. The high resolution, low noise, and nature of these scans contribute to high data quality. Finally, the analysis software is able to efficiently automate many of the reporting processes such as noting copy number changes over specific areas of interest across the genome. This allows for an easily customizable analysis that can be offered to investigators without much added cost. External resources that link directly from the analysis software allow us to extend the analysis of our aCGH data.
Acknowledgments
We acknowledge the staff of the WiCell Research Institute for their support of our research. Thank you to INNOPSYS for their support through the use of their laser scanner for some of our data comparisons. Thanks to Anton Petrov of InfoQuant for his excellent technical support. We would also like to acknowledge the contributions of Thomas Strader in the preparation of this manuscript.
Competing Interests Statement: The authors certify that they have no relevant financial interests in this manuscript.