
Abstract
The uridine 5'-diphospho-glucuronosyltransferase (UGT) family of enzymes is involved in the metabolism of various compounds. These enzymes transfer a hydrophilic glucuronic acid moiety to their substrates, rendering them more water soluble and amenable to excretion. The UGTs act on various endogenous substrates, such as bilirubin, 17β-estradiol, and testosterone, and drugs and other xenobiotics. The function of these enzymes is essential for the clearance of drugs and toxicants, and alteration of UGT activity is a potential cause of adverse drug—drug interactions in vivo. This has stimulated an increased interest in the study of UGT function and inhibition, and the desire to profile new drug entities against UGT enzymes, similar to CYP450 profiling. However, certain factors have hindered the development of a robust method for UGT profiling. Current methods for assessing UGT enzyme activity are laborious and involve protein precipitation and/or chromatographic separation steps, which are not amenable to rapid screening applications for UGT inhibitors or substrates. The approach presented here is a bioluminescent assay for measuring UGT enzyme activity and inhibition in vitro. Using flexible, robust instrumentation in a 384-well microplate format, this study highlights the quick and easy assay implementation for estimation of inhibition kinetics with a variety of known and suspected UGT substrates and inhibitors.
Keywords
Introduction
Uridine 5′-diphospho-glucuronosyltransferase (UGT) enzymes transfer a hydrophilic glucuronosyl group from uridine 5′-diphospho-glucuronic acid (UDPGA) to a substrate. The resultant glucuronide is more hydrophilic, and therefore more amenable to elimination from the body. Through this function, the UGT enzyme family plays an important role in the elimination of drugs and other chemicals. Elimination of the heme metabolite bilirubin through glucuronidation is a key UGT function, catalyzed primarily by the UGT1A1 enzyme. 1 Infants who lack UGT1A1 activity (Crigler-Najjar syndrome) die without liver transplant because of accumulation of bilirubin, particularly in the brain, where it causes neuronal damage and impedes development. 2 Individuals with genetically reduced UGT1A1 activity (Gilbert's syndrome) are usually asymptomatic until a drug is administered that requires UGT1A1 activity for metabolism. 3 For example, the cancer drug irinotecan is glucuronidated after prior oxidation by a cytochrome P450 enzyme and this serves to detoxify the drug and facilitate its elimination. However, irinotecan causes neutropenia and diarrhea in Gilbert's patients because of reduced UGT1A1-dependent metabolism.
Inhibition of UGT enzyme activity by xenobiotics can also have an adverse effect. Tranilast (N-(3′,4′-demethoxycinnamoyl)-anthranilic acid), an oral antiallergic agent, induced hyperbilirubinemia in clinical trial participants. 4 This drug, also a substrate of UGT1A1, appears to inhibit bilirubin glucuronidation, presumably by acting as a competitive inhibitor of bilirubin conjugation. Phase I metabolites of tranilast are also found to inhibit glucuronidation of the parent compound. In addition, the selective tyrosine kinase inhibitor, Erlotinib, approved for the treatment of patients with non—small-cell lung cancer, has shown inhibitory and stimulatory effects on UGT1A1 and UGT1A4 glucuronidation, respectively. 5 Similar effects have also been seen with other UGT enzymes. The non-nucleoside reverse transcriptase inhibitor, Efavirenz, commonly prescribed in combination with 3ℙ-azido-3ℙ-deoxythymidine (AZT), showed similar UGT conjugation via the UGT2B7 enzyme as AZT. Therefore, potential adverse drug—drug interactions were seen, as each were shown to inhibit the glucuronidation of one another. 6
These effects of UGT inhibition and reduced UGT gene expression emphasize the importance of profiling potential drug compounds against UGT activity. Primary screening instrumentation, while excellent for delivering assay components when testing a single target, is not well suited for the more complex liquid-handling tasks that profiling can present. Suitable instrumentation must accurately titrate and dispense compounds, and deliver assay components to the desired microplate. Because multiple enzyme/substrate mixtures need to be dispensed to each assay plate, it is critical to have an instrument that can accurately aspirate and dispense multiple reagents at a time in low volumes.
Current methods to measure glucuronidation, which include centrifugation, or that use HPLC or LC/MS analyses, are also not amenable to higher-throughput, multi-well micro-plate formats. In this study, we demonstrate the ability to profile multiple compounds against the UGT enzymes 1A1, 1A4, and 2B7, using a novel luminescent assay in an automated fashion. These enzymes were included because of their role in conjugating important endogenous toxicants, such as bilirubin (1A1), or xenobiotics, such as AZT (2B7) and the anticonvulsant lamotrigene (1A4). The assay relies on UGT substrates that are precursors of D-luciferin, the light-generating substrate of firefly luciferase. These substrates are exposed first to UGT enzymes, then to firefly luciferase. In the absence of UGT activity, a full luminescent signal from luciferase is observed. However, the substrates are inactivated as luciferase substrates by glucuronidation and this causes a reduction in luminescence that is proportional to the amount of UGT activity. UGT inhibitors are detected as compounds that block the signal reduction by UGTs. A single set of detection reagents can be used in a homogenous format to assess the activity of multiple UGT enzymes. The simple “add and read” format, and no separation steps, make this method amenable to high-throughput applications. Close correlations with literature IC50 values for UGT inhibition confirm that the combination of chemistry and instrumentation described here provides a simple, yet robust solution for automated UGT profiling.
Materials and Methods
Materials
The luminogenic UGT enzyme assay systems (UGT-Glo) were obtained from Promega Corporation (Madison, WI). The systems contained luminogenic UGT enzyme substrates (a UGT multienzyme substrate or a UGT1A4 selective substrate) and a firefly luciferase reaction mixture. Diclofenac sodium, bilirubin, raloxifene, fluconazole, benazepril, and tamoxifen were purchased from Sigma-Aldrich Co. (St. Louis, MO), and ritonavir and indinavir were purchased from Sequoia Research Products Ltd. (Pangbourne, UK). Microsomes containing recombinant UGT enzymes (Supersomes), and control microsomes devoid of UGT activity, were purchased from BD Biosciences, Discovery Labware (Bedford, MA).
Liquid Handling
The Precision XS Microplate Sample Processor from BioTek Instruments, Inc. (Winooski, VT) was used to perform all compound dilutions, and dispense assay components to the wells of the assay plates (see Fig. 1A). The instrument contains a single-channel pipetting head, an eight-channel pipetting head, and an eight-channel bulk reagent dispenser. The eight-channel pipetting head was used for this application.
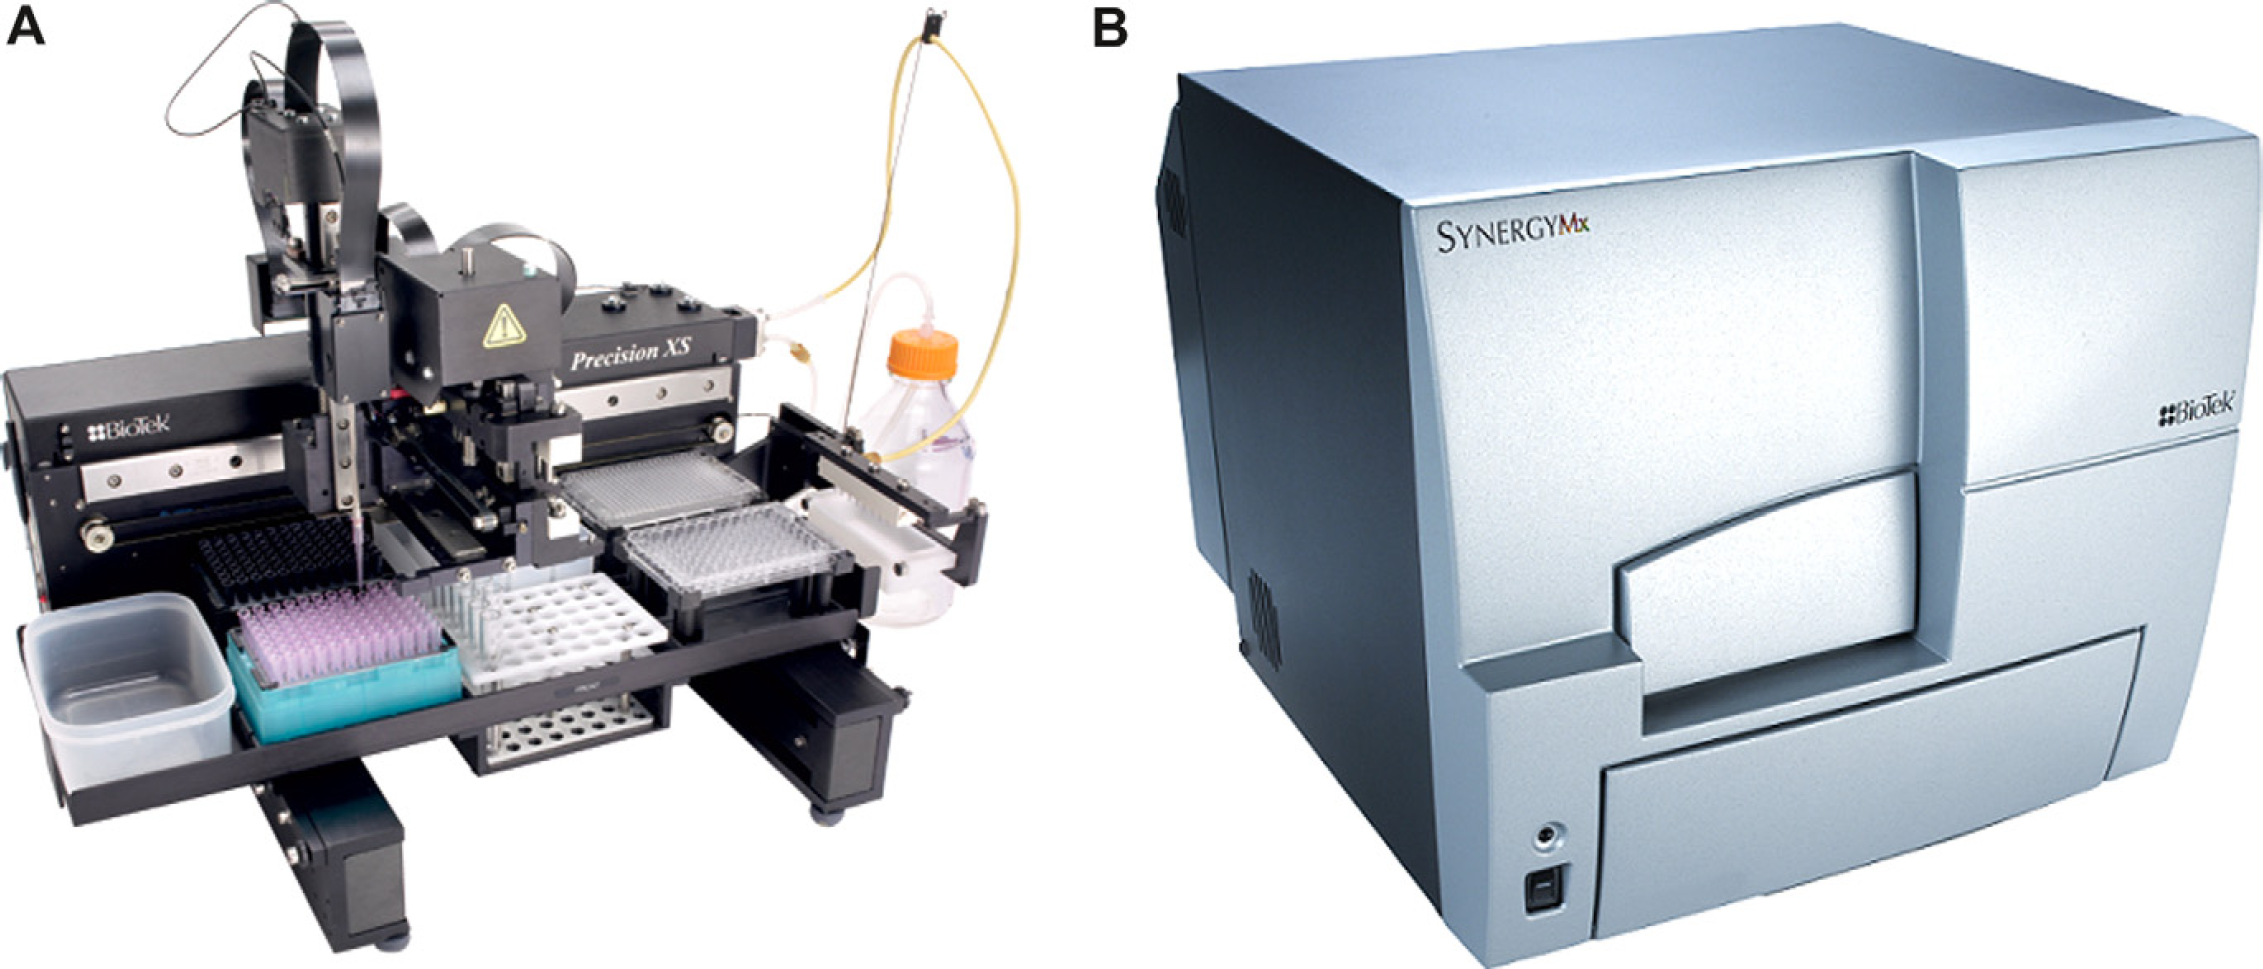
BioTek instrumentation. (A) The Precision XS was used to titrate compounds, and deliver all assay components to the assay plate. (B) The Synergy MX was used to quantify the luminescent signal from each reaction well.
Luminescent Signal Detection
Assay plates were read using a Synergy MX microplate reader from BioTek Instruments, Inc. (Winooski, VT) (see Fig. 1B). Luminescence detection was performed on the reader using a 1.0s integration time. The automatic sensitivity adjustment feature was used on the reader to detect the microplate well containing the highest luminescent signal, and gain settings were automatically adjusted to that well.
Incubation Conditions for UGT Enzyme Assays
All reaction incubations were conducted in white 384-well luminometer plates using a 37 °C incubator. The final reaction volume (20 μL per 384-well) consisted of UGT reaction buffer (50 mM TES, pH 7.5, 8 mM MgCl2), 4 mM UDPGA or an equivalent volume of water, and 20 μM UGT multienzyme substrate with 0.1 mg/mL UGT1A1 or 0.1 mg/mL UGT2B7 Supersomes; or 50 mM UGT1A4 substrate with 0.4 mg/mL UGT1A4 Supersomes. Negative control reactions contained the same components as UGT reactions, except the UGT Supersomes were replaced with an equivalent amount of control microsomes, devoid of UGT activity. UGT1A1, UGT2B7, and UGT1A4 reactions were terminated after 150, 120, or 240 min, respectively, by addition of 20 μL firefly luciferase reaction mixture supplemented with 20 mM D-cysteine (LDR). The assay is performed by first combining a 4x concentrated test compound solution or vehicle with a 4x concentrated UDPGA solution or water control. The assay is then initiated by adding a 2x concentrated mixture of UGT substrate plus UGT enzyme or control membranes (prepared in 2x UGT reaction buffer). After the specified incubation time, UGT activity is detected by adding LDR and reading luminescence. Test compounds were diluted to 4x concentrations in water from concentrated stocks in dimethyl sulfoxide (DMSO), methanol, or water. Final 1 × solvent concentrations were 1% or less in all the reactions.
Automated Workflow
Assay Setup. Labcon 200 μL Robotic Tips (BioTek Catalog # 98254) were used for diluent addition and serial dilutions, and delivery of microsome/substrate mixes and LDR to the assay plate. Labcon 50 μL Robotic Tips (BioTek Catalog # 98250) were used to transfer the dilution series, vehicle, UDPGA, and water to the assay plate. Dilutions were carried out in 96-well format using 0.5 mL clear V-bottom polypropylene plates (Corning Catalog # 3957, Lowell, MA). Enzyme reaction and control reaction components were placed into 96-well U-bottom microplates (Promega Catalog # A9161) for the automated methods. The detection reagent was placed into a Greiner MASTERBLOCK, 1 mL U-bottom 96-well micro-plate (Greiner Bio-One Catalog # 780 201, Monroe, NC) when running the automated methods. Assays were performed in 384-well format using white 384-well low flange flat-bottom polystyrene microplates (Corning Catalog #3572). table 1 describes the automated protocol; 50 mM compounds were prepared in 100% DMSO for all the experiments. The exceptions were diclofenac, which was prepared at 40 mM in water, indinavir, which was prepared at 50 mM in water, and bilirubin, which was prepared at 25 mM in 100% methanol. All the compounds were diluted in water from 100x concentrated stocks to a 4x concentration, with the exception of diclofenac, where the 4x concentration was 40 mM. Diluted compounds, or an equivalent concentration of vehicle for no compound controls, were dispensed at 5 μL volumes. A 5 μL addition of 4x UDPGA or water followed. The reactions were initiated by adding 10 μL 2x control membrane/substrate or UGT/substrate mixes, making the enzyme reaction a total of 20 μL. After the appropriate 37 °C reaction incubation time, 20 μL of LDR was then added to each well to stop reactions and initiate a stable glow-style luminescent signal. The microplate was incubated at room temperature (approximately 21 °C) for 20 min before being placed in the microplate luminescence reader. Assay components were premixed 5x using the automated pipettor before delivery, to ensure reagent consistency within the well, with exception of the detection reagent, which was premixed 1 × to prewet the tips. All assay plates were mixed on an orbital shaker for 30 s at approximately 1000 rpm after the addition of all the components.
Uridine 5ℙ-diphospho-glucuronosyltransferase (UGT)-Glo automated 384-well screening protocol
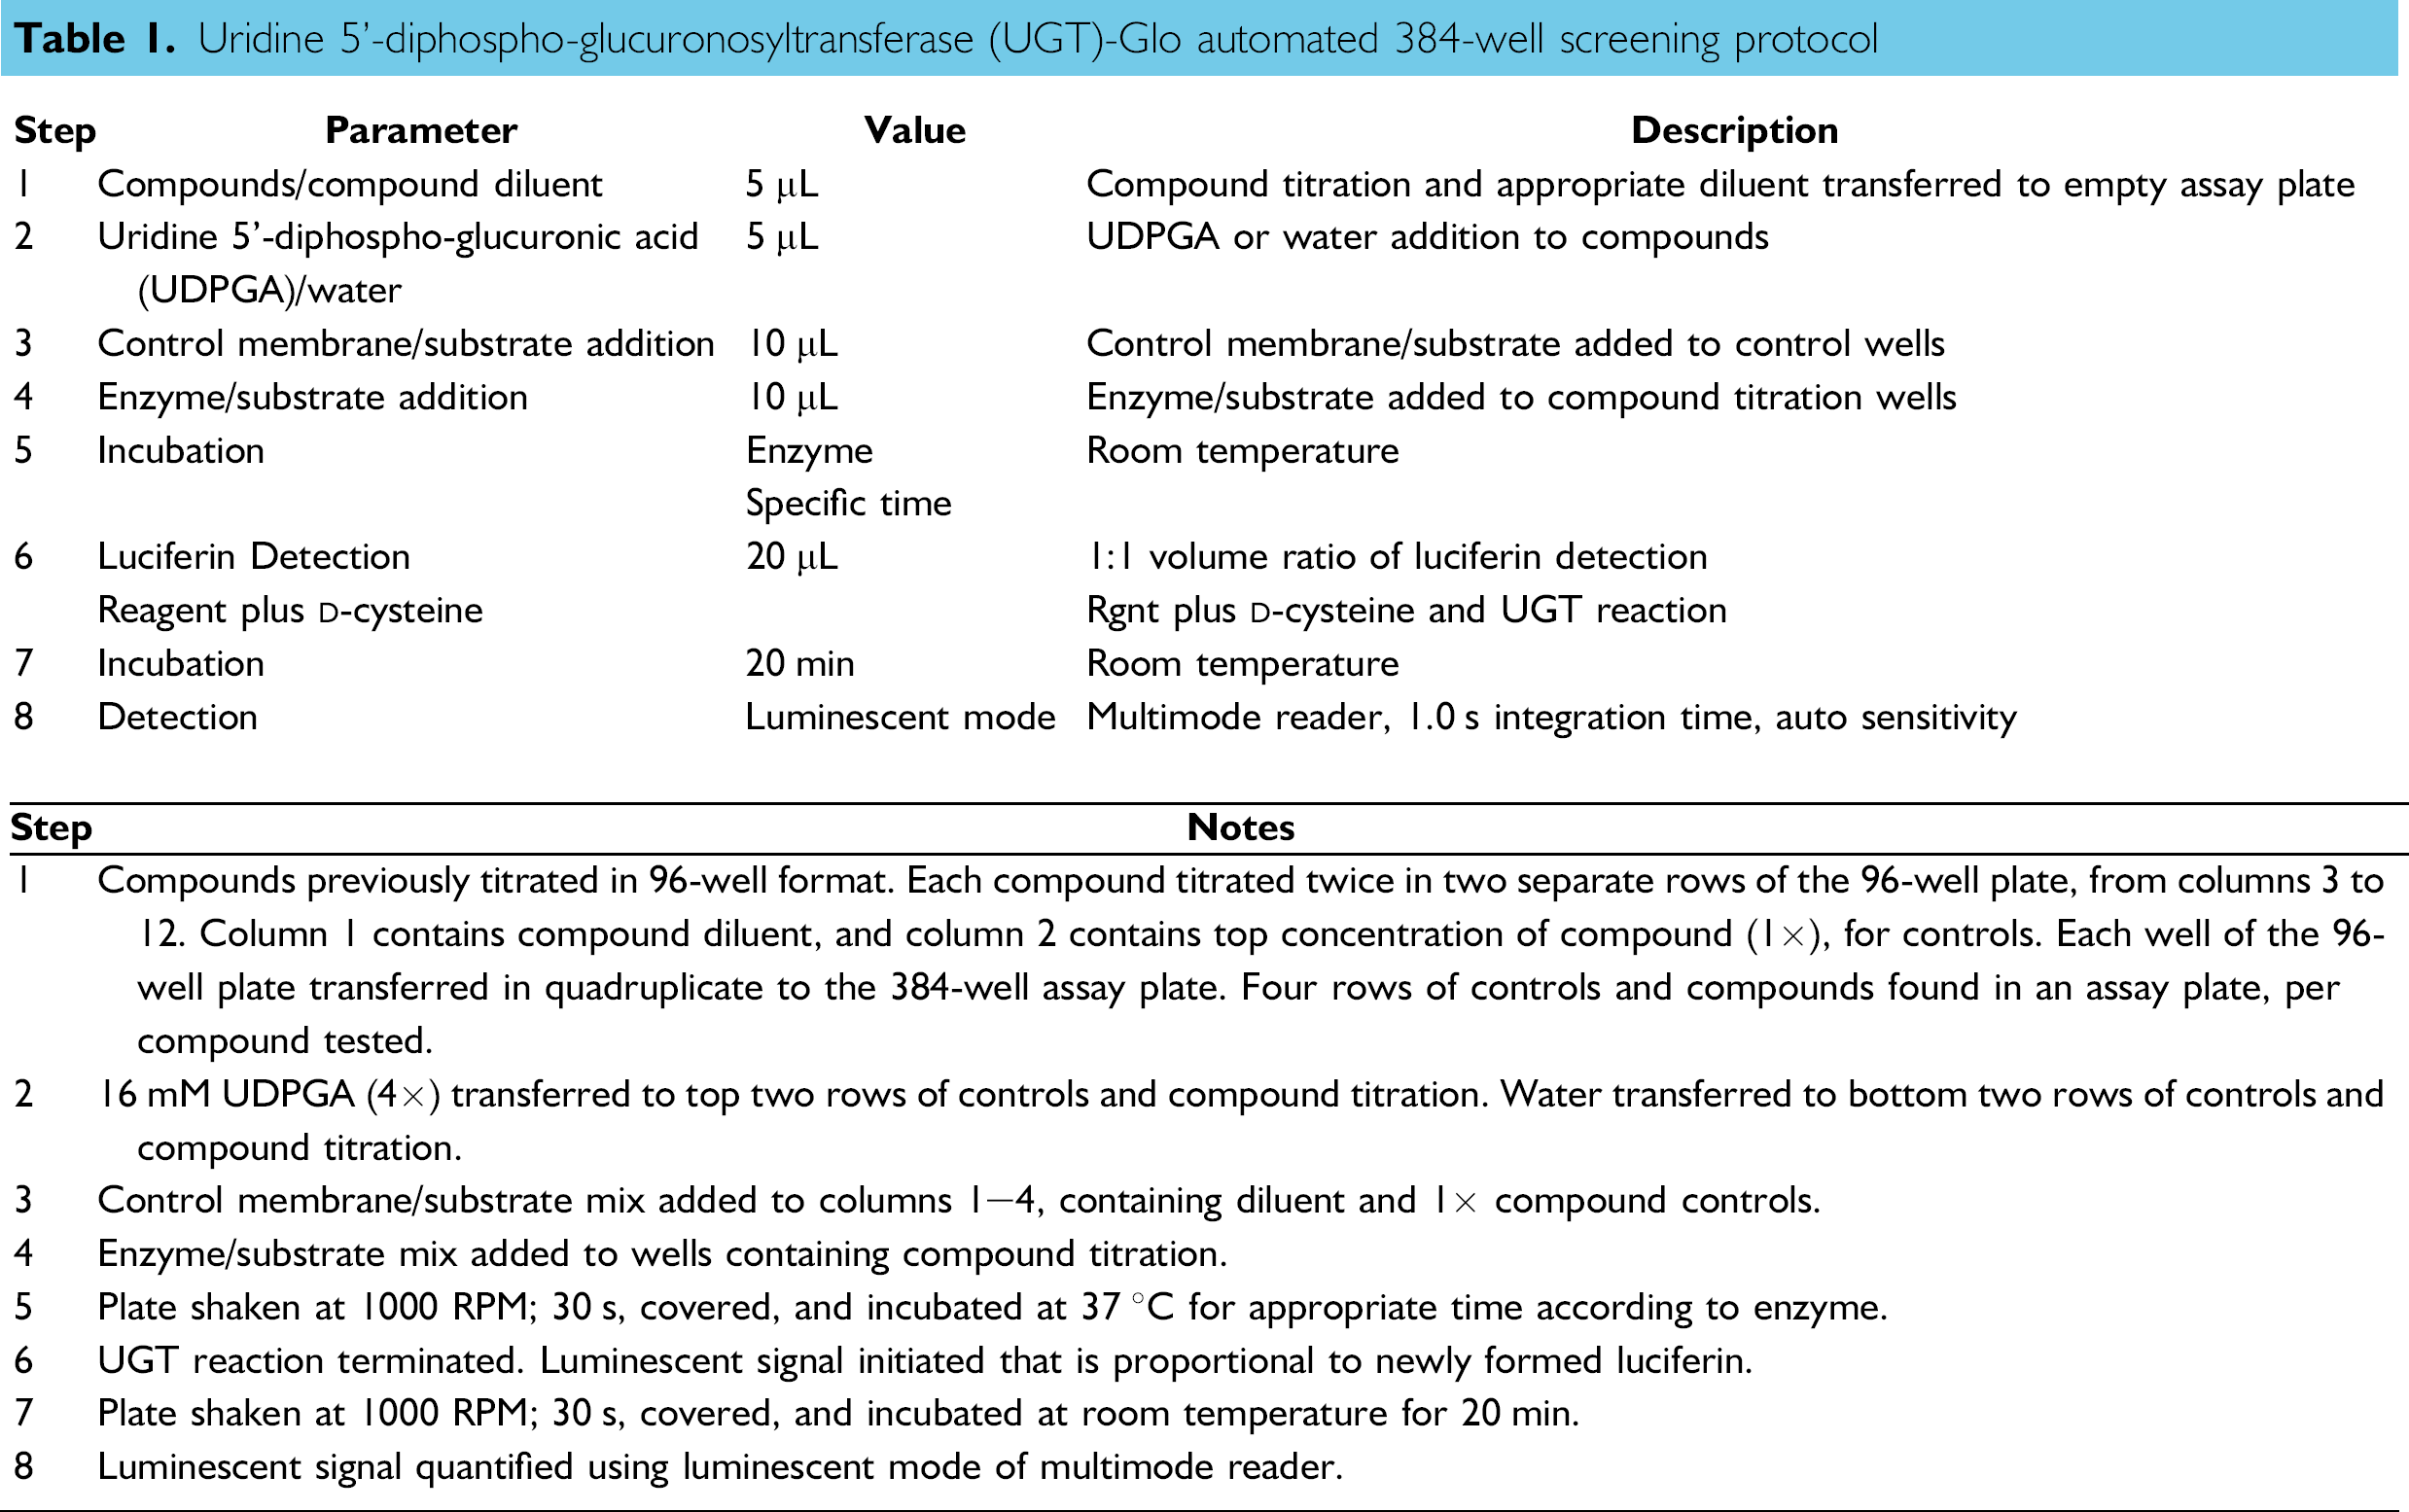
Z' Measurements with Selective Inhibitors. Forty-eight 5 μL replicates each of 0 or 100 μM inhibitor, in 0.8% DMSO, were added to the assay plate. Raloxifene was used as the inhibitor for UGT1A1 and 2B7; ritonavir was used as the inhibitor for UGT1A4. A total of 5 μL of 16 mM UDPGA (4×) was added to 24 replicates of each inhibitor and 5 μL of water was added to the other 24 replicates. UDPGA is a necessary cofactor for UGT activity so samples with the UDPGA are active and those that only received water are inactive controls. This was followed by a 10 μL addition of enzyme/substrate mix. Subsequent mixing, incubation, and detection reagent additions were performed as described in table 1.
IC 50 Determinations. The compound screening procedure was run as two separate steps on the automated liquid handler (Fig. 2). Compound dilution in a 96-well microplate and transfer of compounds to a 384-well assay plate composed the first step, whereas UGT assay reagent addition to the 384-well assay plate composed the second step. For step 1, 130 μL of diluted vehicle and 130 μL of 4× test compounds were added to columns 1 and 2, respectively, and 180 μL of 4× test compounds were added to column 3 of a 96-well 0.5 mL microplate. Each compound was added to two adjacent rows for a total of four compounds per 96-well microplate. Diclofenac was prepared at a starting 4x concentration of 40 mM; ritonavir, indinavir, fluconazole, benazepril, raloxifene, and tamoxifen were prepared at a starting 4x concentration of 2 mM; and bilirubin was prepared at a starting 4x concentration of 1 mM. The appropriate diluted vehicle (120 μL) was added to columns 4–12, and 60 μL of compound was transferred from column 3 to column 4, column 4 was mixed 12 times using a volume of 120 μL and the process was repeated to create a 1:3 dilution series from columns 2–11. Column 12 retained diluents alone for zero compound controls; 5 μL from each well of a dilution series microplate was then transferred in quadruplicate to a 384-well assay plate. For step 2, 5 μL of 4x UDPGA (16 mM) or water was added to the assay plate, as explained in Figures 2; 10μL of control membrane mixture was then added to the first four columns of the assay plate, containing diluted vehicle and the top compound concentration. Finally, 10 μL of enzyme/substrate mixture was added to the wells containing the compound titration. All subsequent mixing, incubations, and detection reagent additions were performed as described in Table 1.
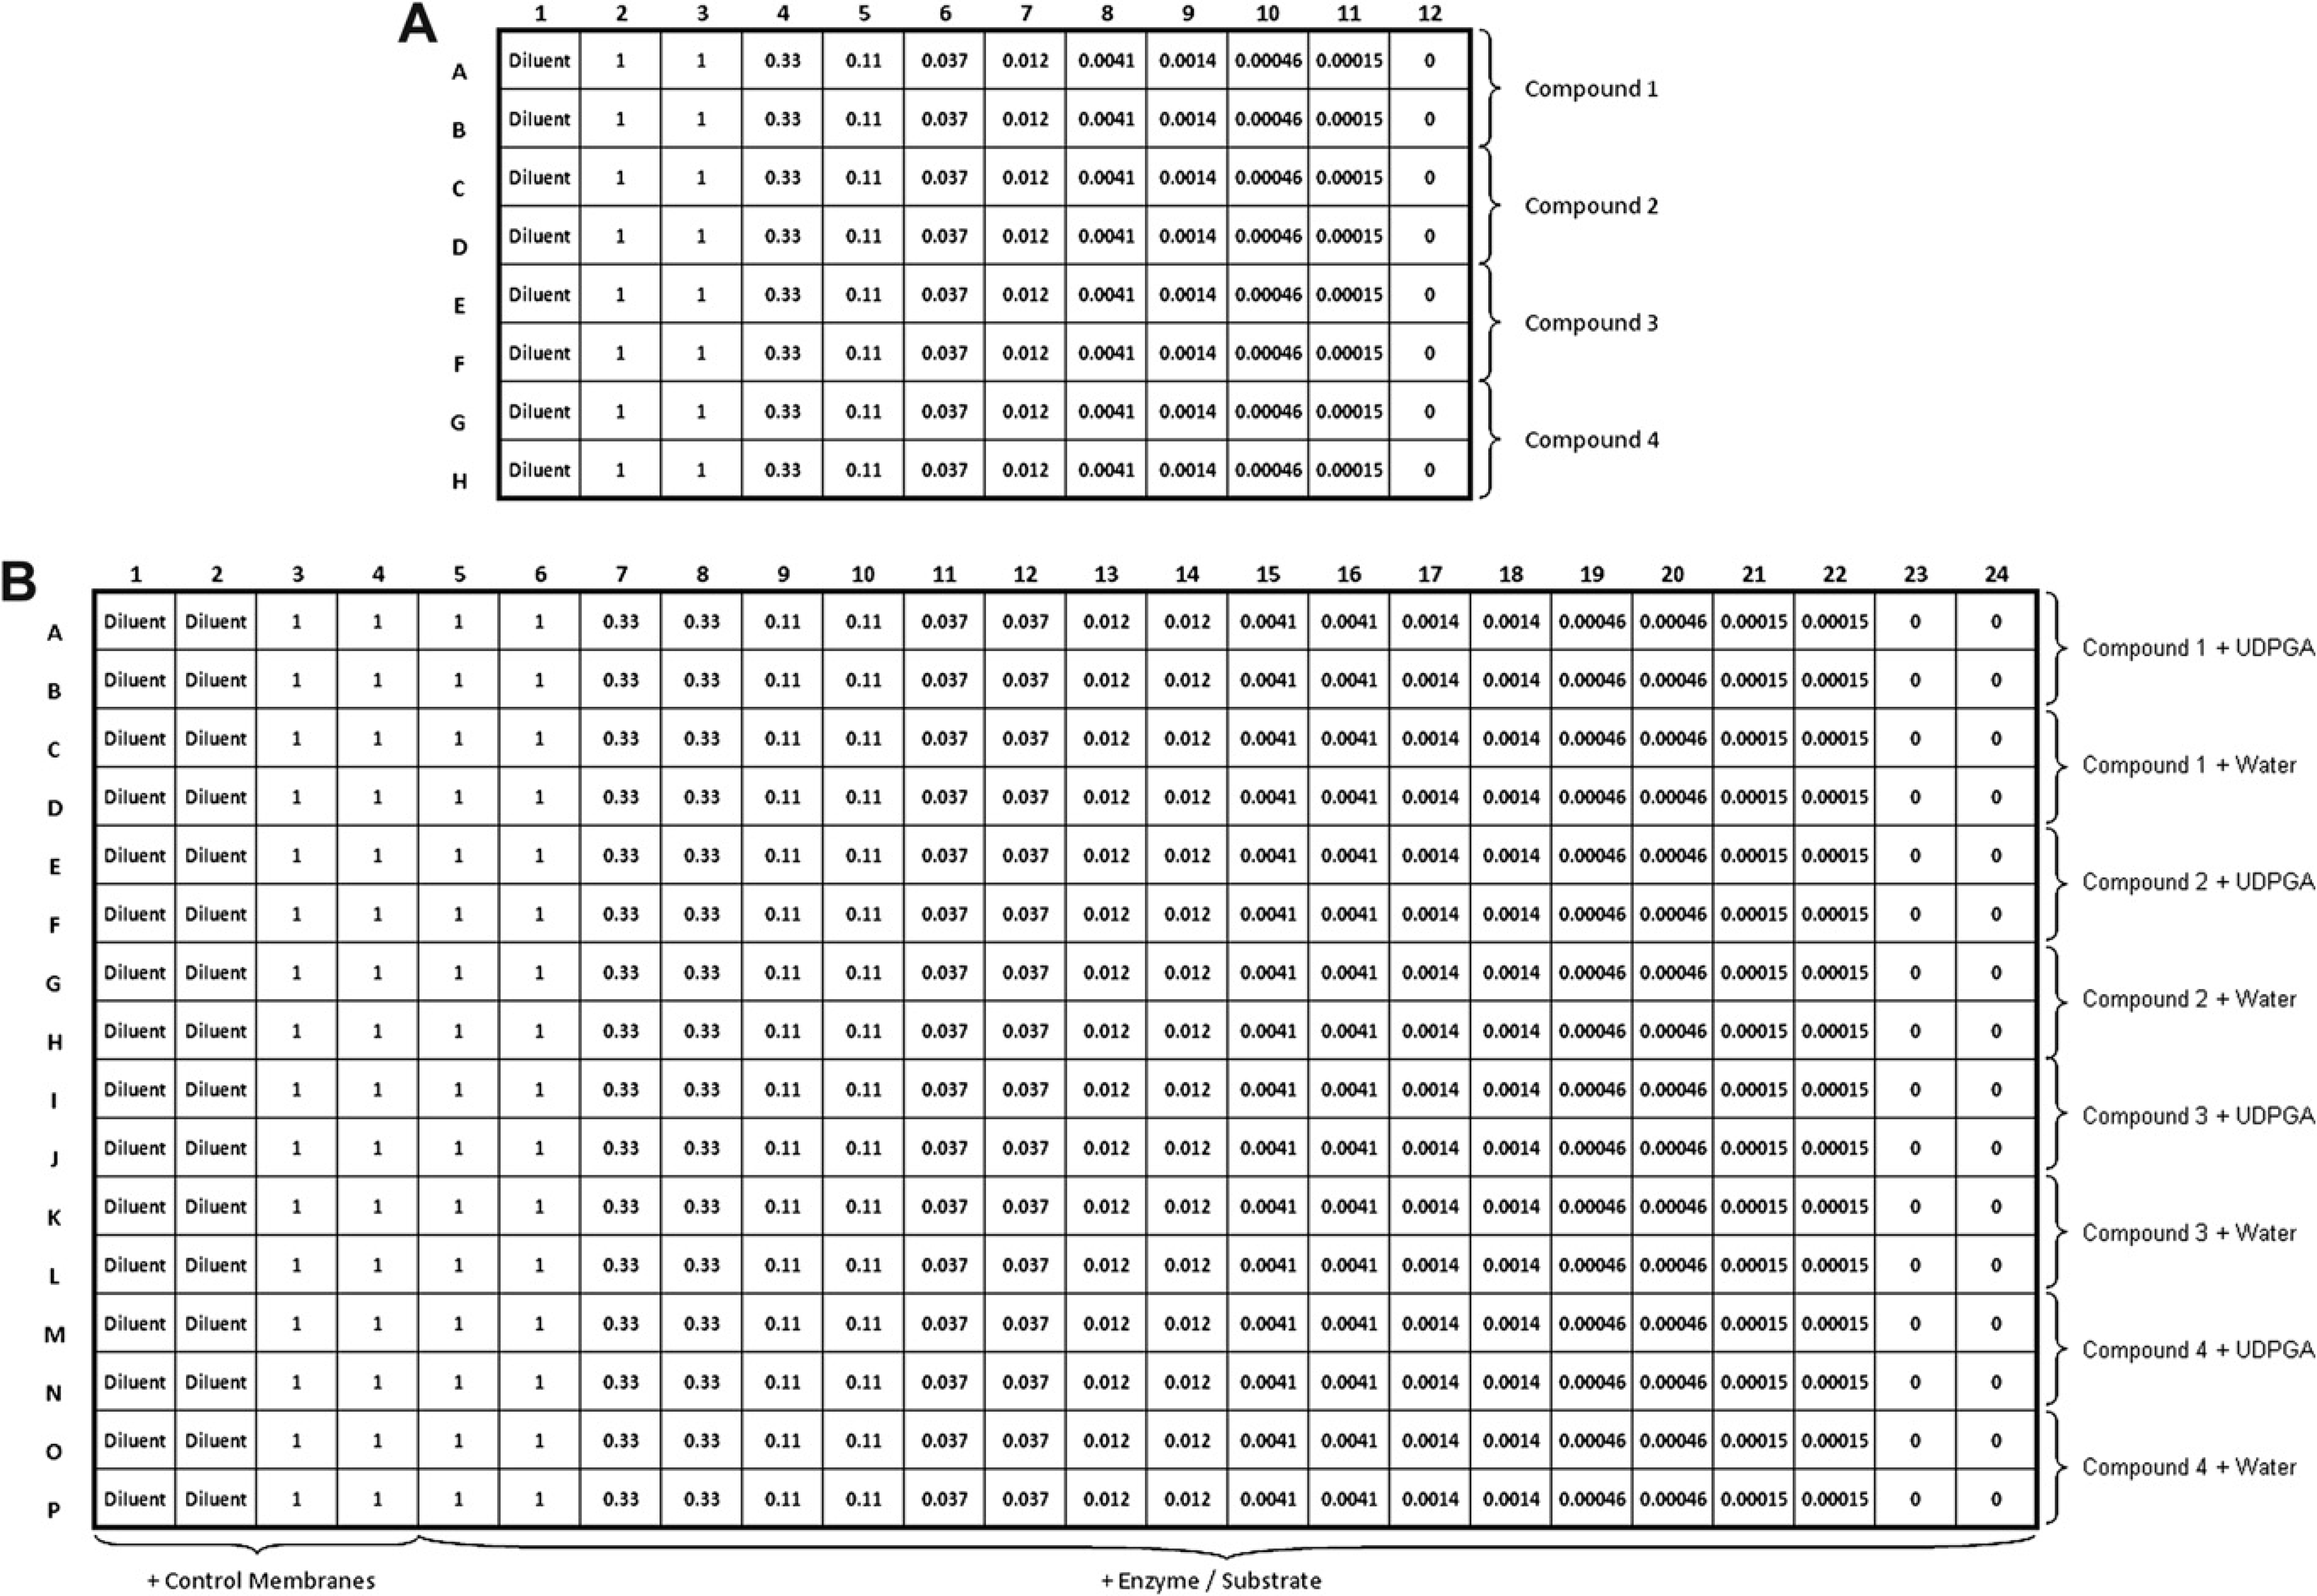
Titration and assay plate layouts. (A) 96-Well titration plate—column 1: compound diluent; column 2: top compound concentration (1 x); columns 3–12: serial 1:3 compound titration. Rows A-B contained compound 1, rows C-D contained compound 2, rows E-F contained compound 3, and rows G-H contained compound 4. (B) 384-Well assay plate—columns 1–2: compound diluent plus control membrane/substrate mix; columns 3–4: 1 x compound concentration plus control membrane/substrate mix; columns 5–24: serial 1:3 compound titration plus enzyme/substrate mix. Rows A-D contained compound 1, rows E-H contained compound 2, rows I-L contained compound 3, and rows M-P contained compound 4. Uridine 5ℙ-diphospho-glucuronosyltransferase was added to the top two rows of each four-row section, and water was added to the bottom two rows.
Data Analysis
The UGT-Glo Assay correlates a decrease in relative light units (RLUs) with UGT enzyme activity. This decrease, or delta RLU, is calculated as a raw value from the plus UGT samples by subtracting the active plus UDPGA values from the inactive minus UDPGA values (UDPGA is a requisite UGT cofactor). A small nonspecific delta RLU plus and minus UDPGA is also observed in the negative, minus UGT controls and this is subtracted from the raw value to give net delta RLU. The following equation explains how net delta RLU is calculated: net DRLU = (S – Su) – (C – Cu), where S is a sample plus UGT enzyme and without UDPGA, Su is a sample with UGT enzyme and with UDPGA, C is a sample without UGT enzyme and without UDPGA, Cu is a sample without UGT enzyme and with UDPGA. C and Cu are referred to as negative controls. Net delta RLUs from positive control reactions (plus UGT, plus UDPGA, minus test compound) are arbitrarily set as 100% activity, and changes caused by test compounds are expressed relative to the 100% value (Fig. 3). The negative controls (columns 1–4, Fig. 2) were either with or without the top concentration of test compound. Negative controls with test compounds were included to verify that addition of compound did not affect assay background. Because no significant effect was observed, negative controls were averaged to calculate background delta RLU. For example, for compound 1 in Figures 2, the average of columns 1–4, rows A and B, were subtracted from the average of columns 1–4, rows C and D to give the background delta RLU.
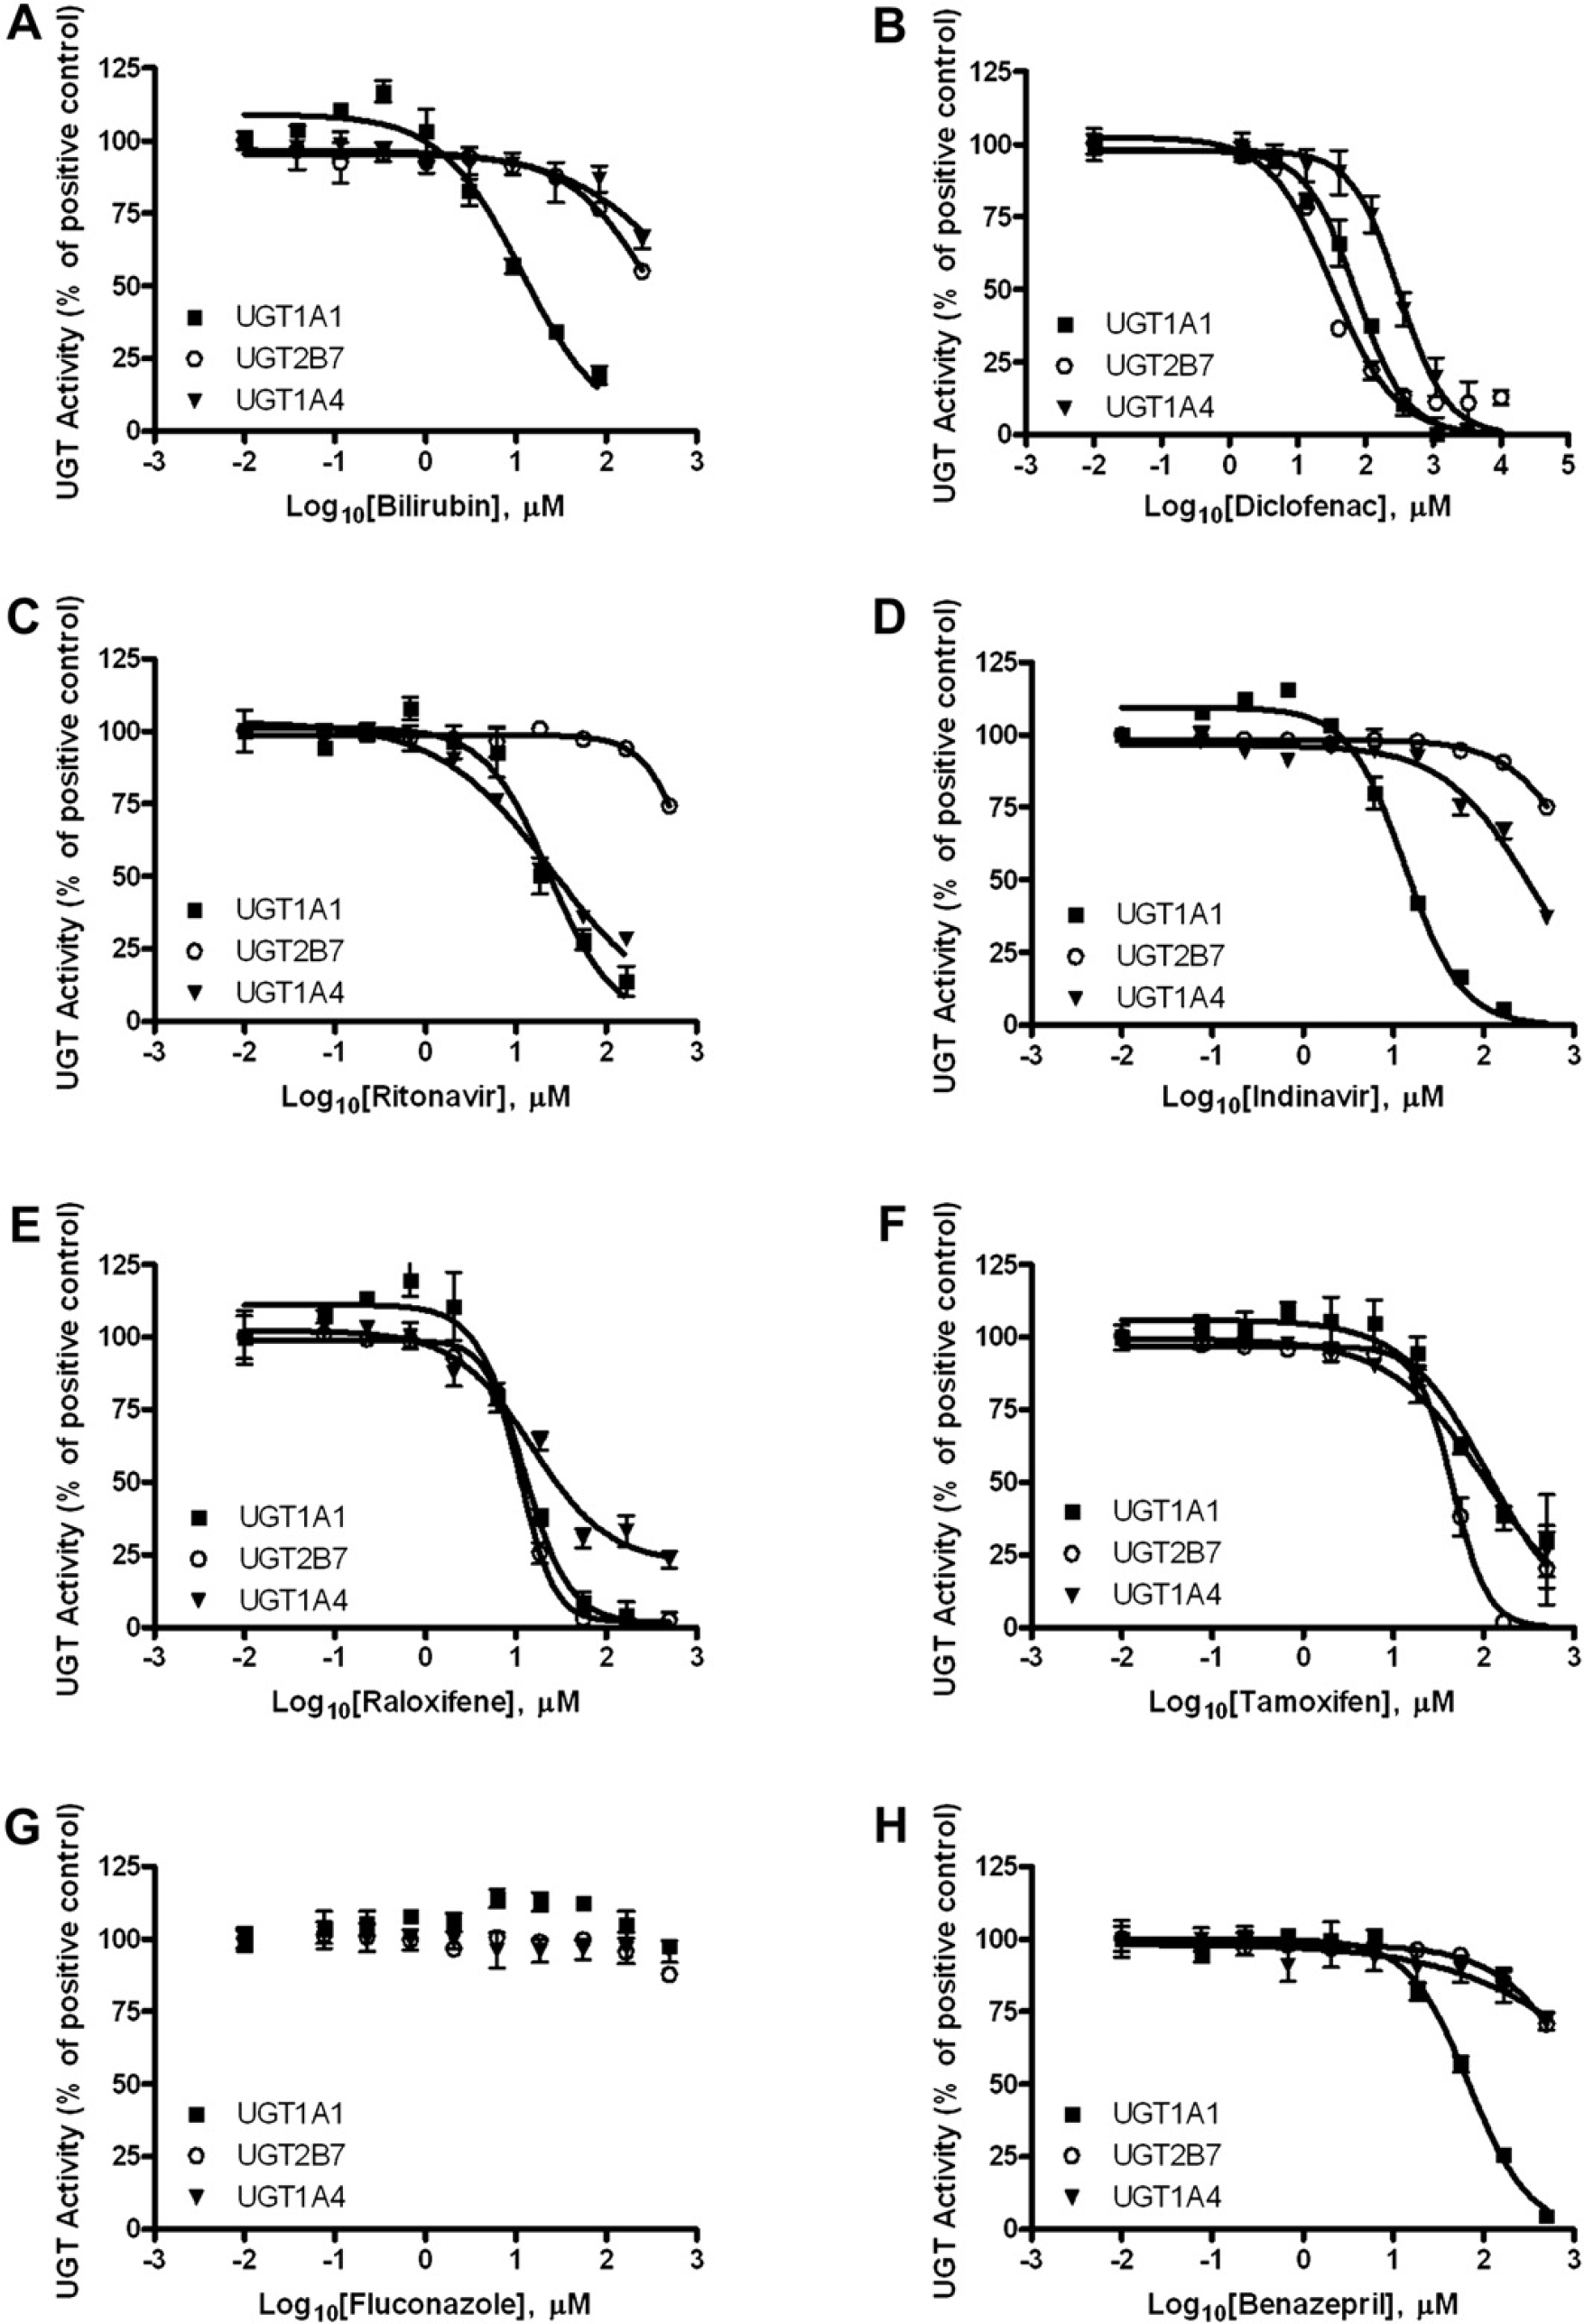
Measuring uridine 5ℙ-diphospho-glucuronosyltransferase (UGT) inhibition using the UGT-Glo Assay. Inhibition of UGT1A1, UGT2B7, and UGT1A4 was probed with A bilirubin, B diclofenac, C ritonavir, D indinavir, E raloxifene, F tamoxifen, G fluconazole, and H benazepril. The multienzyme substrate was used as the substrate for UGT1A1 and UGT2B7, both at 20 μM. The UGT1A4 substrate was used as the substrate for UGT1A4 at 50 μM. Dose—response curves were fitted using GraphPad Prism Version 5.0I.
A nonlinear regression curve fit was used in Prism, version 5.01, from GraphPad Software (La Jolla, CA) to generate inhibition curves and calculate all compound IC50 values.
Results and Discussion
In this UGT assay, conjugation of a luminogenic substrate correlates to a decrease in luminescent signal. A nonselective substrate, referred to as a multienzyme substrate, is used for UGT1A1 and UGT2B7, and a UGT1A4 selective substrate for UGT1A4. 7 To establish an ample assay window, incubation conditions (enzyme concentration and reaction time) were determined in standard 384-well microplates so that 30–40% of the multienzyme substrate was conjugated by UGT1A1, ∼70% of the multienzyme substrate was conjugated by UGT2B7, and 40–50% of the UGT1A4 substrate was conjugated by UGT1A4. These conditions are reported in the materials and methods. Incubation conditions were within the linear range for the assay, previously determined by the manufacturer.
Once the initial reaction conditions were ascertained, the assay quality was assessed by generating Z' values using known inhibitors for each UGT isoform. Z' takes into account not only the assay window between positive and negative controls, but also the variability within each set of measurements. 8 Assay quality is considered acceptable when Z' is ⩾0.5. For this application, known inhibitors at concentrations of 0 and 100 μM were used as the positive and negative controls, respectively. Z' values generated for each isoform—inhibitor combination were 0.56 for UGT1A4, 0.62 for UGT1A1, and 0.75 for UGT2B7, indicating that each of the optimized reactions provides for a high-quality assay.
A panel of compounds known or suspected to have activity as UGT substrates or inhibitors was titrated against the UGT1A1, UGT1A4, and UGT2B7 enzymes (Fig. 3, Table 2). IC50 values were obtained by fitting percent activity data to a sigmoidal dose—response curve. The first of the compounds in the screen, bilirubin, showed relatively selective UGT1A1 inhibition (Fig. 3A, Table 2). Although both UGT1A4 and UGT2B7 had IC50 values above 250 μM, UGT1A1 had an IC50 value of 11.7 μM. This is within the expected IC50 range for UGT1A1, given the literature reported IC50 of 31.7 μM for bilirubin as a UGT1A1 substrate. 9
Inhibition of UGT1A1, UGT2B7, and UGT1A4
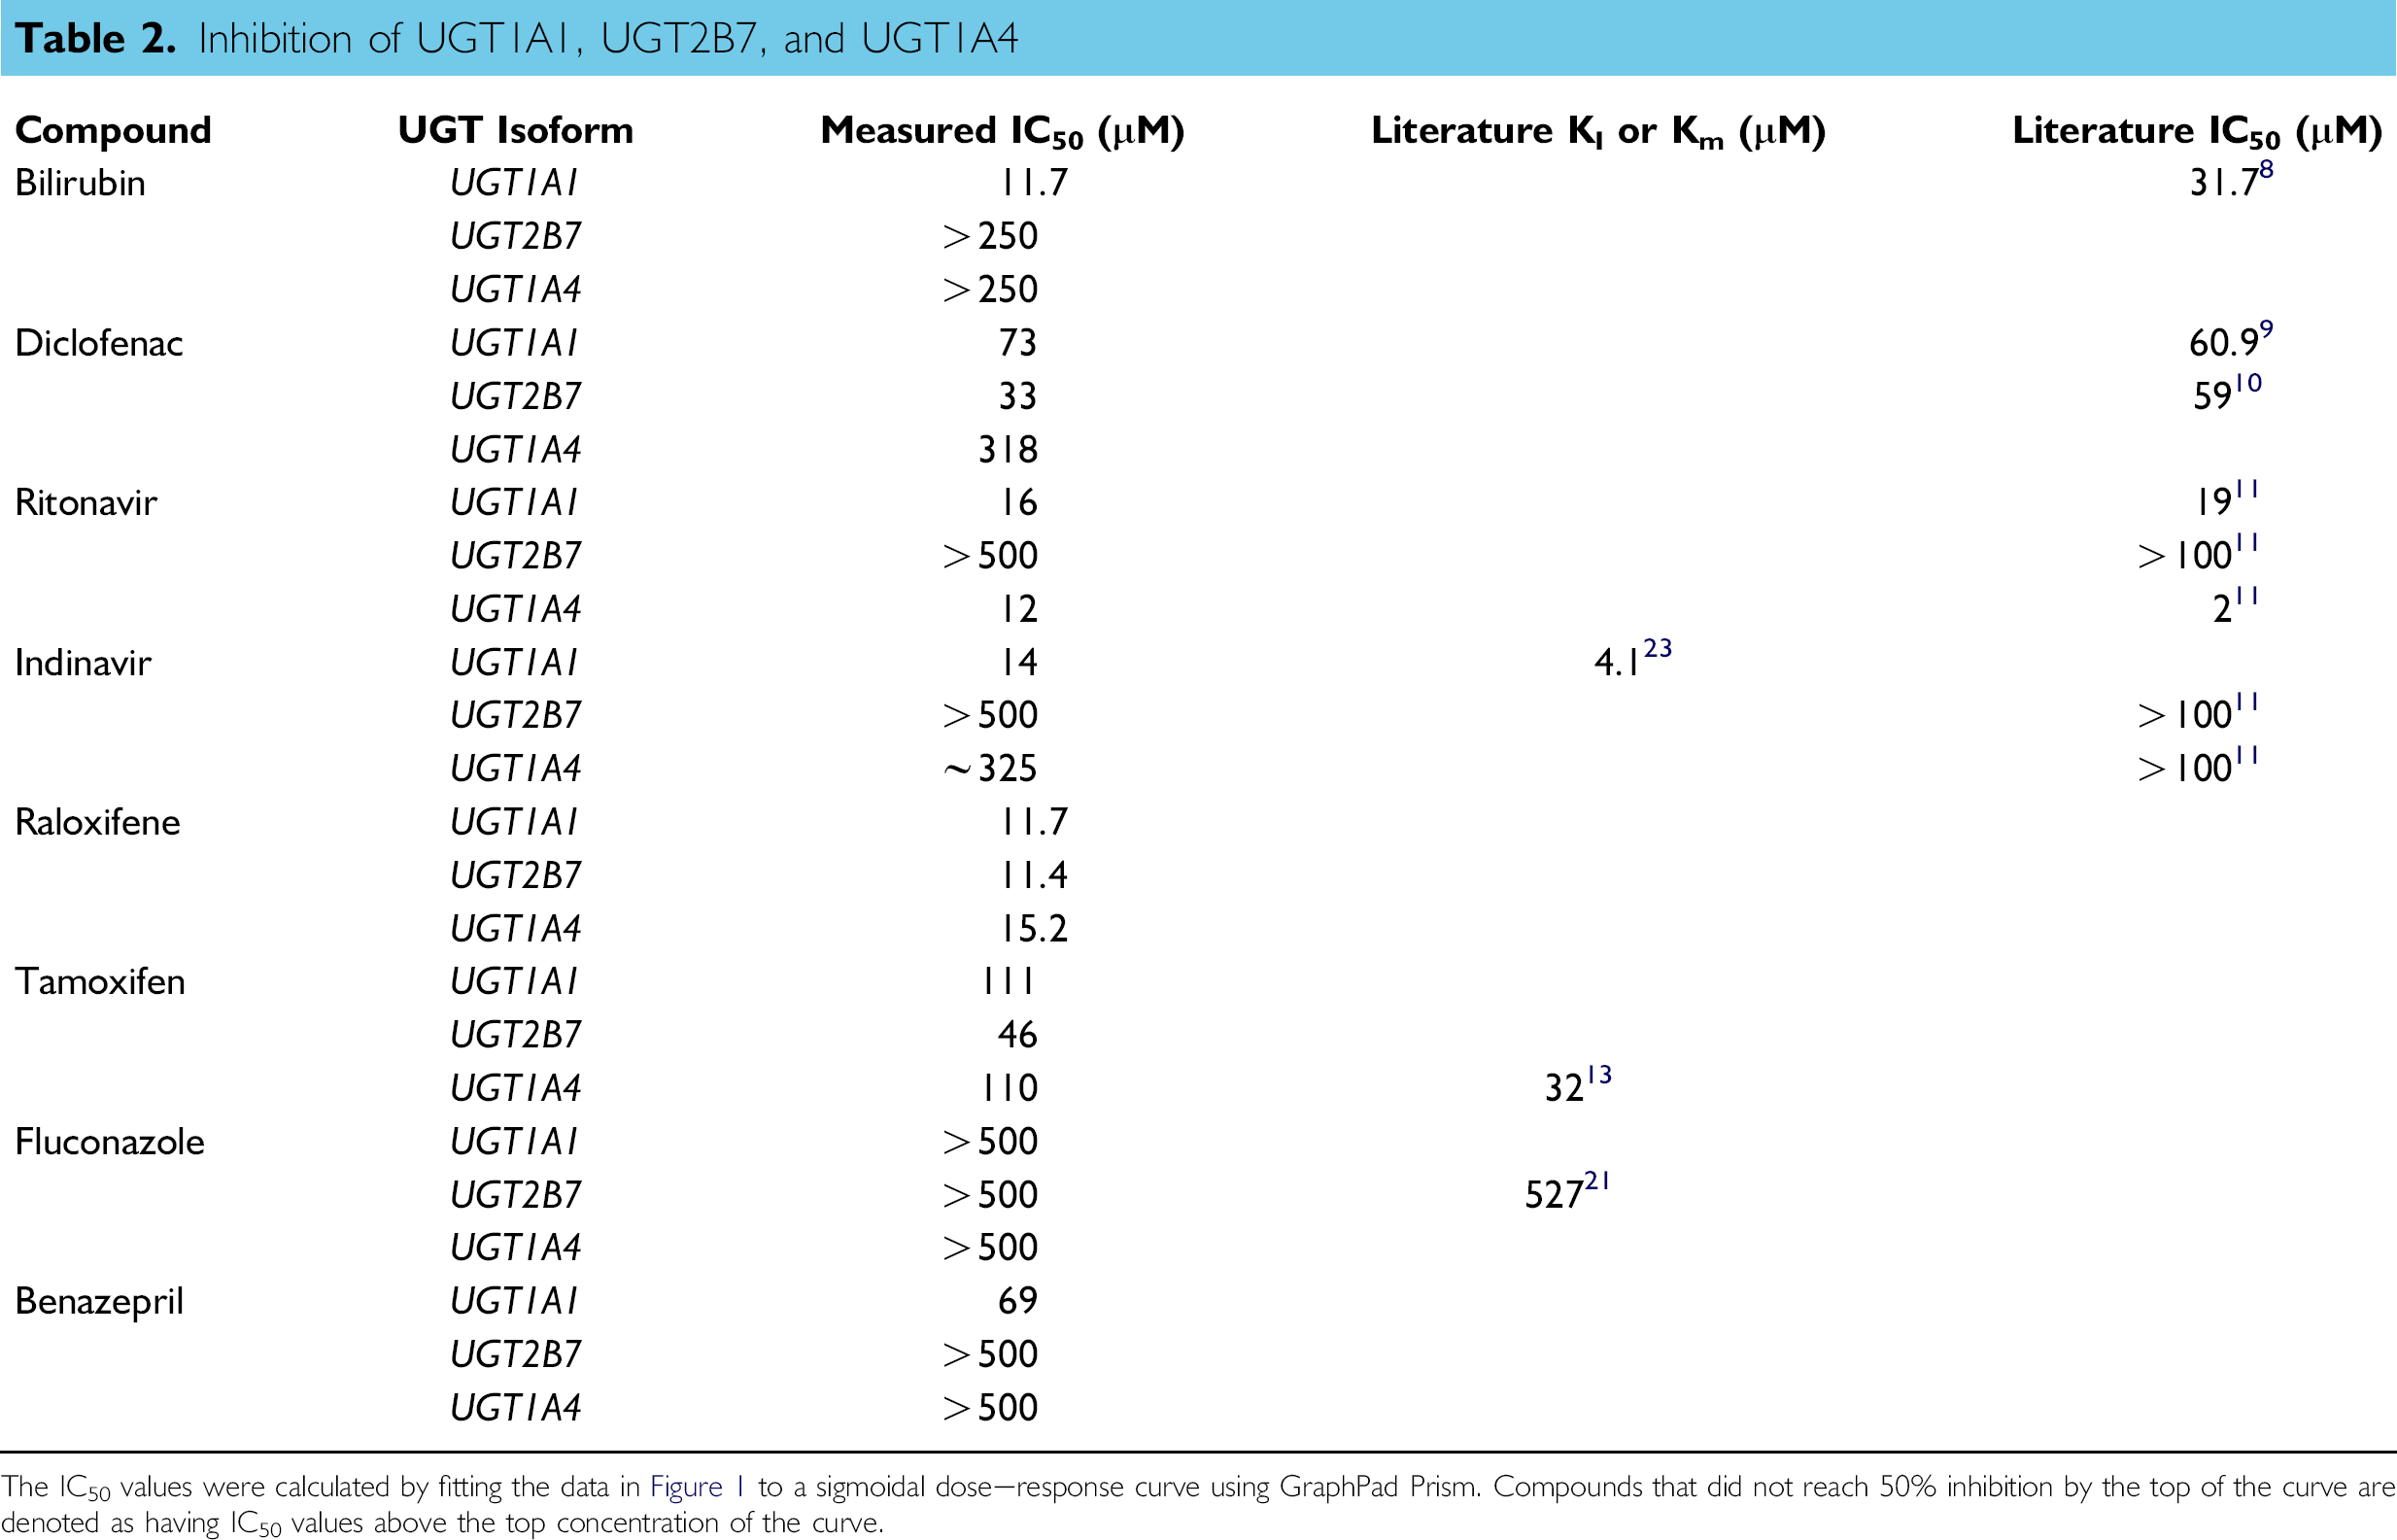
The IC50 values were calculated by fitting the data in Figures 1 to a sigmoidal dose—response curve using GraphPad Prism. Compounds that did not reach 50% inhibition by the top of the curve are denoted as having IC50 values above the top concentration of the curve.
The second compound in the screen was diclofenac sodium (Voltaren, Novartis, Basel, Switzerland), a nonsteroidal anti-inflammatory drug that inhibited recombinant UGT1A1 and 2B7 using the multienzyme substrate, and also inhibited UGT activity with the multienzyme substrate in human liver microsomes (data not shown). The IC50 value obtained for UGT1A1 was 73 μM (Fig. 3B, table 2), which is similar to a IC50 of 60.9 μM reported for the inhibition of UGT1A1 of estradiol 3beta-glucuronidation by diclofenac. 10 The IC50 value obtained for UGT2B7 was 33 μM, which is close to the reported IC50 of 59 μM for UGT2B7 with diclofenac. 11 An IC50 value of 318 μM was obtained for UGT1A4, although evidence of diclofenac as either a substrate or inhibitor of UGT1A4 was not found in the literature.
Two additional compounds tested were HIV protease inhibitor drugs, ritonavir (Norvir, Abbott Laboratories, Abbott Park, IL), and indinavir (Crixivan, Merck & Co., Inc., Whitehouse Station, NJ). It was thought that these drugs would be a good test of the assay system because it has been reported that UGT2B7 is not greatly inhibited by either drug. UGT1A1 is inhibited by both drugs, and UGT1A4 is inhibited by ritonavir but not indinavir. 12 These findings were replicated in the screen. The IC50 values for UGT1A1 with ritonavir and indinavir were 16 and 14 μM, respectively, compared with a reported IC50 of 19 μM for ritonavir against UGT1A1 with bilirubin as substrate 12 and a reported UG-T1A1 Km of 4.1 μM for indinavir 13 (Table 2). A compound such as indinavir that is a UGT substrate is also expected to act as a competitive inhibitor of UGT activity against a different substrate. In that regard, the similarity between the indinavir IC50 measured here and its reported Km are expected in that both values reflect its affinity for the UGT1A1 active site. 14
There was very little inhibition of UGT2B7 by either drug (Figures 3C, D), consistent with reported IC50 values above 100 μM. 12 Ritonavir inhibited UGT1A4 with an IC50 of 12 μM, but indinavir only weakly inhibited UGT1A4 with an IC50 just short of 500 μM, which is consistent with the previous report. 12
Raloxifene (Evista, Eli Lilly and Company, Indianapolis, IN), an antiestrogen drug used to treat osteoporosis, was found to be glucuronidated by UGT1A1, UGT1A8, UGT1A9, and UGT1A10, but not UGT1A4 and UGT2B7. 15 In accordance with this report, the screen found UGT1A1 inhibition by raloxifene, presumably because it is a competitive substrate (Fig. 3E, Table 2). Raloxifene also inhibited UGT2B7 and UGT1A4, and in light of the report that the drug is not conjugated by these enzymes, this suggests a noncompetitive mechanism.
Tamoxifen, an antiestrogen used to treat and prevent breast cancer was reported to be N-glucuronidated, primarily by UGT1A4. 16 4-Hydroxytamoxifen and endoxifen, metabolites of tamoxifen, are also glucuronidated by UGT2B7 and to a lesser extent by UGT1A1. 16, –19 In this screen, tamoxifen inhibited UGT1A4 (IC50 = 110 μM, Fig. 3F, Table 2), but not as potently as expected (Km = 32.0 μM 20 ). This difference may be an example of substrate-dependent variation of UGT inhibition, which has been reported previously. 21 Inhibition of UGT1A1 and UGT2B7 was also seen, which is not unexpected as the related compound 4-hydroxytamoxifen is a substrate for these enzymes. 16, –19
The antifungal fluconazole (Diflucan, Pfizer, Inc., New York, NY) was included in this screen because it was reported to be a selective inhibitor of UGT2B7. 22 However, the KI reported for fluconazole using zidovudine as a substrate is 529 μM. 22 Consistent with this report, no inhibition was seen below 500 μM with any of the isozymes (Fig. 3G).
Benazepril (Lotensin, Novartis Pharmaceuticals Corporation, Basel, Switzerland), which is de-esterified to an angiotensin-converting enzyme inhibitor in the liver, was screened because it was reported to be glucuronidated. 23 Benazepril had little effect on UGT2B7 and UGT1A4, but inhibited UGT1A1 with an IC50 of 69 μM (Fig. 3H, table 2). This result suggests that, of these three enzymes tested, UGT1A1 is most likely to either metabolize benazepril or be inhibited by this drug.
Conclusions
This study shows the utility of a luminogenic UGT assay in screening for potential UGT substrates and inhibitors, and for determining their IC50s and UGT specificity. The miniaturization to 384-well format not only makes the assay amenable to low- to medium-throughput screening and robotic liquid handling, but also saves the researcher the cost of large reactions containing expensive cofactor and high enzyme concentrations. This probe-based UGT assay is of particular value for discovery phase ADME profiling and triaging of compound sets before the more laborious development phase mass spectrometry—based methodologies.
Competing Interests Statement: The authors disclose that Brad Larson is employed by BioTek Instruments as a principal scientist; Peter Banks is employed by BioTek Instruments as a scientific director; and James Cali is employed by Promega Corporation as a senior R&D scientist.