
Abstract
The
Introduction
Instrument laboratories produce large amounts of analytical data that must be efficiently processed for review, especially during an emergency. 1 The laboratory information management system (LIMS) described here was implemented in an emergency response laboratory at the Centers for Disease Control and Prevention (CDC). Instruments used here included Applied Biosystems API 4000 (Applied Bio-systems, Foster City, CA), Agilent MSD (Agilent Technologies, Santa Clara, CA), Thermo Electron Xcalibur—LTQ Quantum (Thermo Fisher Scientific Inc., Waltham, MA) and ELAN (PerkinElmer, Waltham, MA). This instrument laboratory specializes in rapidly quantifying human exposures to chemical warfare agents by analyzing clinical samples for the agents themselves, their metabolites, or protein adducts. The data from the laboratory is used to identify the chemical agent of interest and report these data effectively to public health responders and decision makers. In turn, the public health system uses these results to facilitate the treatment of patients who were exposed and to protect others who might be exposed. Due to the critical nature of the laboratory, it must be able to respond quickly with continuous operations until the event has concluded. Discussions of some specific laboratory components and processes are presented here. To capture and organize large amounts of analytical data, a customized LIMS, called the
The variety of vendor-based operating systems found in each analytical instrument laboratory presents a significant challenge when designing and implementing a LIMS. 2 To address this challenge, a LIMS process design must consider whether to accept finalized data or receive only unprocessed instrument data for additional processing. Advantages to receiving only finalized data include the ability to use the most current vendor-based software, with associated manipulation tools, for data processing. This approach leads to three primary implementation barriers which include the following: (1) learning multiple vendor-specific applications and operating platforms, (2) finding a LIMS-compatible data import/export format, and (3) developing code-driven classes to parse noncompatible formats into the LIMS. In contrast, a disadvantage of receiving only raw data into a LIMS system is that a working agreement must be established with the instrument vendors. This working agreement can be addressed in the LIMS; however, the agreement must be closely maintained and managed to prevent potential incompatibility issues.
A LIMS can address laboratory capacity issues through scalability, which provides the flexibility to rapidly add new instruments which use established software for validated clinical assays. Consistent naming of reference, quality control and blind samples facilitate scalability. Scalability is especially critical when new instruments are validated in a laboratory but are not consistent with an original vendor design. This may occur because existing instrument designs have become obsolete or a competitor's instrument has been introduced to the laboratory.
Experimental
Database and Application Design
A two-tier design was used for the ERMS. The first tier consists of a user interface and business tier exclusive to the local client workstation. The second tier for data was developed using SQL Server 2000 (Microsoft Corporation, Seattle, WA). The user interface/business tier was developed in Microsoft Access 2003. Platforms used to develop the ERMS were Microsoft Windows 2000 and Microsoft Windows XP. The use of jump drives (e.g., EDGE Tech Corp, Ada, OK) or CD-R (e.g., Verbatim Americas, LLC., Charlotte, NC) were used to transport files between the instrument controllers that were not networked. Batch files are defined as a combination of analytical runs normally carried out on the same day and referenced to the same set of analytical standards for quantification and quality assessment. Analytical batch files, along with sequence files were generated as a tab-delimited, commadelimited, text, or comma-separated value file format. Quantitated files from the instrument were uploaded via standard Windows automated programming interface (Windows API). Quality control charts were generated in a Portable Document Format (Adobe Systems Incorporated, San Jose, CA) by the Centers for Disease Control and Prevention Division of Laboratory Sciences Quality Control (DLS-QC) statistical program, which was written using SAS (SAS Institute Inc., Cary, NC). References were applied to Microsoft Outlook 11.0 library to provide interoperability 3 with Microsoft Outlook and enhanced automation for faster decision making and reporting of the data. Integration of the DLS-QC program provided integrated review of quality control charts and approval from remote statisticians and supervisors. A setup and deployment package was developed for the LIMS using Visual Studio 2003 (Microsoft Corporation, Seattle, WA). The deployment package enabled ease of distribution among several users and provided additional system settings and registry requirements.
Specialized Functions for Clinical Assays
Specialized functions were provided to assist in the development and validation of clinical assays. Establishing clinical assay profile settings facilitated comparing data between different instrument platforms. Clinical assay profile field types included an instrument type, instrument identifier, assay/method identifier, metric, matrix, blanks, quality controls, calibrators, sample types, sample type identifier and an appropriate selection of compounds for the specified clinical assay. Additional field types were established, such as analyte concentrations, limit of detection (LOD), sample location (plate/rack), instrument sequence number, lot number, internal standard lot number, percentage range for calculating confirmation ratios, and data point exclusion capabilities. Standardized reporting provided integrity, and accuracy of the validated data. The assay profile provided precision, accuracy, and relative standard deviation (RSD) for all components of the clinical assay. Data point exclusion per validation and characterization on large amounts of data provided standardized real-time calculations, as well as, limit of detection calculations.
Temporary tables were created in the ERMS local client to allow mapping of attributes to all related header information needed for data transfer. File formats were provided in Microsoft Excel (i.e., .xls, .csv extensions), Unicode and ASCII text formats. Classes, modules, methods, properties and events were created with Visual Basic for applications to parse, map, create, read, update, and delete data from specific instrument vendor formats.
Development, Testing, and Production
In addition to the routine analysis of samples submitted for evaluation, the ERMS was tested during regularly scheduled laboratory exercises. A typical exercise would initiate when a deployment team would travel to a simulated event. The deployment team would pick up the patient specimens for analysis and return to the CDC. A minimum of 40 specimens were retrieved for analysis using the Rapid Toxic Screen (RTS). The RTS is a set of quantitative analytical methods used in response to an unknown chemical exposure event. The RTS includes methods for analyzing chemical warfare agents, toxins, incapacitating agents, toxic industrial chemicals, or their metabolites in clinical specimens. Using the RTS, up to 150 compounds can be tested within 36 h of sample receipt.
To test and report clinical specimens, a distinct study identifier was created in the ERMS. This created a tracking code (identifier) for each event, which provided a relationship to patient aliquots. Tracking identifiers were used to track patient specimens for reporting purposes only. Chain-of-custody reports were created and electronically signed by analysts as specimens were dispersed throughout the laboratory. Depending on the exercise scenario, new instruments may have been rapidly added to meet capacity requirements.
Results
The LIMS was developed around the main steps of incorporating each method before production use, which included the initial setup of each assay's profile and populating that profile with validation data. Actual production application of each method used the validation settings as a reference point for all further generated data. 4 The assay profile settings, as seen in Figure 1, were entered and updated by the user. Typical components of an assay profile included an instrument type, instrument identifier, assay name, names of all analytes, and standardized names of calibrators, quality control materials, and bench quality control materials.

Assay parameter(S). Settings for GBA (isopropyl methylphosphonic acid). The temporary view is defined by the instrument type, instrument name, assay name, analyte, and profile number. A standardized naming convention was used for all blanks, standard solutions and quality control materials.
After the profile was created, the developer met with the analysts, gathered any additional method requirements, and then created classes or macros to parse field types mapped to temporary tables on the client. This created a flat file (i.e., records/fields specified in a single line, delimited by a comma or tab), and provided a foundation to temporarily review data before final transfer into the database. This was particularly useful for ensuring that laboratorians were using standardized naming conventions on a daily basis.
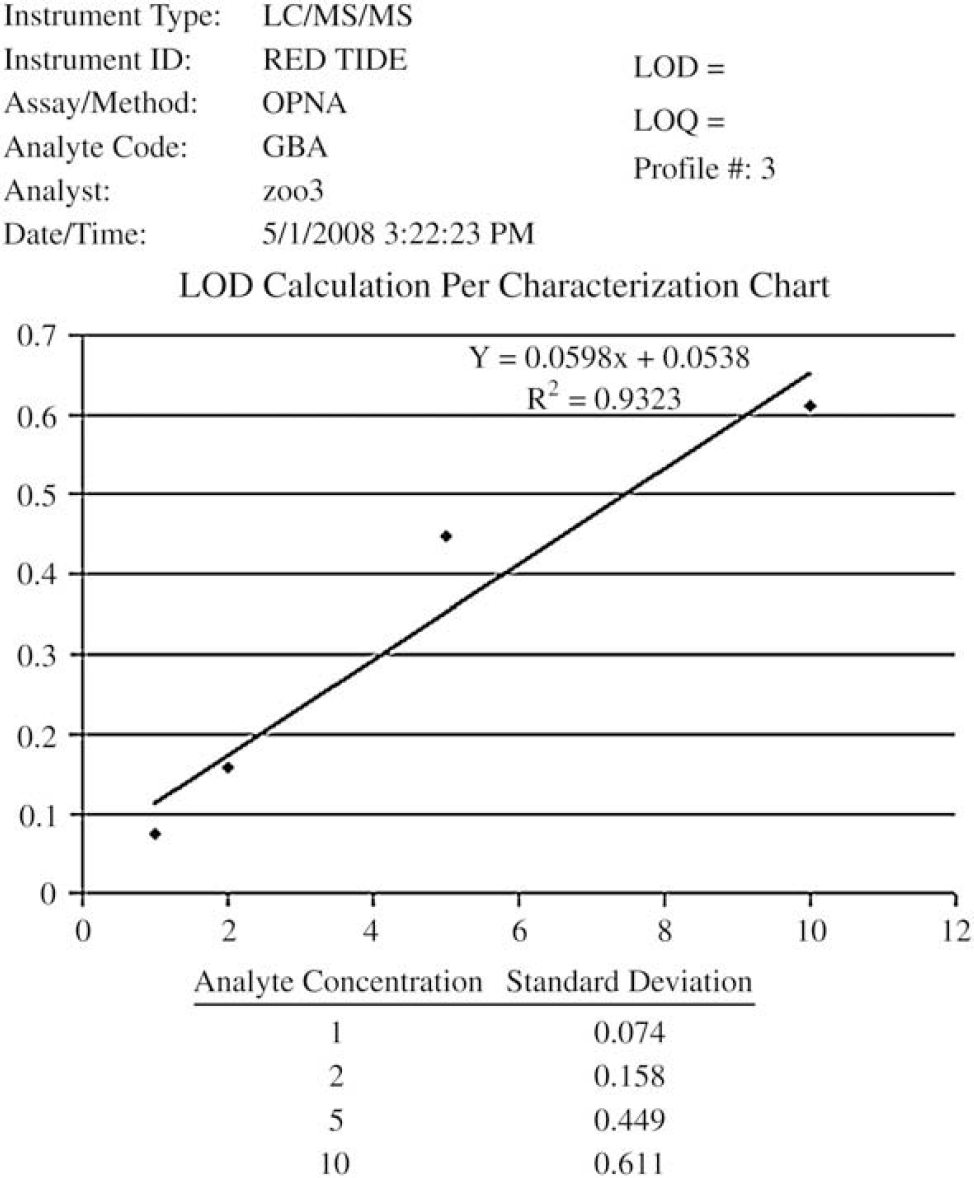
The method characteristics were measured from 20 analytical runs analyzed over at least three weeks. The LIMS system calculated the method limit of detection (Fig. 2) for each separate analyte based on the Taylor's approach 5 by performing a linear least-squares regression analysis of the absolute standard deviation of the lowest four calibrators versus concentration. The
The mean, standard deviation, and accuracy (Fig. 3) were also required for characterizing each lot of calibrators and QC materials within an assay. These parameters were key for measuring the quality of each lot of material, as well as the performance of the method. Figure 4 shows a graphical representation of a quality control chart that was stored within the LIMS system as part of each analytical run. These analytical runs could be blanks, quality controls, calibrators, and/or unknown specimens. Run identifiers are noted on the
Correlation coefficient chart for GBA (isopropyl methylphosphonic acid, CAS 1832–54–8). This chart provides an intercept, slope and

Quality control and standard mean, standard deviation, precision (relative standard deviation), and accuracy for three OPNA compounds. GBA (isopropyl methylphosphonic acid, CAS 1832–54–8); GDA (pinacolyl methylphosphonic acid, CAS 616–52–4); GFA (cyclohexyl methylphosphonic acid, CAS 1932–60–1).
Reviewing and reporting unknowns required the initial setup of a study identifier. The study identifier was used to reference and track the unknown specimens logged into the ERMS. After the code was created, unknown specimens were logged and the system was used for chain-of-custody and reporting purposes. Independent views of information about and the results of analysis of unknowns provided the ability to focus on specific data points generated by the analytical batch (mixtures of analytes, results outside of the reportable range of the method, ratios of specific data, and so forth). Visual displays were designed to allow the analyst and supervisor to review the results from analysis of blanks, quality control samples, calibrators, and unknown samples. For example, the blank review provided the ability to check cross contamination for each analyte, if needed, during data processing. Quality control charts were generated by the SAS statistical application to monitor trends in controls (Fig. 4). Additionally, diagnostic ion confirmation ratio checks 7 were applied to verify if a peak had been integrated appropriately, or if there were possible interferences in a result.

Quality control evaluation chart produced by division statistical application (SAS) displaying QC high and QC low standard deviation of GBA. GBA (isopropyl methylphosphonic acid, CAS 1832–54–8).
The ease of LIMS use when analyzing test samples was facilitated by using instrument sequence queues which were generated by the analyst. These queues eliminated manual transposing of specimen identifiers and provided a vendor-specific file format to be uploaded directly into each instrument. The use of standardized specimen identifiers across platforms eased tracking of results and provided specimen profile recognition between different lots of reference materials.
Large amounts of data were effectively reviewed through the use of filters in MS Access. Filters were used to assist in excluding (i.e., flagging) data points from a calculation (e.g., QC limits, mean, LOD), but did not permanently delete them from the database. Excluding data points simplified maintaining and monitoring redundant calculations, while providing real-time changes. To ensure calculations were properly filtered and excluded, activity codes were added to the analytical batch to properly document the basis for excluding data.
Discussion
Understanding and defining the process of how the emergency response laboratory specimens are received, analyzed, and reported were critical when developing the ERMS. These operations in the analytical process included standard laboratory procedures, the development of new clinical assays, optimization of assays currently in production, and processing emergency response specimens as needed. To successfully define these processes, the goal was to not force the analysts to conform to an information technology (IT) solution, but to build an IT solution that mimicked the analysts as they performed their day-to-day operations. Mimicking the analyst's day-to-day operations further defined these processes and provided a compartmentalized workflow in the lifecycle of receiving, analyzing, and reporting the results from analysis of an unknown specimen. In doing this, the ERMS provided calculations and functions to assist the analyst's daily operations.
Method profiles provided settings, parameters, and reporting capabilities to ease data management. The need to rapidly manage data from newly added instrumentation during an emergency response provided a challenge to design flexible, scalable software. The success of this design allowed the acquisition of multiple types of instrumentation in a minimal time-frame. This enabled QC officers and supervisors to manage the quality of the data effectively and efficiently by providing appropriate data in an understandable form with minimal extraneous requirements.
Standardized data formats were used to create multiple types of sequence and analytical run files when generating vendor-specific software formats throughout the laboratory. Sequence files were generated via a custom-developed form which offered analysts an interactive display to adjust the sequence as needed and specify the instrument platform. Settings and parameters within each instrument method profile assisted in providing templates, along with standardized naming conventions, when creating the sequence files. The sequence generation module provided a file-specific format to be uploaded into the instrument vendor software. Files which contained final quantified results from the instrument were uploaded via a standard Windows automated programming interface (Windows API). The automated instrument sequence file saved valuable analyst time and reduced operator errors. Because some analytical runs may include up to 96 blanks, standards, quality control materials, and unknowns, each with multiple tracking identifiers, this time saving is significant.
Specialized functions of the ERMS included method profile initiation, study initiation, standardized data file formats between multiple platforms, automated archival of e-mail approvals for documentation purposes, confirmation ratio assessment on a per analytical run/per analyte basis, method development tools for validation, data point exclusion for validation and characterization data, and automated functions for calculating precision, accuracy, and relative standard deviation for all components of a method profile.
Rapid and clear communication throughout the laboratory is critical to reporting delays and confusion when responding to an emergency event. Generated e-mail notifications from the ERMS allowed remote notifications to multiple parties involved in the approval process. The ability to e-mail quality control charts generated from the DLS QC program, along with the original data set used to generate the charts, provided quick turnaround to reviewing the quality control data and reporting of the unknowns. On completion of an event, the option to archive e-mails related to the event provided additional auditing of the approval process. To communicate this approval process effectively, interoperability between applications provided enhanced automation for faster decision making and reporting of the data. Referencing the Microsoft Office Outlook 11.0 library was one of many approaches used for effective communication. This library enabled the methods and properties needed to provide automatically generated e-mails, which allowed quick turnaround on reporting data. The automated system provided effective communication between supervisors and quality control officers while providing the appropriate documentation needed during an emergency. Quality control charts were generated by SAS statistical software developed within the Division of Laboratory Sciences (DLS), which was integrated with the ERMS. The DLS-QC SAS application provided divisional guidelines and generated a Portable Document Format (PDF) file. This PDF is stored and related back to the original data set, as well as, the automated e-mail generated by the quality control officer. Additionally, analysts have the ability to review analytical runs and generate the related PDF for future reference. Integrated review of quality control charts and approval from remote statisticians and supervisors enhanced the ability to respond and provide fast reliable results during an emergency.
Exercises provided a simulated event to help test and understand the process and roles of an emergency response situation. This simulation included a deployment team which provided the initial pickup of the specimens involved. Once the team returned to the laboratory, an initial RTS of 40 specimens was analyzed. Analysis of the initial 40 specimens provided identification of the agent involved. Once the agent was identified, the overall goal was to convert all available instrumentation to the specified methodology and process the remaining specimens. Due to the design and scalability of the LIMS, the ability to rapidly add new instrumentation was simplified.
The ability to scale up an application during an emergency response is critical for handling large amounts of data dispersed throughout several laboratories. Not only does scalability achieve quality in the reporting of data, this enables primary instrument responders the ability to easily create standardized file specifications when uploading sequence files, additionally producing standardized identifiers when reporting from multiple platforms across laboratories.
Conclusions
The ERMS was developed to provide ease of data management for all users in the CDC emergency response laboratory. In designing the LIMS, mapping out the entities and attributes of the laboratory created a common model that provided flexibility, accountability, and scalability to processing laboratory data. During the development phase, established protocols for reporting final quantitated data across various clinical assays and instrument types within the laboratory were developed. These protocols provided standardized data structures which made the mapping of field types minimal during data acquisition between the ERMS and various instrument vendor software platforms.
Overall development efforts proceeded for six months. The short timeframe provided a basic design of laboratory operations to build on. Due to the flexibility in design, requested functions and calculations were added on with minimal development efforts. A sole developer handled the requirements gathering, development and deployment of the LIMS. An array of scientists (2–15 analysts) provided user functionality and assay information for development and testing.
Due to time and IT budget constraints, the decision to develop a customized LIMS was simplified. Access to an embedded programmer provided software development support to the laboratory. Due to close physical proximity, regular communication, the programmer's experience, and willingness to design a system which mimicked the laboratory process, the ERMS has proved to be an effective and efficient system for handling laboratory data. The time which was invested in the laboratory; defining, gathering requirements, and implementing a solution made the final product a powerful tool for the laboratory.
Acknowledgments
The authors thank Benjamin Blount, John Morrow, Sam Caudill, and the Analytical Response Laboratory for technical assistance and proofreading assistance.