
Abstract
The study of protein adsorption on the membrane surface is of great importance to cheese-making processors that use polymeric membrane-based processes to recover whey protein from the process waste streams. Quartz crystal microbalance with dissipation (QCM-D) is a lab-scale, fast analytical technique that can precisely monitor and quantify the amount of proteins adsorbed onto the polymer surface in real time. The ability of the software that accompanies the instrument to predict the minute amount of the mass of the protein on the surface and the structural properties of the adsorbed protein requires a suitable viscoelastic model to convert the data of frequency and dissipation shift responses generated from the QCM-D apparatus into the mass and viscoelastic properties of the proteins adsorbed on the surface at given times. In this study, data recorded by a QCM-D apparatus were fitted into the Kevin—Voigt model, to quantify the whey protein adsorption on the polyethersulfone membrane surface.
Introduction
Ultrafiltration of whey proteins is a commercially adopted process in the dairy industry for by-product utilization in cheese-making operations. Membranes used in the process have tendency of developing membrane fouling, a result of protein attachments to the membrane surface and subsequent reduction in membrane permeation flux; the fouled membrane has to be frequently cleaned with chemicals/enzymes to dislodge the adsorbed proteins resulting in downtime, deterioration of the membrane, and expenses related to cleaning agents and labors. 1 Because dairy proteins have a heterogeneous surface and amphiphilic (both hydrophilic and hydrophobic) properties, they can interact easily with a hydrophobic polymeric surface by different types of interactions such as electrostatic interactions, van der Waals forces, hydrophobic interaction, hydrogen bond, and so on. The fouling by the protein adsorption on polymeric membranes is caused mainly by the strong interactions such as hydrophobic interaction and electrostatic attraction between protein and the polymeric membrane surface. 2,3
Understanding of protein adsorption over time on a membrane surface is the first step to understand how fouling occurs on the membrane surface—this will shed light on not only protein attachment to and aggregation among proteins on the surface, but also the viscoelasticity of the adsorbed proteins on the surface, which affects the permeation rate and the effectiveness of fouling reduction methods such as increasing cross-flow rate on the membrane surface and backwashing of the fouled membrane. The insight of real-time membrane fouling by dairy proteins will also provide critical information on future designs of membrane materials and systems. Among various techniques of protein adsorption study, quartz crystal microbalance with dissipation (QCM-D) has emerged as one of the most convenient and highly sensitive instruments that can measure structural properties of adsorbed protein layers on the membrane and detect the mass of proteins adsorbed as small as 5 ng/cm2, depending on the model of the instrument and data collection time, in real time according to a major QCM manufacturer, Q-Sense (Goteborg, Sweden).
The QCM-D technique stipulates that when the quartz crystal is immersed in gas or aqueous solution, it is excited to oscillate at a fundamental resonant frequency (5 MHz). When the substrate is adsorbed on the crystal surface, the resonant frequency decreases with the increase in the amount of mass adsorbed on the crystal. If the adsorbed mass is evenly distributed, sufficiently rigid to have no energy dissipation, thin to have negligible internal friction, and small compared to the mass of the crystal, the frequency shift (Δf) is proportional to the adsorbed mass per unit surface (Δm) under Sauerbrey model:

where C is the mass sensitivity constant (= 17.7 ng/cm2 Hz at f = 5 MHz) and n is the overtone number (in the present case n = 3, 5, and 7). It is also possible to obtain the estimation of the thickness of h of the adsorbed layer of proteins:

where ρeff is effective density of adsorbed protein layer. However, if the adsorbed layer does not follow the oscillation rigidly, the energy dissipation in the oscillation will be changed. Because most protein layers adsorbed at the interface are hydrated and highly viscoelastic, they are not completely rigid and can cause the energy dissipation significantly. In such case, the Sauerbrey equation is probably invalid. In order to attain more accurate mass change and structural properties of the adsorbed protein layer, energy dissipation should be considered. Dissipation is described as the energy loss of an oscillatory system during one period of oscillation. Dissipation factor can be defined as follows:

where E dissipated is the dissipated energy and E stored is the energy stored in the oscillating system. D is the sum of all energy dissipated in the oscillatory system. Spencer and Smith 4 (1966) found that the amplitude of a quartz crystal decays as an exponential sinusoidal when the driving power to a piezoelectric crystal oscillator is switched off. The relationship between amplitude and decay time is described by the general form as follows:

where A is the amplitude, t is the time, τ is the decay time, f is the resonant frequency, and φ is the phase angle. The QCM-D system can determine the decay time (τ) and the resonance frequency (f) of the exponentially damped sinusoidal voltage signal over the crystal caused by switching of the voltage applied to the piezoelectric oscillator. The dissipation factor, D, is inversely proportional to the decay time, τ, as follows:

where f is the resonant frequency and τ is the decay time. By recording the amplitude during the decay and numerically fitting the data to eq 5, both the resonance frequency and the dissipation factor of the crystal can be realized simultaneously.
A QCM-D apparatus can thus measure the Δf and dissipation shift (ΔD) simultaneously at three different overtones (n = third [15 MHz]; n = fifth [25 MHz]; and n = seventh [35 MHz]). These multiple Δf and ΔD data obtained at several overtones are used to calculate the viscoelastic properties of the adsorbed protein layer based on a viscoelastic model. The most common viscoelastic model system used for estimating structural properties of adsorbed soft film (such as adsorbed dairy proteins) in QCM-D measurements is the Kevin—Voigt model that can be described as:

where G* is complex shear modulus, G' is the storage modulus, and G” is the loss modulus. The software supplied from Q-Sense, Q-Tool (Goteborg, Sweden) interprets the Δf and ΔD data from the measurements, based on the Kevin—Voigt model, to estimate viscoelastic properties of the adsorbed protein layer on the membrane as shown in Figure 1 assuming thinly coated polymer with crystal forms a rigid body and the adsorbed layer covers the entire active area; it is homogenous and with uniform thickness.
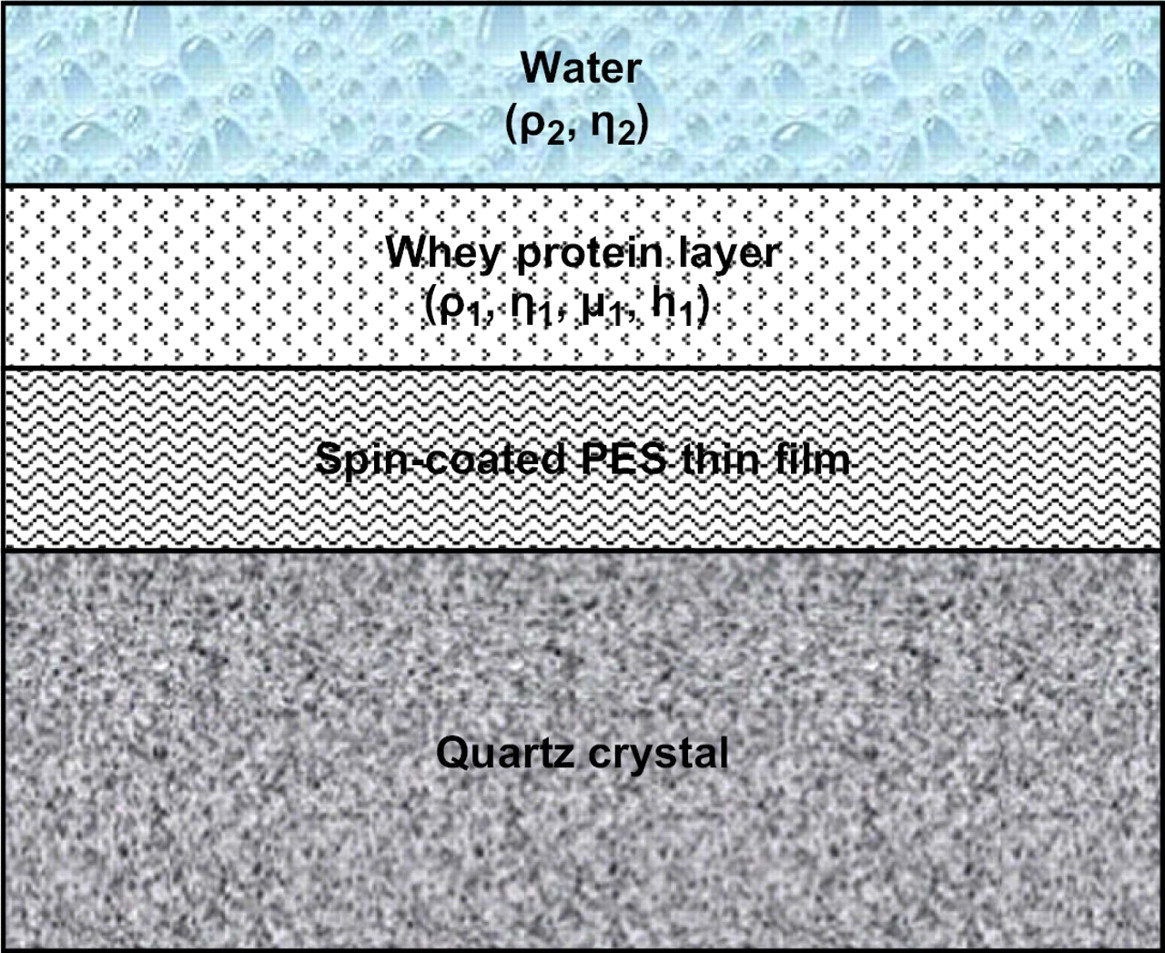
A schematic diagram of the Kevin—Voigt viscoelastic model related to the protein—polymer adsorption on a quartz crystal surface.
The viscoelastic properties such as density, viscosity, elasticity, and thickness of the adsorbed protein layer can be correlated to the Δf and dissipation factor from the QCM-D responses, based on the Kevin—Voigt model. 5 According to the research of Voinova et al., 5 the relationship between QCM-D response and viscoelastic properties of the adsorbed soft film layer was explained with the equations as follows:
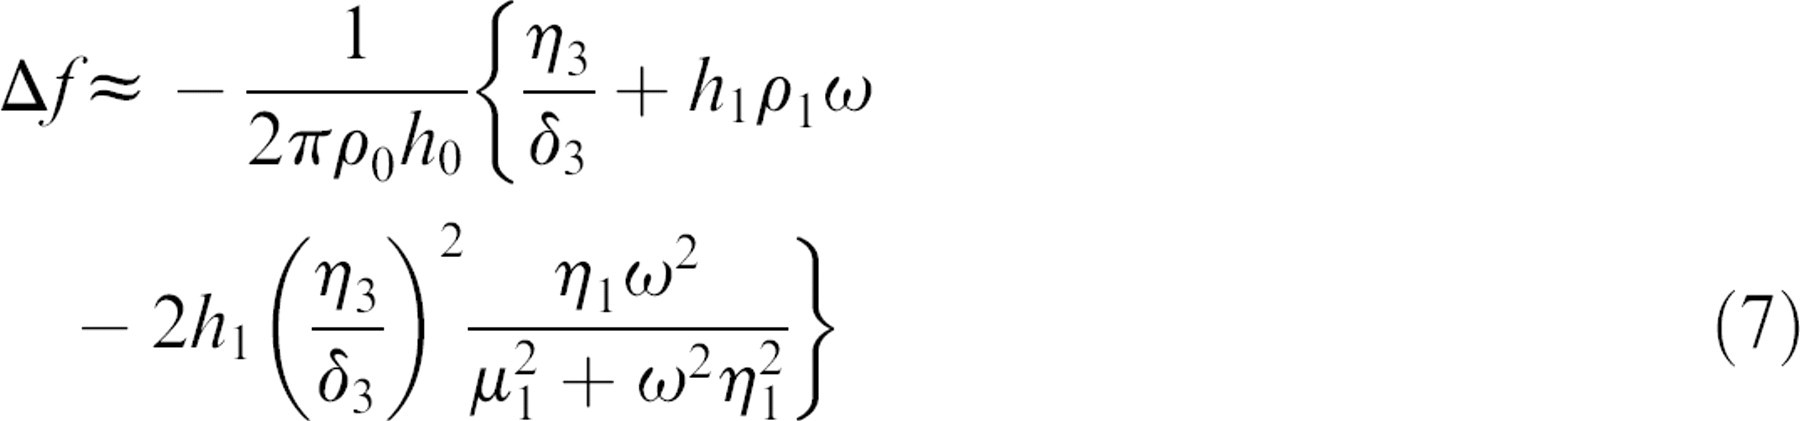
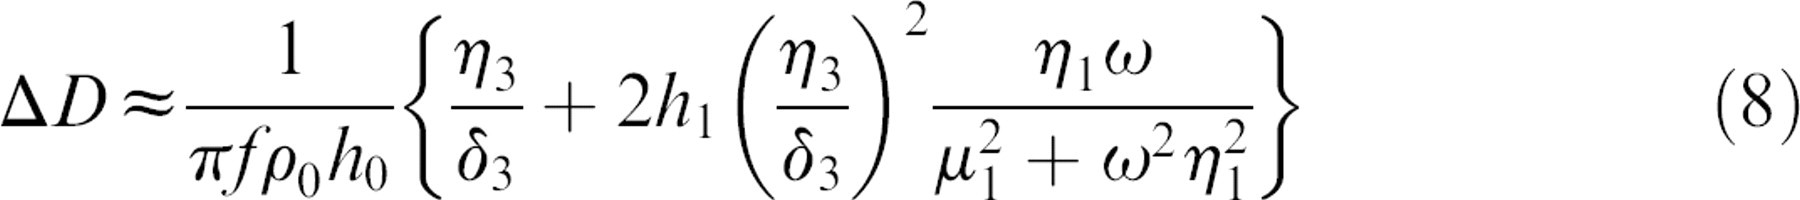
where ρ0 and h 0 are the density and thickness of the crystal. δ 3 is the viscosity of the bulk liquid and δ3 is the viscous penetration depth of the shear wave in the bulk liquid and ρ3 is the density of liquid. ω is the angular frequency of the oscillation. In this model, the adsorbed protein layer is represented by four parameters: density (ρ1), viscosity (η1), shear elasticity (μ 1), and thickness (δ 1). Among them, the thickness of the protein layer was obtained by dividing the total mass by the density, which was assumed to be 1200 kg/m3 for the protein layer with trapped water and the fluid viscosity of 0.001 kg/m3 and fluid density of 1000 kg/m3. 6 It is also assumed that the polymer-coated quartz crystal of the QCM-D apparatus was purely elastic, and the surrounding solution was purely viscous and Newtonian.
For this study, the QCM-D was used in dairy protein adsorption onto the polyethersulfone (PES) polymeric membrane surface, and the results were interpreted with the Kevin—Voigt viscoelastic model to obtain the thickness, the viscosity, and elasticity of the adsorbed protein layer. The mass per unit area of the adsorbed protein on the membrane surface is calculated based on eq 2 and the number density was computed by dividing the mass per unit area of the adsorbed protein by the molecular weight of β-lactoglobulin (a major component of whey proteins), that is, 18,300 7 and multiplying by Avogadro's number.
Materials and Methods
Materials
PES polymer was kindly provided by Solvay Advanced Polymers, L.L.C. under the trade name of RADEL H-2000P NT (Alpharetta, GA). Flat sheet PES membrane was purchased from Sterlitech (Kent, WA). Molecular weight cut-off (MWCO) of flat sheet PES membrane is 20,000. Bovine milk β-lactoglobulin, which is a mixture of A and B variants crystallized and lyophilized three times (Lot No. 033K7003), phosphate-buffered saline (PBS), and N, N-dimethylformamide (DMF) were purchased from Sigma-Aldrich (St. Louis, MO). Deionized water was obtained from a Millipore Milli-Q filtration system (Millipore Corporation, MA, USA) with a resistivity of 18.2 Mω cm.
Surface Preparations and Characterizations
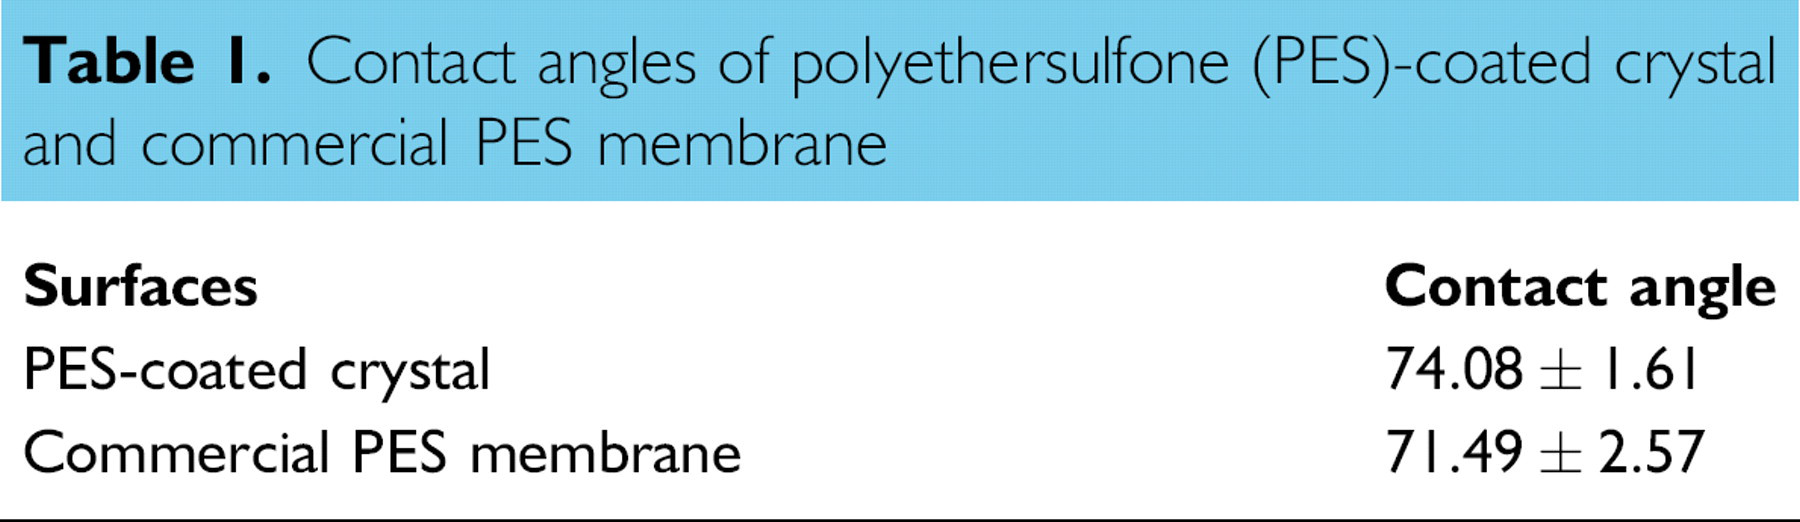
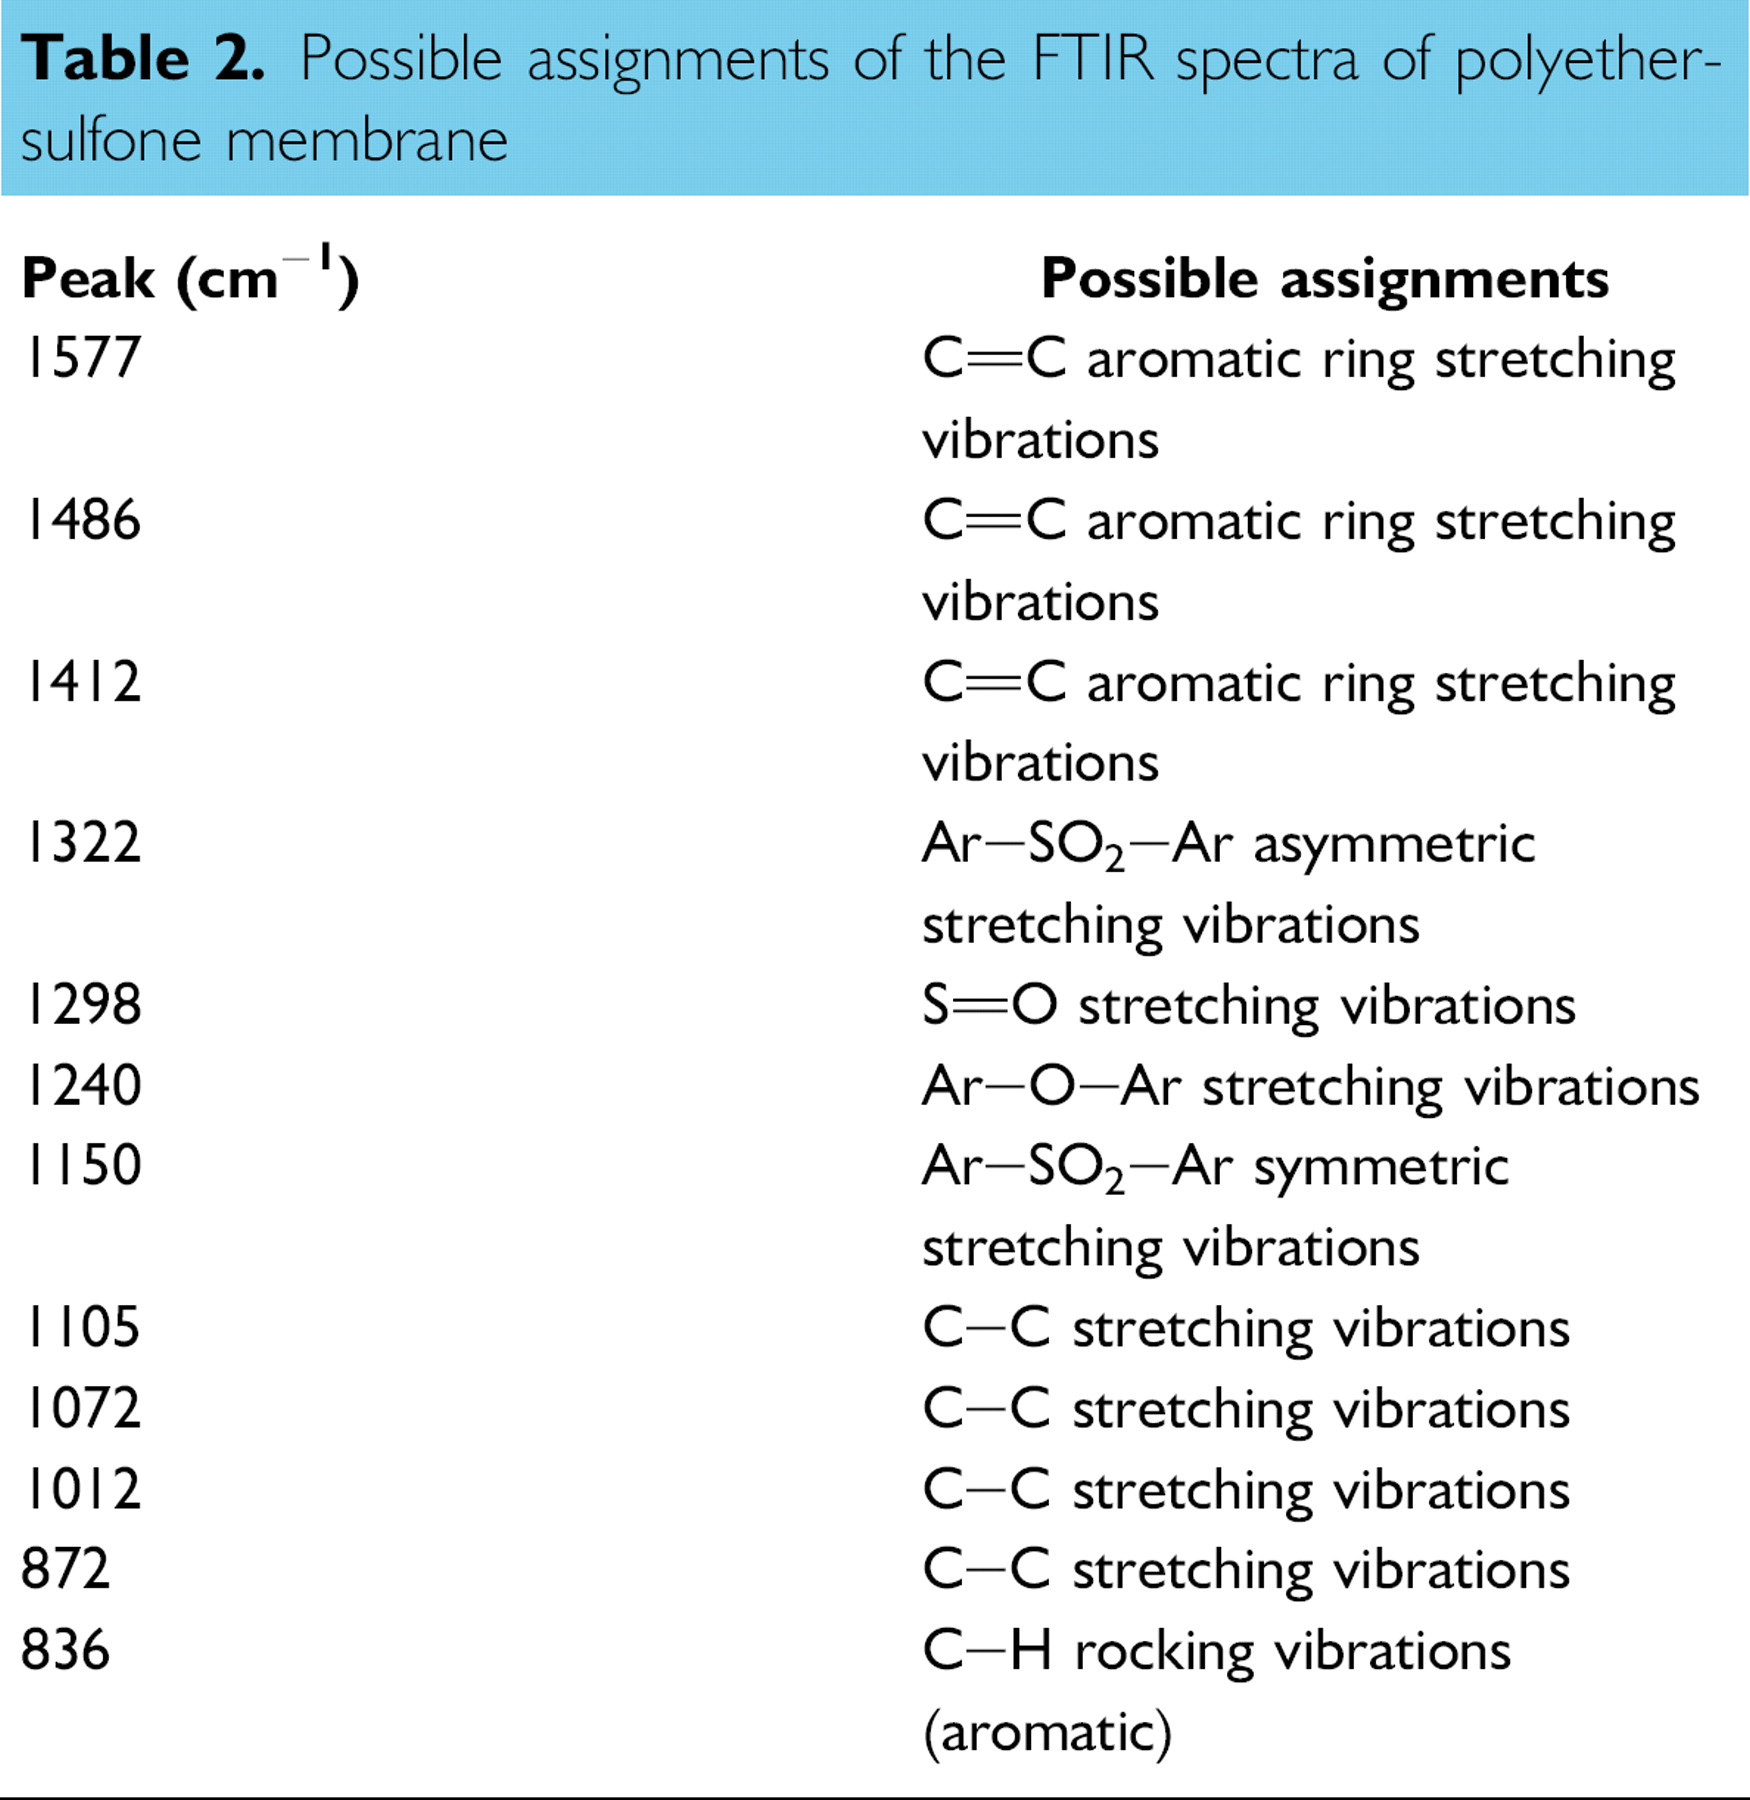
To study the dynamic adsorption of proteins onto the PES surface using QCM-D apparatus, a comparable PES surface should be created on top of the quartz crystal surface. Quartz crystals were spin coated with 1% (w/v) PES solution in DMF and evaporated at the room temperature. All quartz crystal substrates for PES coating are new commercially purchased quartz crystal disks from Q-Sense (Goteborg, Sweden). After crystals were spin coated, surface properties were characterized to make sure the surface properties of the PES coated on the crystal surface match the characteristics of the commercial PES surface in terms of surface properties. Contact angle and fourier transform infrared spectroscopy (FTIR) spectra were measured for the 1% PES solution coated quartz crystal surface and compared with those of the commercial PES membrane. In Table 1, the contact angle of 1% PES-modified crystal surface (74.08 ± 1.61) is similar to that of the commercial PES membrane (71.49 ± 2.57). FTIR spectra show the exactly same pattern in both PES-modified surface and commercial PES membrane (Fig. 2). Aromatic bands of PES are present at 1578 and 1486 cm−1. The peaks at 1322 and 1298 cm−1 represent the sulfone groups (S=O) of PES membrane. The possible assignments of spectra of Figure 2 are summarized in Table 2.
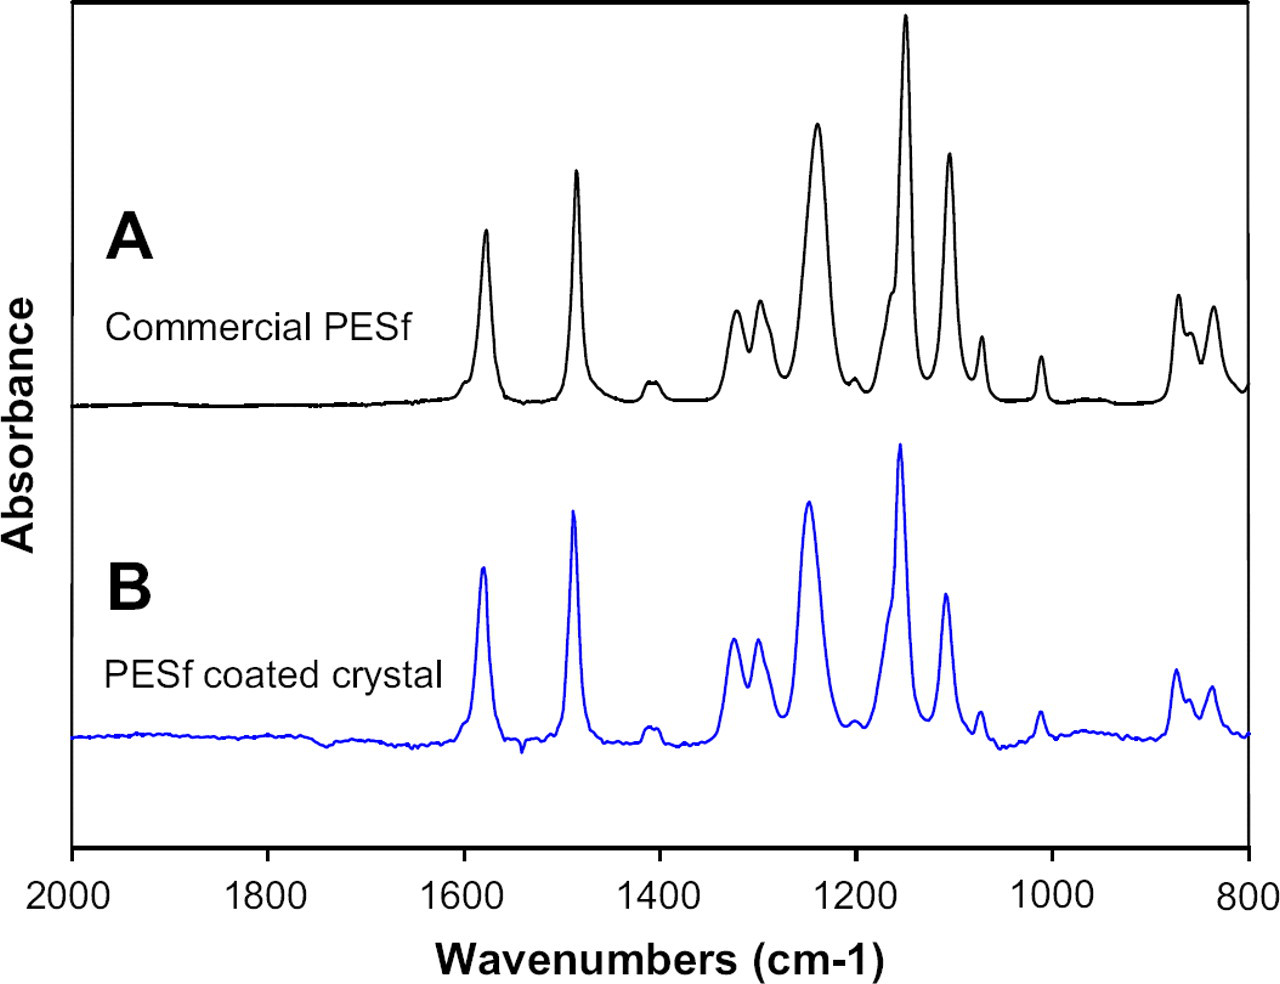
Attenuated total reflection fourier transform infrared spectroscopy (ATR-FTIR) spectra of (A) the commercial polyether-sulfone (PES) membrane and (B) the PES-coated quartz crystal.
Contact angles of polyethersulfone (PES)-coated crystal and commercial PES membrane
Possible assignments of the FTIR spectra of polyether-sulfone membrane
Tapping-mode atomic force microscope was also used to determine the spinning rate for spin-coating PES onto the quartz crystal surface using a spinning coating machine. Figure 3 shows the surface topography of 1% PES-coated quartz crystal. The rpm of spin coater was changed from 2000 to 4000 after we discovered that the lower rpm of spinning for coating PES onto the quartz crystal surface within a given time did not generate enough centrifugal force to flatten the PES layer to our expectation. As an illustration of the results of different spinning, we found that the root mean square roughness (Rq) of PES-coated crystal surface decreased with increasing rpm of spin coater, from 12.176 to 3.850 nm for a scan area of 10 × 10 μm2, whereas the Rq of commercial PES membrane was 2.067 nm. The shading intensity shows the vertical profile of the membrane surface with the light regions being the highest points and the dark regions being depressions. As shown in Figure 3, the surface of PES-coated crystal was rough and heterogeneous when the rpm of spin coater was 2000. On the other hand, the roughness of PES-coated surface at 4000 rpm was close to that (2.067 nm) of the commercial PES membrane.
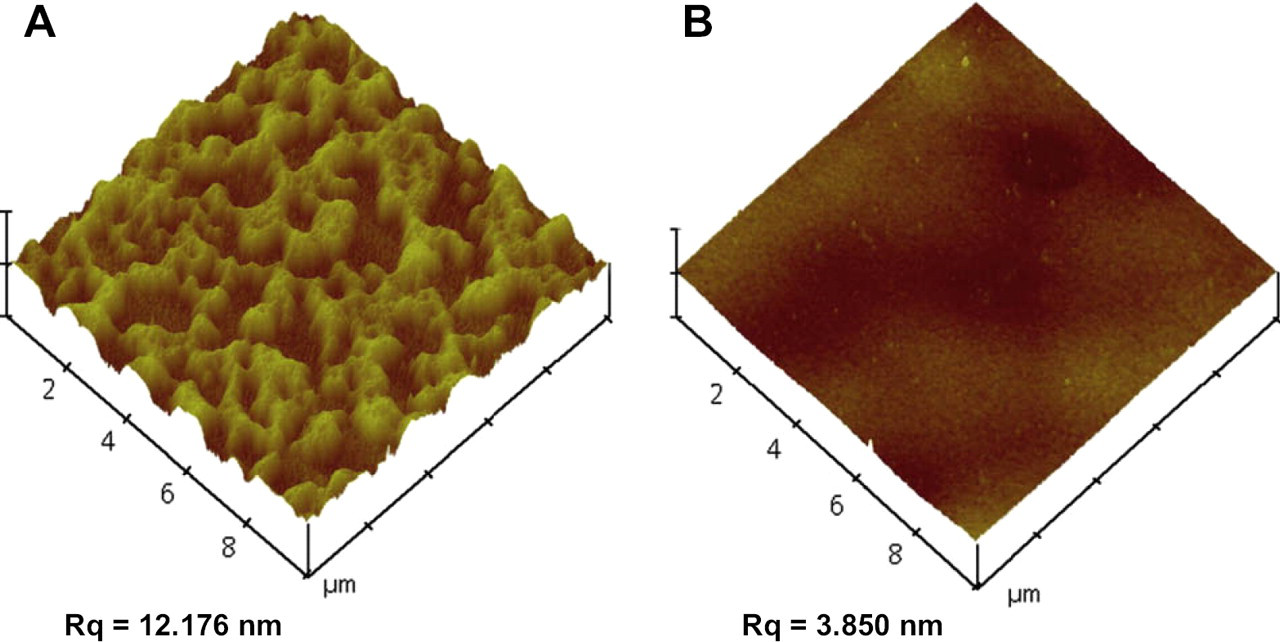
Atomic force microscope images of 1% polyethersulfone-coated crystal surface using spin coater (A) at 2000 rpm and (B) at 4000 rpm.
Real-time protein adsorption experiments were carried out with QCM-D technique. One percentage (w/v) solution of PES was prepared by blending 1 g of PES with 99 mL of DMF. After PES was completely dissolved, the solution was filtrated with a 0.45-μm syringe filter to remove the impurities. β-Lactoglobulin solutions were prepared as stock solution of 10% (w/v) concentration, and stored in a freezer until their uses. Protein-free PBS buffer was used to obtain the baseline and in the rinsing steps to wash out the reversible proteins after the protein adsorption processes occurred.
QCM-D measurements were performed with the Q-Sense D 300 system (Q-Sense, Goeteborg, Sweden) equipped with a QAFC 302 axial flow chamber. Because this chamber has a heating/cooling system and a control valve, the experimental temperature and flow rate could be maintained constantly. Quartz crystals with a fundamental resonant frequency of 5 MHz, 0.3 mm thickness, and 14 mm diameter (QSX301; Q-Sense) were spin coated with a spin coater (Headway Research Inc., Garland, TX) using 1% (w/v) PES solutions in DMF and evaporated at the room temperature for at least 24 h. The polymer-coated crystal was inserted into the QCM-D chamber. Frequency and ΔDs versus time curves induced by the addition of β-lactoglobulin solutions were recorded. The QCM-D chamber was stabilized at temperature of 24.75 ± 0.1 °C. When frequency and ΔD were at equilibrium state, protein-free PBS buffer was injected to remove the reversible protein. Four times of rinsing step were accomplished for each experiment. All experiments were duplicated at least three times and normalized to the fundamental resonant frequency of the quartz crystal (5 MHz). Data were modeled using the Kevin—Voigt model and the software, Q-Tools accompanying the apparatus (Q-Sense, Goeteborg, Sweden) and quantitative information on the viscoelastic properties of the adsorbed protein layer were obtained. To clean the used crystals, the used crystals were immersed in the solvent for 48 h, sonicated for 5 min, rinsed with deionized water, and dried with nitrogen. The crystals dried by nitrogen were immersed in a 1:1:5 mixture of H2O2 (30%), NH3OH (25%), and deionized water at 80 °C for 15 min. After rinsing with deionized water and drying with nitrogen, the crystals were exposed to UV/Ozone for 10 min by a UVO cleaner (Jelight Company, Irvine, CA).
The effects of pH and protein concentration on the realtime adsorption were examined. The concentrations of the proteins used were 0.1% (w/v), 1.0% (w/v), and 2.05% (w/v). The values of pH were 3.0 (acidic), 5.2 (isoelectric point for β-lactoglobulin), and 7.0 (neutral).
Results and Discussions
QCM-D Adsorption Experiments
The typical adsorption process of β-lactoglobulin on the PES-modified crystal surface was monitored in real time by simultaneously measuring of Δfs and ΔDs. Figure 4A, B shows the Δf and ΔD of 1% β-lactoglobulin at pH 5.2 as a function of time, respectively. Because viscous layers like protein layers adsorbed on the interfaces exhibit different penetration depths of harmonic acoustic frequencies, Δf and ΔD induced by the adsorbed protein layer were measured simultaneously at three different overtones (n = 3, 5, and 7). These multiple frequency and dissipation data can be used to calculate the viscoelastic properties of the adsorbed protein layer. The Δf obtained at three overtones were normalized by their overtones. The arrows indicate the injection time of β-lactoglobulin solution (t 1), and several times of rinsing solutions (t 2, t 3, t 4, and t 5), respectively. The adsorption process of β-lactoglobulin on PES surface consisted of reversible and irreversible adsorption, as shown in Figure 4A. The Δf remained after rinsing steps indicates the irreversible adsorption and the Δf recovered by rinsing steps indicates the reversible adsorption. Although the reversible adsorption can cause membrane fouling, it can be removed by the high shear stress in the membrane filtration process. The irreversible adsorption, however, was caused by the strong interactions between protein and the membrane surface and between protein molecules, and it could not be removed in the rinsing steps. Therefore, the irreversible adsorption was the principal factor to cause the permanent membrane fouling. The frequency and dissipation data obtained after four times of rinsing were used to explain the permanent adsorption and the viscoelastic properties of the adsorbed protein layer. If the adsorbed protein layers were completely rigid and the energy could not be dissipated, all normalized Δf would be the same (Δf 3/3 = Δf 5/5 = Δf 7/7). In our study, all the normalized Δf n /n curves coincided when the concentration of β-lactoglobulin was below 0.1% (w/v) (data are not shown). However, when the concentration of β-lactoglobulin was higher than 1.0% (w/v), the normalized Δf n /n curve at the smaller overtone was usually larger than those at the larger overtones (Δf 3/3 > Δf 5/5 > Δf 7/7), as shown in Figure 4A. Similar observations were also reported by Zhou et al. 8 and Hook et al. 9 ΔD at smaller overtone was also larger than those at the larger overtones (ΔD 3 > ΔD 5 > ΔD 7) until it was rinsed, as shown in Figure 4B. After several times of rinsing steps, there were no significant differences in Δf and ΔD at all overtones because most viscous layers have been removed after rinsing four times.
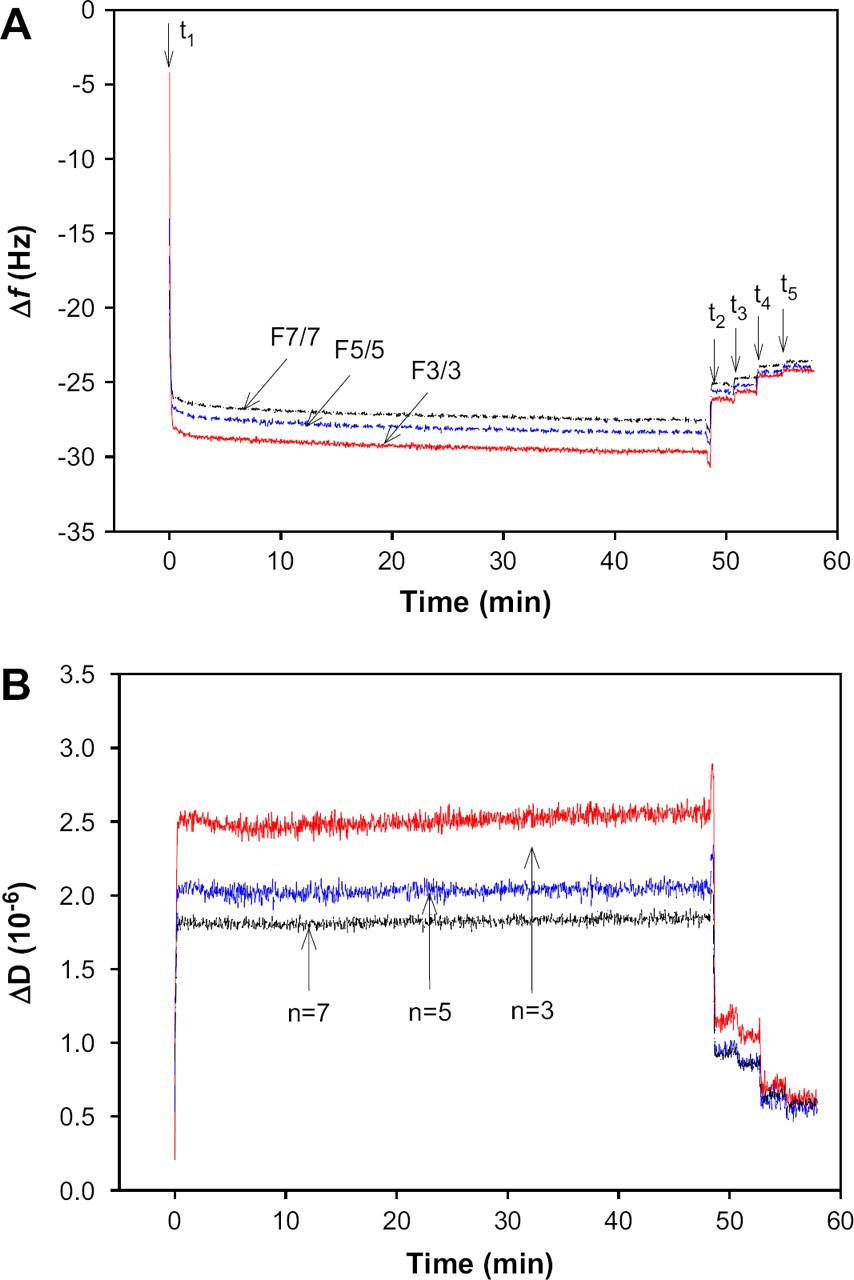
(A) Frequency shift (Δf) and (B) dissipation shift (ΔD) induced by the adsorption of 1% β-lactoglobulin at pH 5.2 on the polyethersulfone-coated surface as a function of time. Δf and ΔD are measured simultaneously at three overtones (n = 3, 5, and 7) and normalized by their overtone numbers. The arrows indicate the time for the injection of protein solution (t 1) and four times of rinsing steps (t 2, t 3, t 4 and t 5).
Effects of Concentration and pH on Protein Adsorption on PES-Coated Crystal Surface
The adsorption process of β-lactoglobulin was investigated at various concentrations (0.1%, 1.0%, and 2.0% [w/v]) and pHs (3.0, 5.2, and 7.0). The adsorption profiles of β-lactoglobulin at each concentration on 1% PES-coated gold crystal are shown in Figure 5. The magnitudes of Δf and ΔD increase with increase in protein concentration, as shown in Figure 5A, B. The adsorption processes of β-lactoglobulin on the PES surface in Figure 5 were very similar in their patterns irrespective of the protein concentration. The Δf and ΔD changed rapidly and greatly after the injection of β-lactoglobulin solution, and followed by minor changes over the adsorption time until the rinsing steps were reached. During the rinsing steps, some recoveries of Δf and ΔD were observed in 1% and 2% (w/v) protein concentrations. The Δf and ΔD at the lowest protein concentration (0.1% [w/v]), however, were rarely recovered during the rinsing steps. This result revealed that the most adsorbed layer of 0.1% (w/v) β-lactoglobulin solution was irreversible adsorption even if the amount of Δf and ΔD were small compared with those of higher concentrations. Figure 5B shows that ΔD increases with β-lactoglobulin concentration of β-lactoglobulin solution. The more proteins were adsorbed on the polymer surface, the more energy was dissipated. In addition, in 0.1% (w/v) β-lactoglobulin solution, the monolayers of protein layers might be formed on the polymer surface because the β-lactoglobulin solution concentration was too low to form multilayers. This pattern was close to the pattern described by the Sauerbrey equation because most protein adsorption was occurred by the strong interactions between the proteins and the polymer surface. The amount of proteins on the reversible protein layer depends on the protein concentration. In the case of the adsorption of 2% (w/v) β-lactoglobulin on the polymer surface, about 15% of Δf and 50% of ΔD were reversed by rinsing four times. Thus, in the case of adsorption at higher protein concentrations, β-lactoglobulin multilayers originating from self-association among β-lactoglobulin molecules may also form. Although these protein multilayers may cause significant energy dissipation, they were reversible, causing the lost of the mass of protein layers during the rinsing steps.
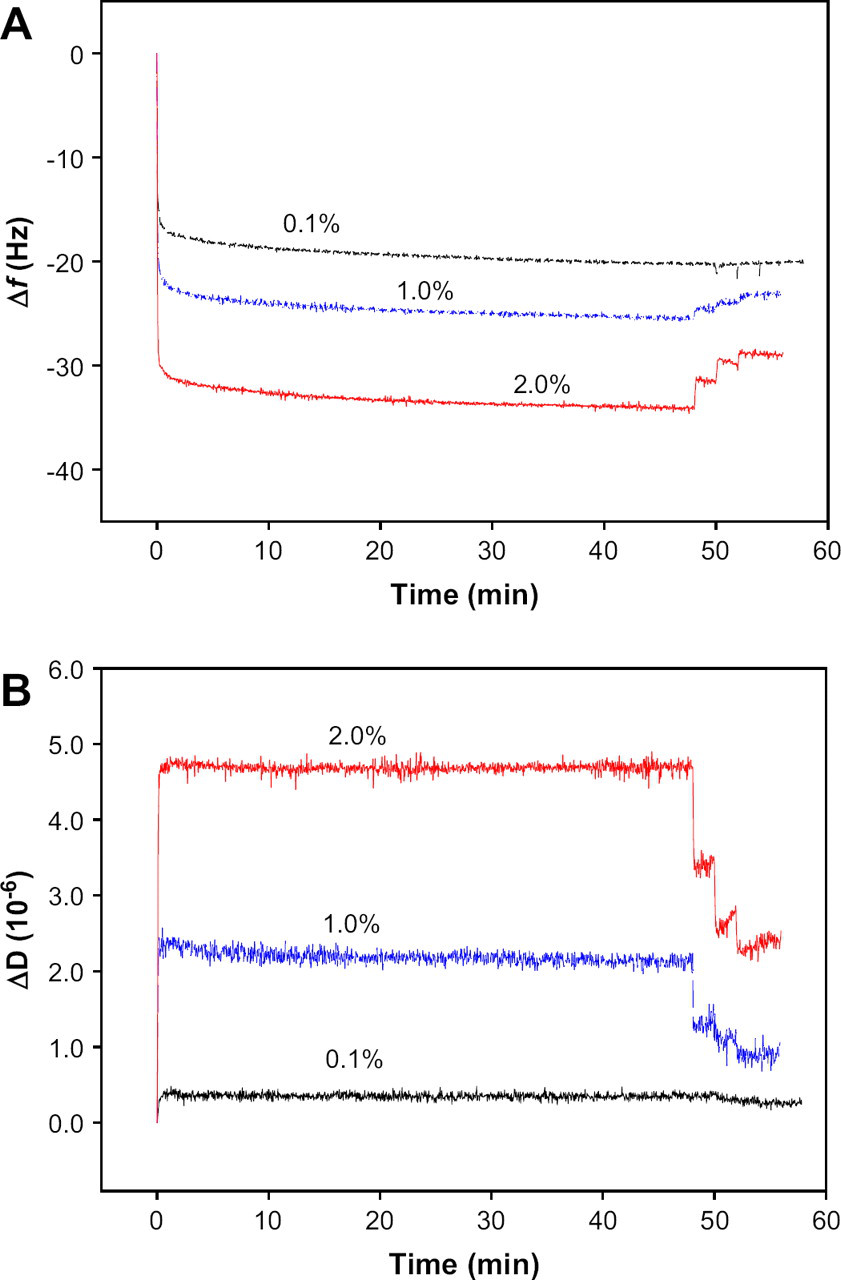
(A) Frequency shift (Δf) and (B) dissipation shift (ΔD) induced by the adsorption of β-lactoglobulin solutions with three concentrations (0.1%, 1.0%, and 2.0%) at pH 7.0 as a function of time. The Δf was obtained at third overtone (f 3 = 15 MHz) and normalized (f 3/3).
Figure 6A shows the plots of Δf as a function of time for the pH-dependent adsorption of 1% β-lactoglobulin solution. According to some literature, 10 β-lactoglobulin at neutral pH exists as dimer structure in which two monomeric units are noncovalently linked. But dimer structure of β-lactoglobulin can be dissociated into monomeric units, which expose the hydrophobic sites in acidic condition. Hydrophobic interaction between protein monomer units and PES surface might occur. The magnitude of Δf in the adsorption of 1% of β-lactoglobulin increased with the decrease of pH of the protein solutions. However, the effects of pH on the ΔDs at saturation point were not different significantly, as shown in Figure 6B. The protein adsorption in acidic condition (pH 3.0) might be affected by the hydrophobic interaction by dissociation of dimer to monomer unit and electrostatic attraction between protein and PES surface because protein is positive charged below its isoelectric point and PES is negative charged in aqueous solution. 11 At neutral pH (pH 7.0), however, electrostatic repulsion between protein and PES surface might reduce the protein adsorption because both protein and PES surface have negative charges above pI. Therefore, protein adsorption at neutral pH was less than at its isoelectric point. From Figure 6A, it was apparent that the Δf of β-lactoglobulin at pH 3.0 did not reach the plateau in 50 min from the onset of the adsorption. Instead, it kept decreasing with the adsorption time without more changing the energy dissipation. This result suggested that the protein adsorption might be formed continuously and completely at the polymer surface. The magnitude of Δf increases with increase in pH value of the solution.
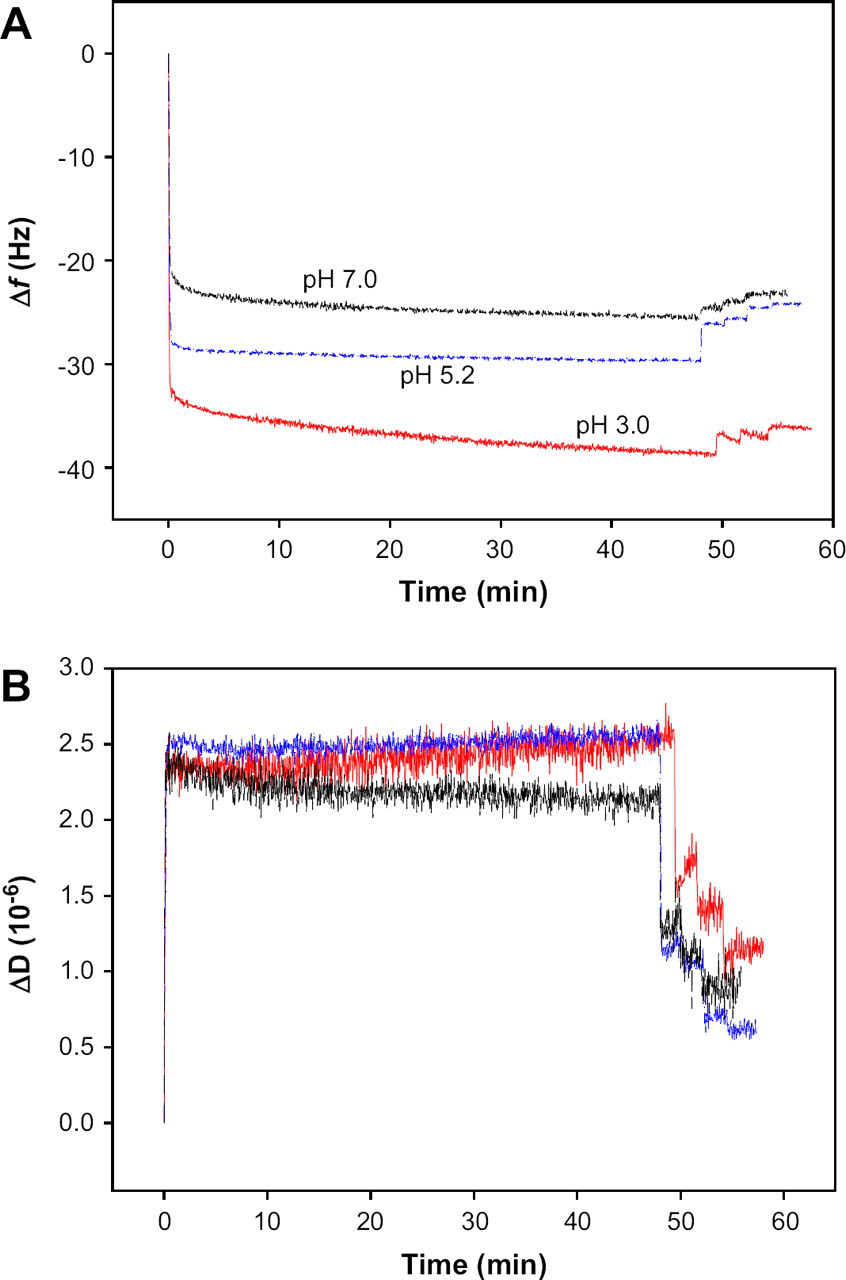
(A) Frequency shift (Δf) and (B) dissipation shift (ΔD) induced by the adsorption of 1% β-lactoglobulin solutions at three pHs (3.0, 5.2, and 7.0) as a function of time.
Structural Properties of Adsorbed Protein Layer
The Kevin—Voigt viscoelastic model-based correlations were used in the Q-Tool software to estimate viscoelastic properties and thickness of the adsorbed protein layer over time, which imposed specific frequency and dissipation on the storage modulus and loss modulus to examine the viscoelastic properties of β-lactoglobulin thin layer adsorbed on the PES-coated surface. The information on the viscoelastic properties of the adsorbed protein layer can be used in assisting the development of cleaning methods and optimizing the processing conditions to prevent or reduce protein adsorption and membrane fouling. Table 3 shows the viscosities and the elasticities of the adsorbed protein layer at three different concentrations. The obtained values at various concentrations of β-lactoglobulin ranged from 0.0023 to 0.01 kg/ms for viscosity, from 0.100 to 0.918 MPa for elasticity, and from 3.171 to 6.213 nm for thickness of the adlayer. The thickness of the adlayer increased with increase in concentration of the protein solution but both viscosity and elasticity of the adlayer decreased with increase in concentration. At 0.1% (w/v) of protein solution, the viscosity and elasticity of the β-lactoglobulin adlayer were 0.010 ± 0.001 kg/ms and 0.918 ± 0.334 MPa, respectively. These values were almost twice of those (0.0045 ± 0.0004 kg/ms and 0.555 ± 0.284 MPa) at 1.0% (w/v) and five to nine times of those (0.0023 ± 0.0001 kg/ms and 0.100 ± 0.001 MPa) at 2.0% (w/v) of protein solution. Even if the adsorbed mass and thickness at lower concentrations were small compared with those at higher concentrations, the viscosity and elasticity of the protein adlayer were much higher at lower concentrations. This indicated that the β-lactoglobulin adlayer at lower concentrations were more completely adsorbed and relatively rigid due to the strong interactions between proteins and the polymer surface. Therefore, it was hard to remove by the rinsing step.
The viscosity, elasticity, mass per unit area, and number density of molecules of β-lactoglobulin layer at various concentrations (0.1%, 1.0%, and 2.0% [w/v]) after four times of rinsing
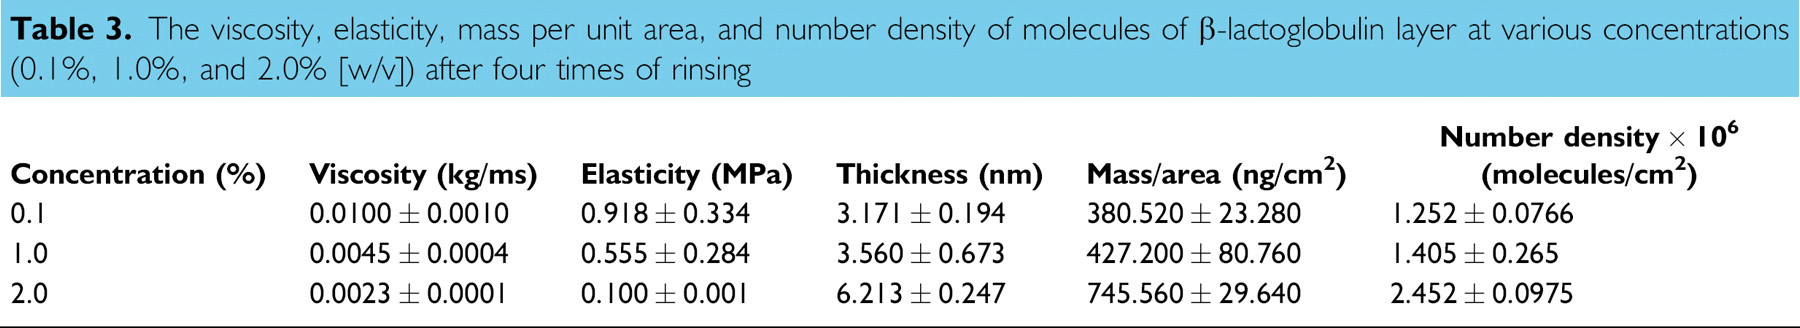
Figure 7 shows the thickness changes of the β-lactoglobulin adsorbed layers as a function of adsorption time at various concentrations (A) and pHs (B). In case of (A), the solution pH was 7.0 and in case of (B), the concentration of β-lactoglobulin was 1.0%. The thickness of protein layer adsorbed on PES-modified surface increased from 2 to 6 nm with the protein concentration from 0.1% to 2.0% after rinsing steps. The thickness also increases from 3.6 to 6.5 nm with decrease in the pHs from 7.0 to 3.0. Although the thickness of 2.0% protein at pH 7.0 is a little higher than the thickness of 1.0% protein at pH 3.0 before rinsing steps, it is reversed after rinsing four times. As shown in Figure 7, the amount of reversible protein is depending on the protein concentration but not depending on the solution pH. This result support that the major interaction in higher concentration is the interaction in proteins themselves, which could be recovered easily by rinsing steps but the major interaction in acidic condition is the interaction between protein and PES surface, which could not be recovered easily by rinsing steps.
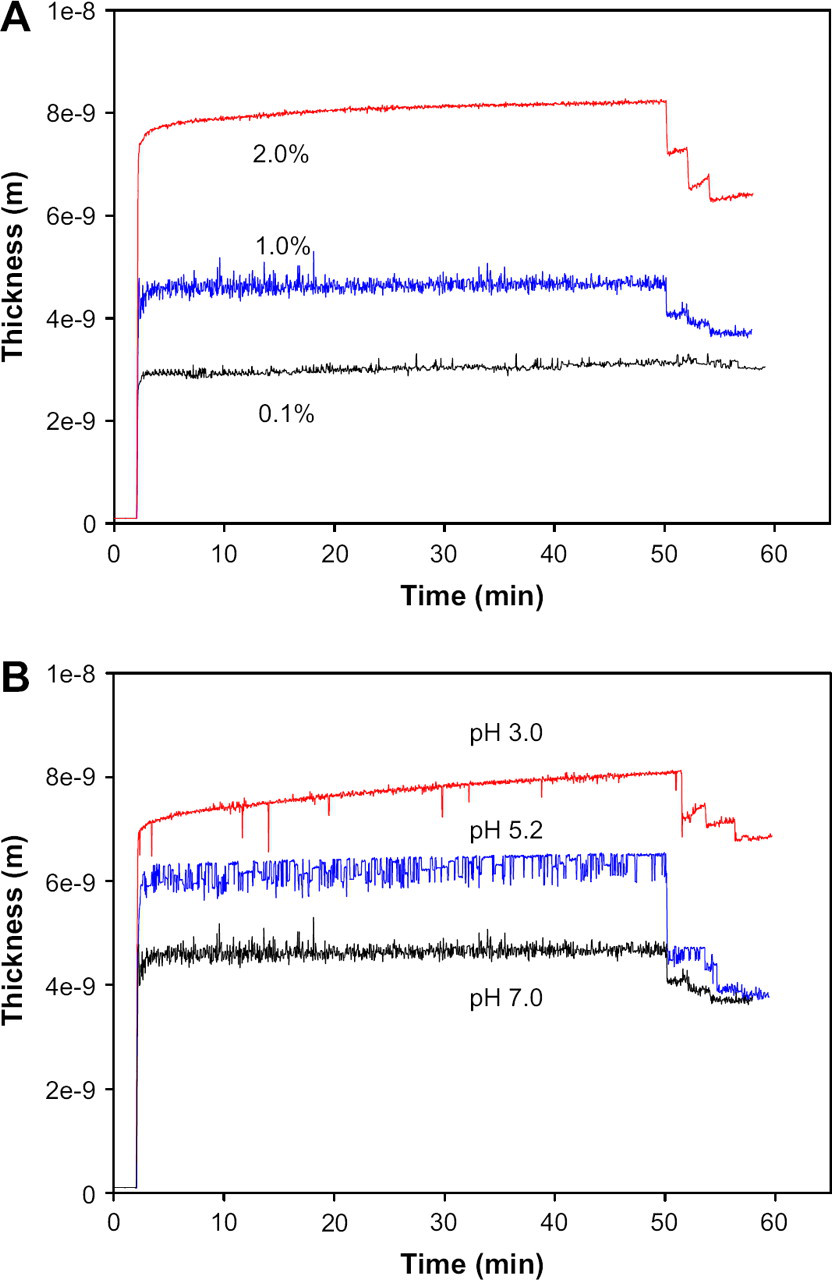
The thickness of the β-lactoglobulin adlayers at concentrations (A) and pHs (B).
Conclusions
QCM-D analysis is a powerful tool that can monitor and characterize protein adsorption on polymer surface, both kinetics of adsorption and structural properties of the adsorbed proteins, in real time. In QCM-D adsorption experiments, we have investigated the adsorption process of β-lactoglobulin on PES-coated quartz crystal surface and the viscoelastic properties of the adsorbed β-lactoglobulin layer using QCM-D monitoring. The QCM-D data in various protein concentrations and pHs showed similar trends in the adsorption processes; the Δf and ΔD changed rapidly and greatly after the injection of the β-lactoglobulin solutions, followed by minor changes with the adsorption time until the rinsing steps. The adsorption of protein on the membrane polymer surface consisted of reversible and irreversible adsorptions. Because irreversible adsorption was the main factor that causes permanent membrane fouling, the information on the mass and viscoelastic properties of the irreversibly adsorbed protein layers were important to optimize the process condition to reduce the membrane fouling.
From the QCM-D results, the Δf of β-lactoglobulin depended on both protein concentration and pH of the solution, but the ΔD depended only on protein concentration. These results suggested that the amount of adsorbed mass could be affected by concentration and pH of the β-lactoglobulin solution, but the viscoelastic properties of the protein thin layer were mainly altered by the concentration of protein solution.