
Abstract
This paper presents a visually servoed micropositioning system capable of automatically extracting locomotive features of Caenorhabditis elegans online at a full 30 Hz. The employment of Gaussian Pyramid Level-2 images significantly reduces the image size by 16-fold and permits real-time feature extraction, without sacrificing accuracy due to the cubic smoothing spline fitting. The automated micropositioning system is capable of revealing subtle differences in locomotive behavior across strains. A total of 128 worms of four C. elegans strains with different numbers of muscle arms were continuously tracked for 3 min per sample, and locomotive features were extracted online. Validated by experiments, the innovation in image analysis, or data reduction without sacrificing accuracy allows for rapid, online, and accurate analysis of streaming videos of C. elegans and other similar microorganisms.
Introduction
The nematode Caenorhabditis elegans (C. elegans), a soil-dwelling worm having a relatively simple and extremely well characterized anatomy, is widely used as a model for molecular genetic analysis due to the advantages of short generation time, amenability to germline transformation, 1 and completely sequenced genome. 2,3 Molecular genetics permits the manipulation of specific genes in the worm and the evaluation of their functions by quantitatively measuring the effects of the mutations on the worm's behavior, such as locomotion, egg laying, mating, and feeding. For the purpose of discriminating subtle behavioral differences between mutants and the control strain of these tiny worms (∼1 mm in length), automated systems capable of time-elapsed C. elegans motion tracking and high-accuracy locomotive feature extraction are required.
de Bono and Bargmann 4 developed a system to track worms and calculate their speed to characterize a neuropeptide Y receptor that regulates social behavior and food response in C. elegans. Pierce-Shimomura et al. 5 used a system to track the worm's movement turning rate to investigate the fundamental role of pirouettes. The system developed by Hardaker et al. 6 permitted quantifying several features of the worm's locomotion patterns (speed and directional changes) and investigating their correlation with egg laying. Based on the findings, specific serotonergic synapses appear to be critical for coordinating speed and directional changes.
More recently, Baek et al. 7 tracked individual worms and extracted more features representing the worm's motion and body posture over the course of recording, making it possible to quantitatively evaluate the behavioral phenotypes of novel mutants, gene knockout lines, or pharmacological treatments. Feng et al. 8 and Geng et al. 9 expanded the set of image features that were extracted off line from the recorded video sequences of worms. The latter group classified C. elegans phenotypes for a total of 1597 individual worm video sequences, representing wild type and 15 different mutants based on the worms' movement, posture, and texture information. Most recently, Cronin et al. 10 reported a system similar to Feng et al. 8 with a focus on sinusoidal movement parameters of the worm and demonstrated its application in analyzing the effects of toxic agents.
These existing tracking systems share much similarity. The centroid of the worm is constantly identified from the visual feedback, and a motorized stage is used to keep the worm within the field of view. Images of the worm, positions of the stage, and the centroid of the worm are recorded for off-line feature extraction. Off-line processing is disadvantageous in that it is time consuming and requires large storage space for image recording. Consequently, existing systems often capture images at low frequencies (<30 Hz) to reduce the amount of recorded data and reduce subsequent postprocessing time (typically, <2 frames/s). However, sampling at low frequencies limits the detection resolution and the capability of identifying subtle differences in behavior between mutants. To overcome the drawbacks of off-line processing, an automated micropositioning system was developed in this study, enabling online tracking at 30 Hz with a high resolution for revealing subtle differences in locomotive behavior of C. elegans.
An adult C. elegans has 95 body wall muscles (BWMs) for locomotion and head movement. 11 –13 Physical connections are established between BWMs and the motor neurons via membrane extensions called muscle arms that function as paths for muscles to receive stimulation from the nerve. 14 Different mutants have different number of muscle arms per BWM. Figure 1 shows the muscle arms from several dorsal BWMs. It was reported that tropomyosin (lev-11), the actin depolymerizing activity of actin depolymerizing factor (ADF)/cofilin (unc-60b), and myosin heavy chain B (unc-54) are each required for muscle arm extension. Loss of any of these genes inhibits muscle arm formation. 14 Although the locomotive behavior of C. elegans has been intensively investigated, its association with muscle arm development remains unclear.
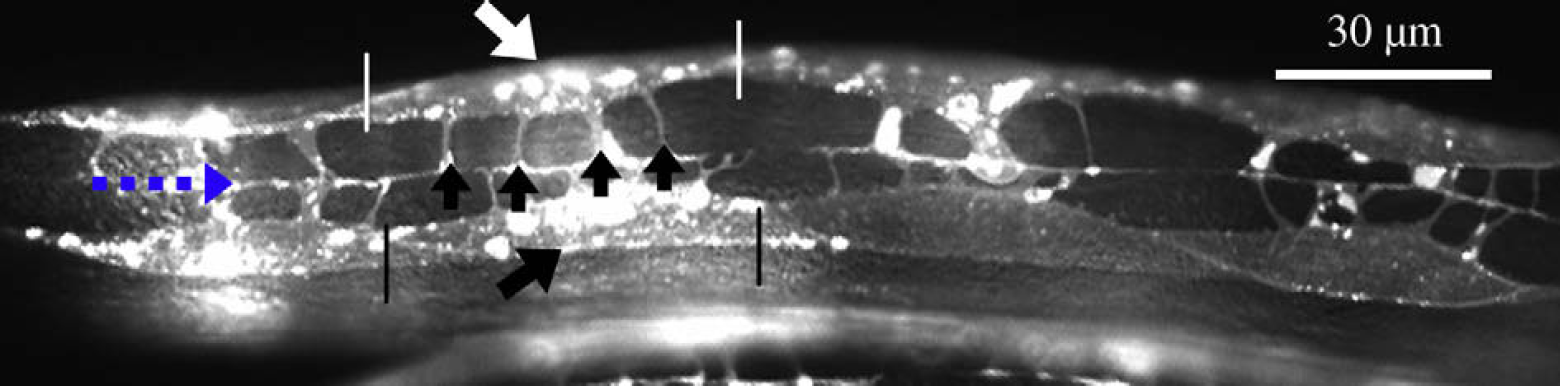
Muscle arms of Caenorhabditis elegans dorsal body wall muscles (BWMs) that express membrane-anchored YFP (MB::YFP) from the trIs30 integrated transgene. Top arrow pointing at the BWM Cpppaaa (in the pair of white vertical lines). Bottom arrow pointing at the BWM Cappaaa (in the pair of black vertical lines). Middle arrows pointing at four muscle arms of the BWM Cpppaaa. The leftmost dashed arrow pointing at the position of the nerve.
This article presents an automated micropositioning system for C. elegans motion tracking and online locomotive feature extraction, with more detail in technical aspects than the previously reported conference paper. 15 The system was used to extracting features for a total of 128 C. elegans samples of 4 strains (32 samples per strain) with different numbers of muscle arms.
C. Elegans Tracking
Figure 2 shows the image-based servoing control loop of the micropositioning system. The system constantly tracks the centroid of the worm. When the worm moves inside a preset region

where k is the feedback gain, and σ is time varying with σ(0) = 0 and
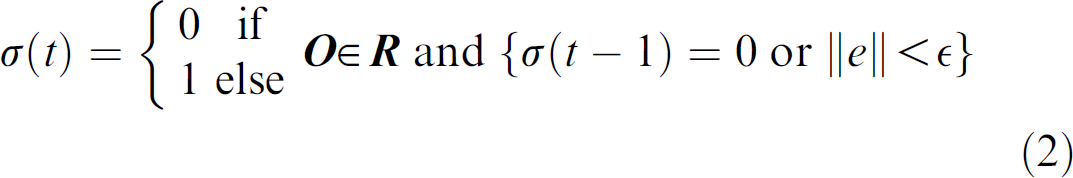
where ‖ ‖ is the Euclidean distance, and ε is the control accuracy.
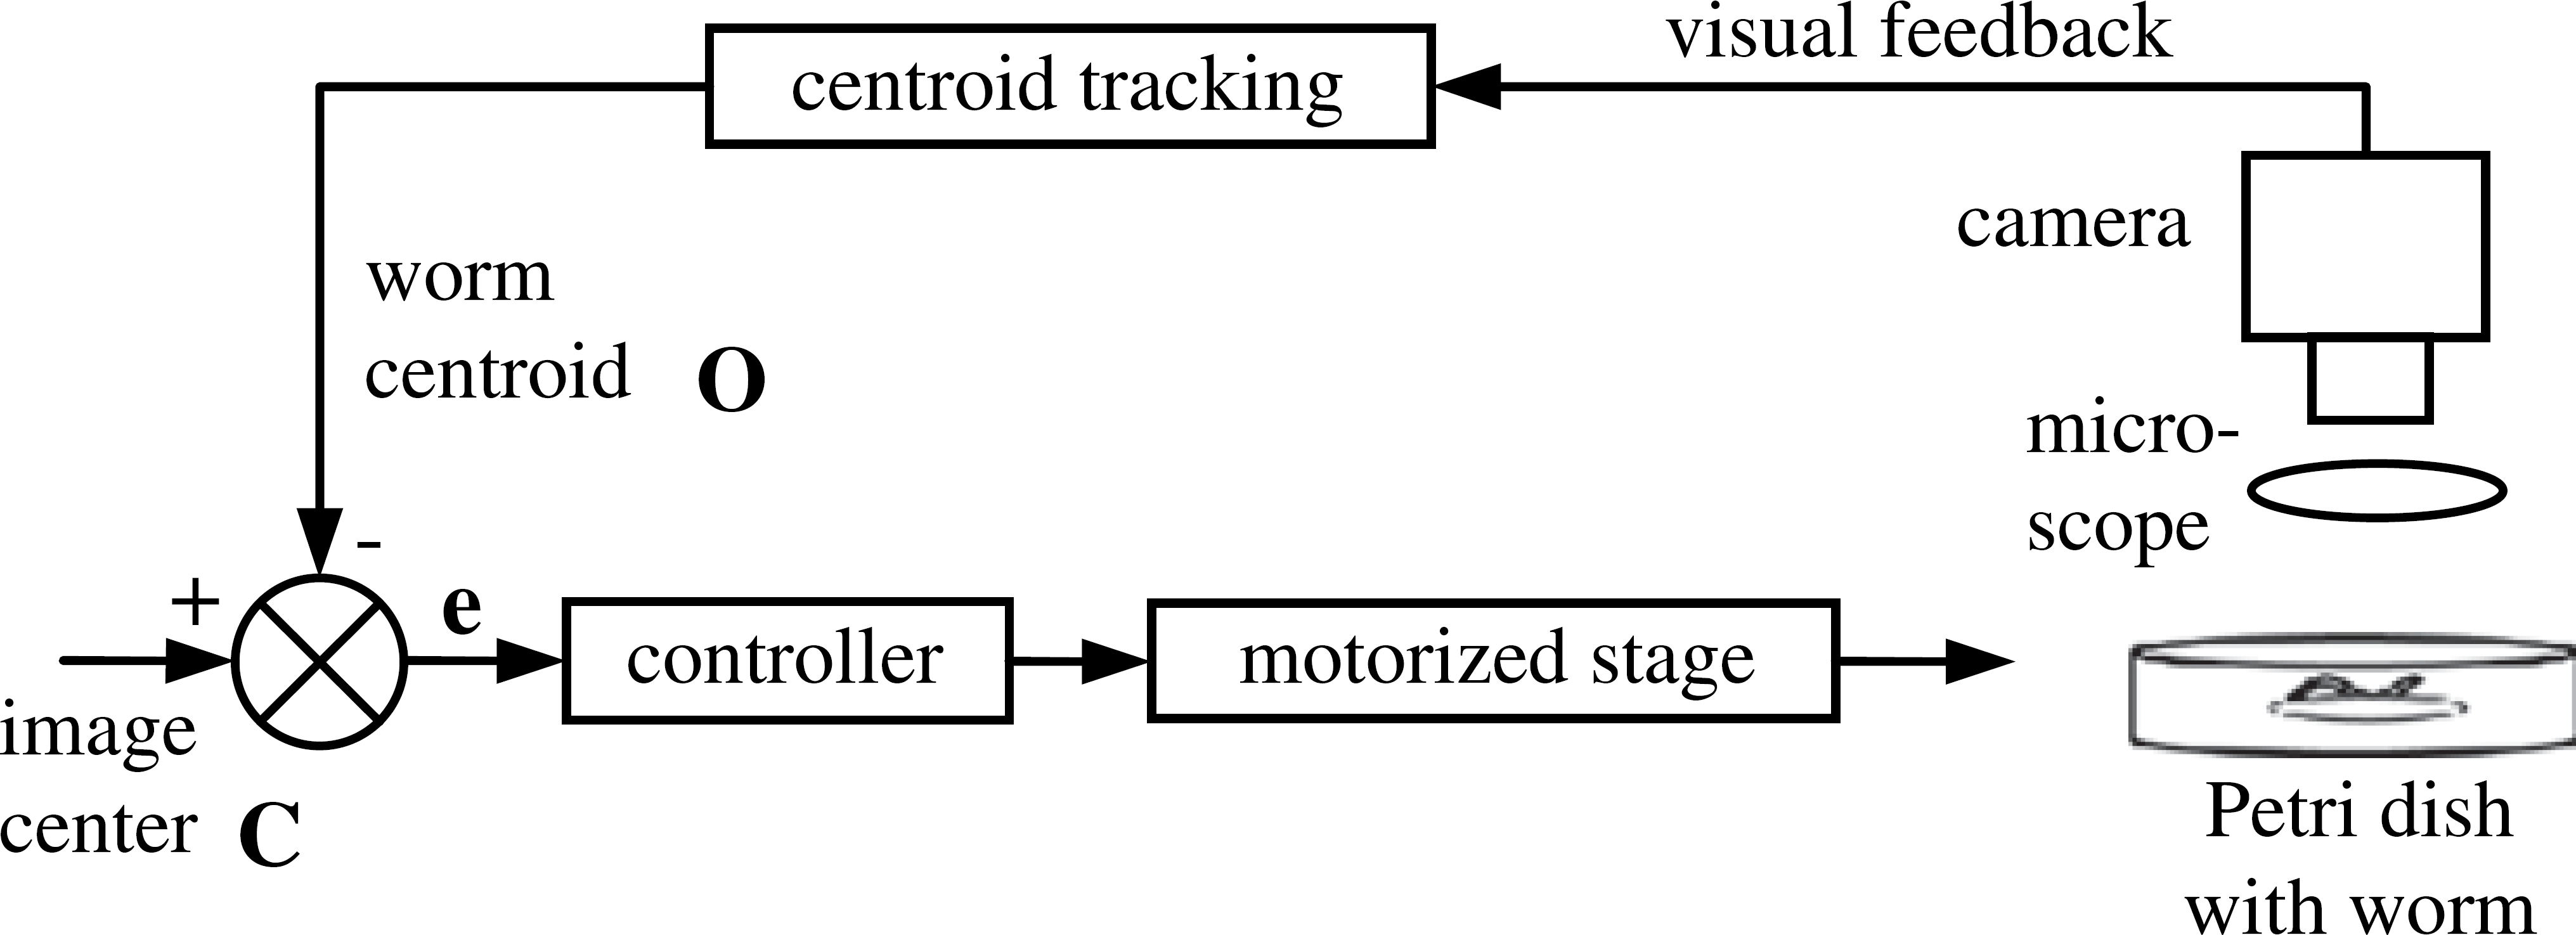
Block diagram of the visually servoed automated micropositioning system for Caenorhabditis elegans tracking.
The motion of the stage was designed to be discrete rather than continuous. It moves only when the worm crawls out of the preset region. This strategy means the stage mostly stays stationary during tracking, which is desired for reducing potential disturbances caused by the stage movement on the worm's locomotive behavior. Although the centroid is tracked continuously, locomotive features of the worm are extracted only when the stage is not in motion.
Real-time Feature Extraction
With the objective of extracting worms' locomotive features in real time with a high accuracy, a set of image processing procedures are conducted, as summarized in Table 1.
Image processing sequence
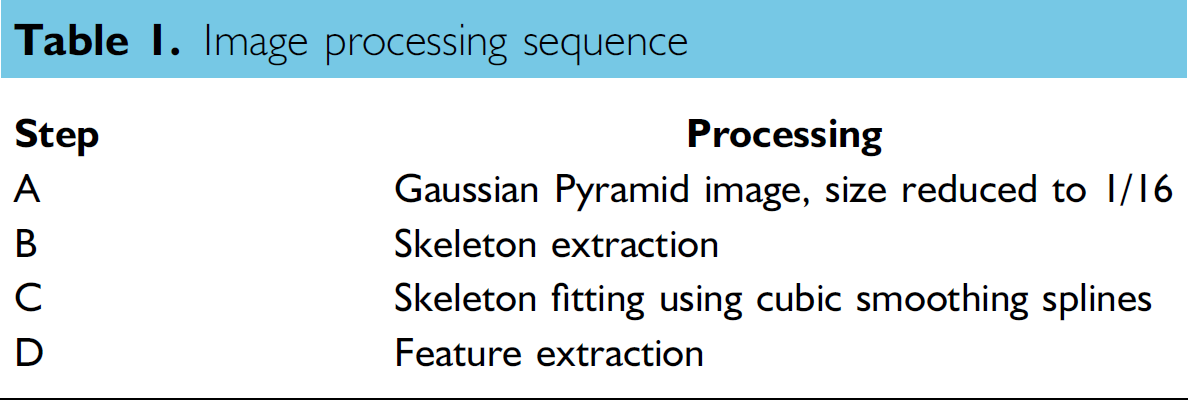
Image Size Reduction
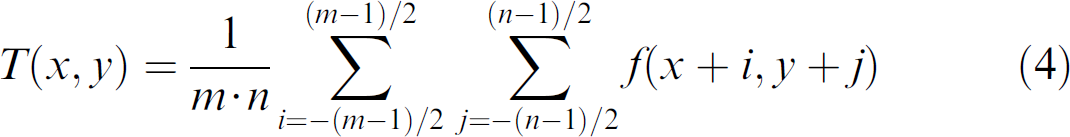
The image pyramid 16 consists of a sequence of reduced-sized copies of an original image. The zero level of the image pyramid, G 0, is the original image that is convolved with a Gaussian low-pass filter. The resultant image is then subsampled by a factor of two horizontally and vertically to obtain the pyramid Level-1 image, G 1. Further repetitions of the filtering and subsampling procedures generate more pyramid levels. The iterative process is

where g(m,n) is the Gaussian operator. A 3 × 3 operator is used in this article.
As an example, an original image (640 × 480) and its first two-level pyramid images are shown in Figure 3. The pyramid method permits real-time worm tracking and online feature extraction without sacrificing accuracy, which will be further discussed in section “Results and Discussion.”
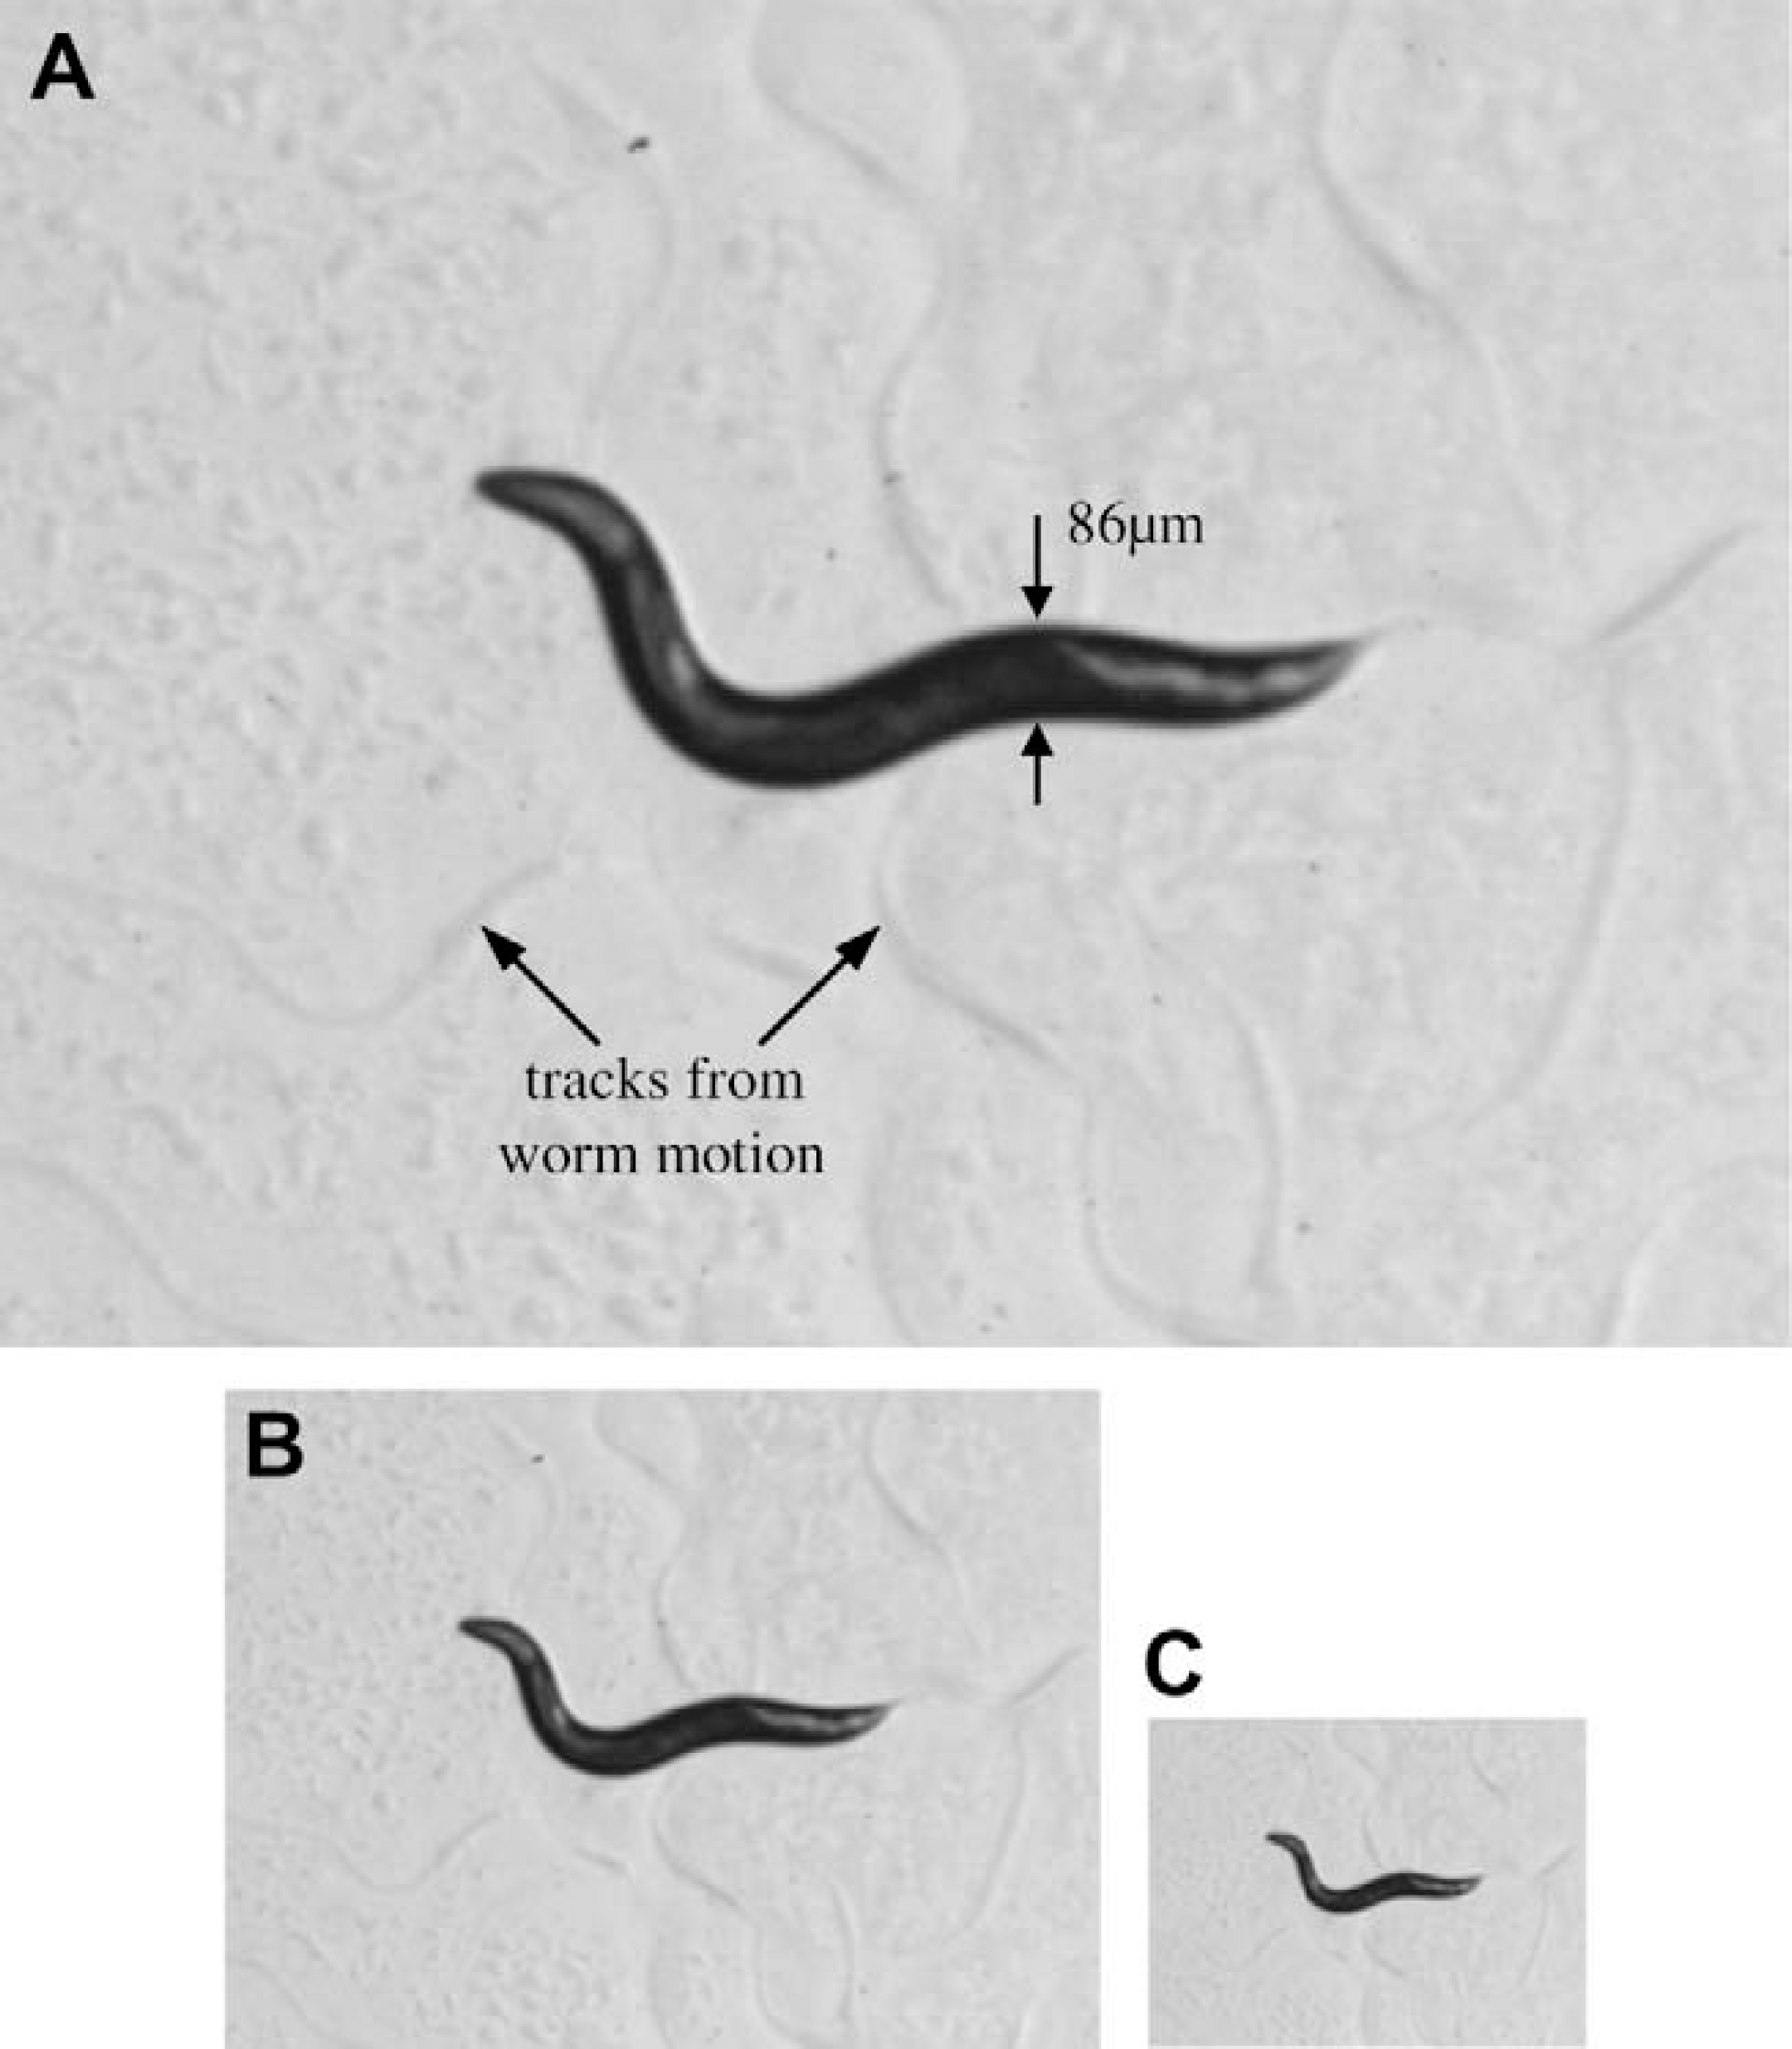
Gaussian Pyramid images of a Caenorhabditis elegans. (A) Level-0 image (original). (B) Level-1 image (1/4 size). (C) Level-2 image (1/16 size).
Skeleton Extraction
A skeleton results from thinning the binary image of the worm, from which locomotive features of the worm are extracted. Skeletonization of the worm requires a few steps to be conducted sequentially.
The binary image is thus obtained
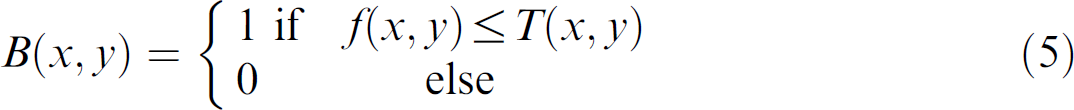
Figure 4A shows the result of binarization on the Level-2 image shown in Figure 3C. The worm body is recognized by identifying the maximum object. Undesired holes often exist within the thresholded worm body, which must be filled.
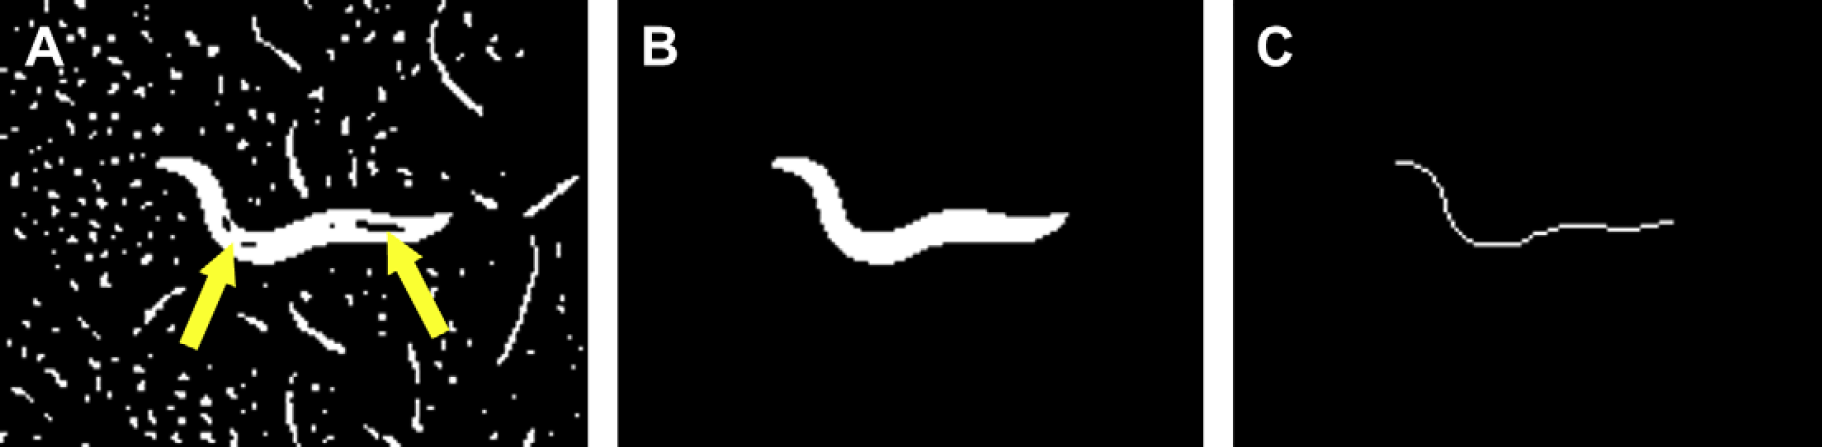
(A) Binarized image with interior holes labeled by arrows. (B) Interior holes filled. (C) Worm skeleton.
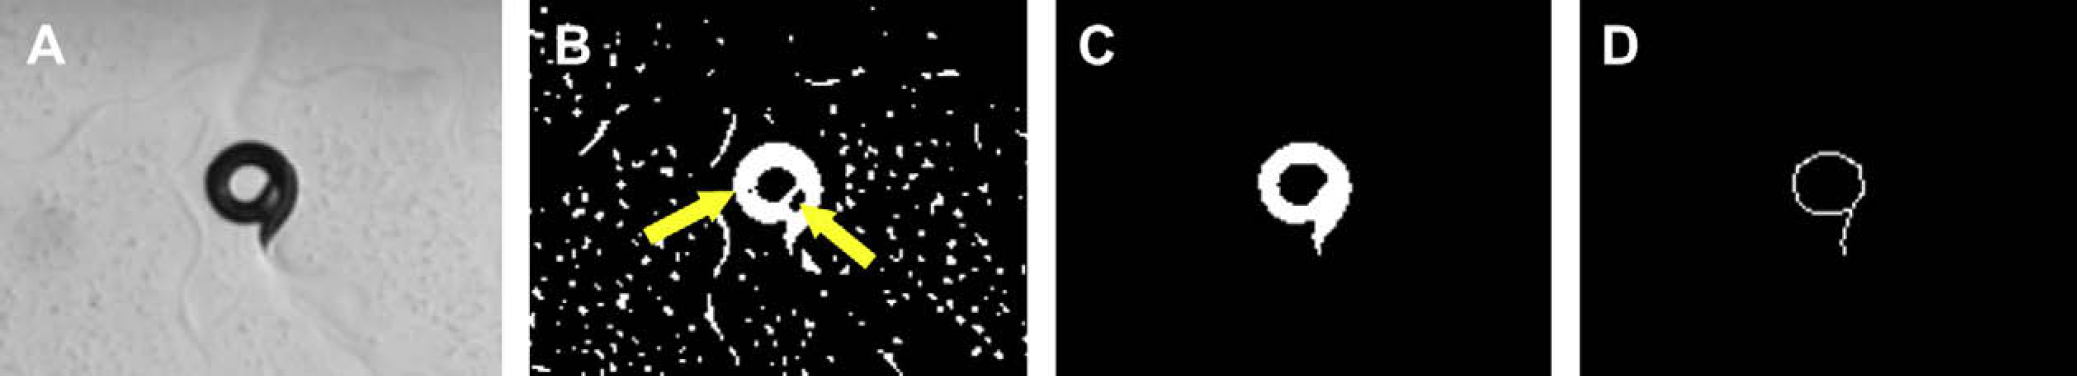
Worm coiling. (A) Gray-level image. (B) Binary image with interior holes labeled by arrows. (C) Interior holes filled. (D) Worm skeleton.
In a perfectly clean background, only the worm body appears white, and the skeleton has only two end points, representing head and tail, respectively. However, in reality, spurious branches along the skeleton exist due to background noise. Figure 6A shows a gray-level image. The background noise produces a spurious branch on the worm's skeleton, as shown in Figure 6D.
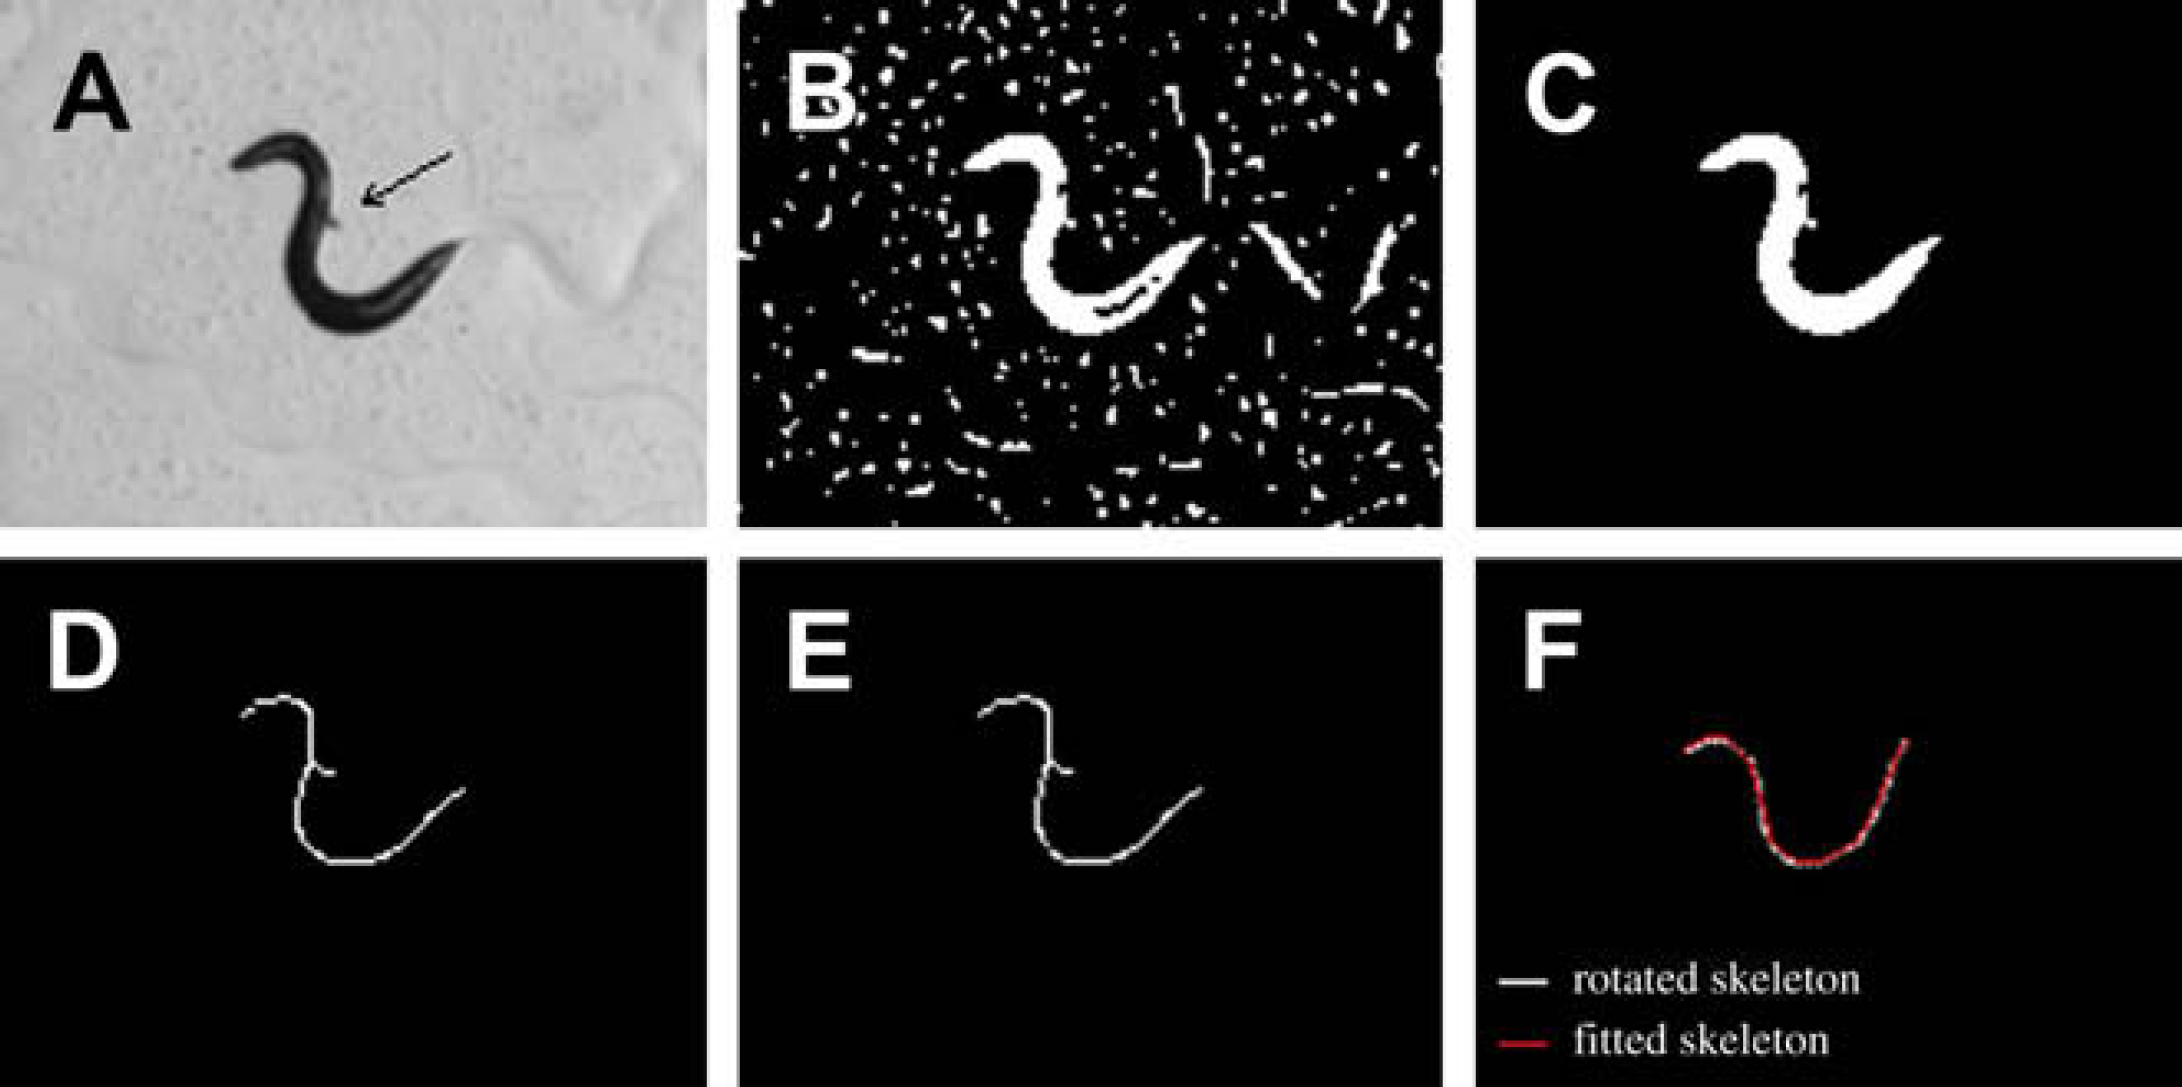
Skeletonization. (A) Gray-level image. Arrow points at a noisy object. (B) Binary image. (C) Interior holes filled. (D) Worm skeleton with a spurious branch. (E) Cleaned skeleton. (F) Rotated skeleton and spline fitting.
As spurious branches produce inaccuracies in locomotive feature extraction, they must be eliminated. For eliminating these branches, the skeleton is shrunk from all its end points simultaneously until only two real end points are left. The two remaining end points are then used to extend the path along the original skeleton to obtain a clean skeleton (Figure 6E).
Due to the fact that the skeleton obtained from Level-2 images (1/16 size) is discrete (zigzag) compared to the one obtained from original-sized images, a fitting is needed to attain smoothness and a subpixel resolution, which is important for accurately extracting locomotive features (e.g., amplitude of the worm's sinusoidal movement).
Skeleton Fitting
In Gaussian Pyramid Level-2 images, the reduced numbers of points that represent the skeleton degrade the resolution and smoothness. Thus, cubic smoothing spline fitting 18 is conducted. Let x 1 < x 2 < … < xn be a set of ordered x coordinates on the skeleton and y 1, y 2, …, yn be a corresponding set of y coordinates. The cubic spline s minimizes an objective function
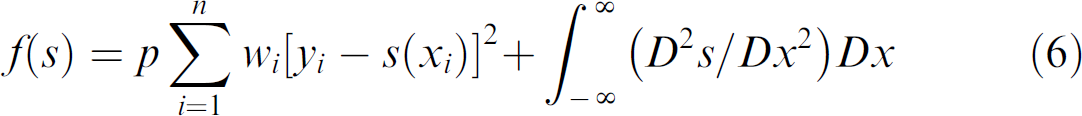
where p is a positive smoothing parameter, and wi is a positive weight for each point.
Before fitting is performed, the skeleton is rotated around its centroid to horizontally align its major axis. Figure 6F shows both the rotated skeleton and the fitted skeleton. The fitted skeleton has a subpixel resolution that permits more accurate image features to be extracted.
Feature Extraction
In this study, each worm was tracked for 3 min continuously. During tracking, two locomotive features among many others are of our particular interest for studying muscle arm development of C. elegans, including (1) instantaneous travel speed and (2) sinusoidal amplitude.

where moments 20 are

The body area is the first-order moment, m 00.
Between two successive frames of images, the centroid moves from point

Based on the calibrated pixel size, physical instantaneous travel speeds (μm/s) of the worm are obtained.
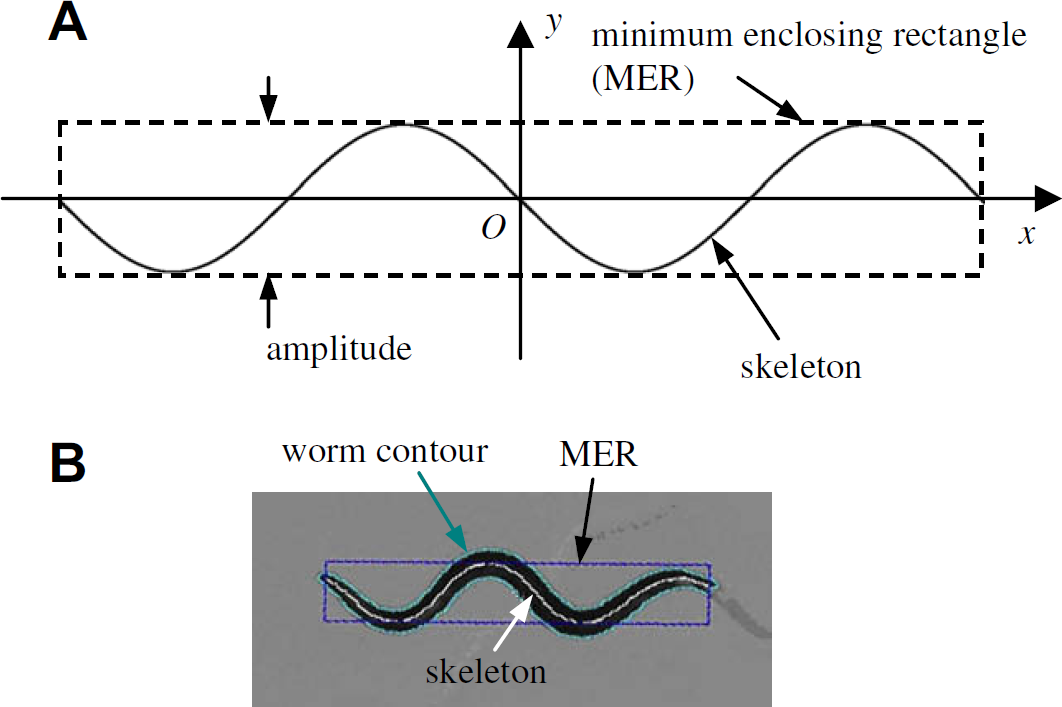
Skeleton resembling a sinusoidal waveform. (A) Schematic drawing. (B) A real case in tracking.
Occasionally, the worm coils or reverses to form an Ω posture. In this case, the skeleton resembles a circle or ellipse. To distinguish the sinusoidal waveform from circular or elliptic embodiments that also satisfy the above three conditions, a fourth condition is defined in this study: (d) the skeleton is neither circular nor elliptic. Additionally, a fifth condition is required to rule out the case when the worm stays stationary: (e) the travel distance between two successive frames needs to be nonzero, to avoid biasing the statistics toward a static posture.
For a skeleton that satisfies all the five conditions (a)–(e), its minimum enclosing rectangle (MER) is calculated, and the width of the MER is taken as the amplitude, as shown in Figure 7B. Based on the calibrated pixel size, physical amplitudes (μm) of the worm are obtained.
Experiments and Materials
System Setup
The system, shown in Figure 8, consists of an optical microscope (Olympus SZX12, Japan) with a CMOS camera (Basler A601f, Germany), and a three degrees-of-freedom micromanipulator with a travel of 25 mm and a 0.04-μm positioning resolution along each axis (MP-285, Sutter, CA). The micromanipulator, used as an XY stage, controls the position of a Petri dish for maintaining the worm inside the field of view. A motorized stage with a larger travel, although not essential, could create an even more spacious environment for the worms. A host computer (3 GHz CPU and 1 GB memory) with a motion control card (NI PCI-6259, Austin, TX) is used for motion control and image processing. The system setup except the host computer is mounted on a vibration isolation table.
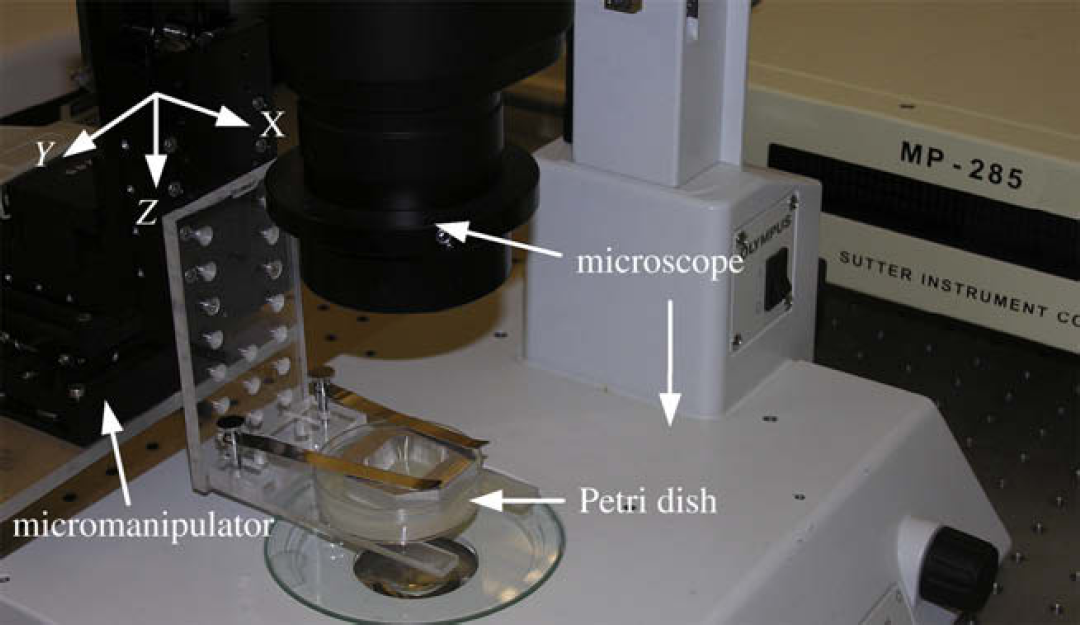
Micropositioning system for Caenorhabditis elegans tracking.
Worm Strains
Table 2 summarizes the four C. elegans strains investigated in this study. Worms of these strains have different numbers of muscle arms. RP247 is the control strain and has a wild-type number of muscle arms. 14 RP472 has fewer muscle arms than wild-type controls and was isolated in an F2 screen for creating muscle arm extension defective mutants. RP526 is a double mutant constructed by crossing RP472 and RP398 strains and also has fewer muscle arms than wild-type controls. Finally, RP398 contains a mutation conferring supernumerary arms. All the four strains have the trIs30 transgene that enables visualization of the muscle arms. 14
Muscle arm numbers of the four worm strains
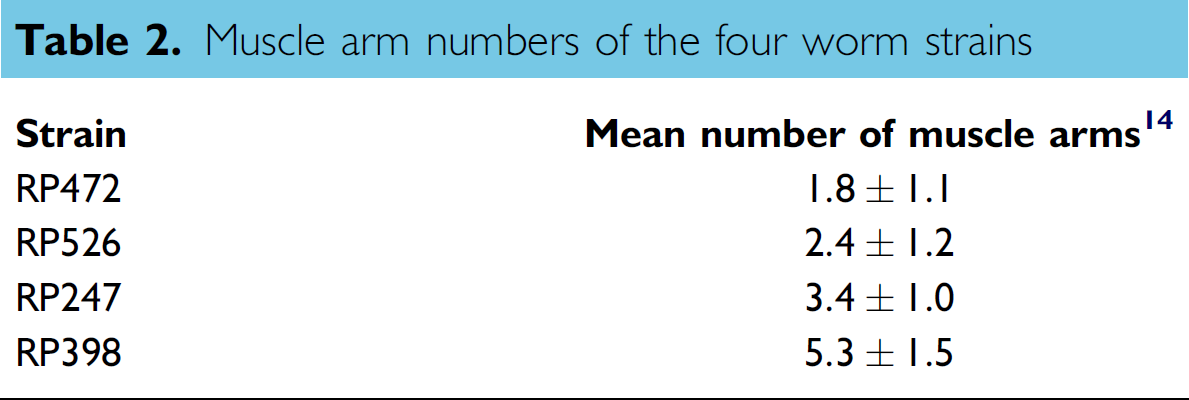
The automated micropositioning system was developed in this study to investigate, for the first time, if mutants with different numbers of muscle arms have subtle differences in locomotive behavior.
The worms used in this study were all young adults, picked at the L4 stage and cultivated at 20 °C on plates for 12–18 h before experiments. As the worms tend to be more active upon being transferred to a fresh Petri dish, each worm was given 2 min for acclimation before tracking and feature extraction was started. The experiments were conducted at room temperature.
Petri Dish Preparation
Thirty-two 60 mm agar plates were prepared for holding individual worms. No bacteria were placed on the agar surface. A square “moat” (20 mm × 20 mm) was formed on the agar surface and filled with 4 molar (4 M) fructose (Sigma-Aldrich, MO). It is known that C. elegans avoids boundaries where high osmolarity solutions such as 4 M fructose appears. 19 Thus, the worms were confined to move within the square-shaped “moat.” According to experimental observations, the “moat” does not interfere with the worm's locomotion.
Worms were tracked in a “set by set” manner. Each set contained four worms (one worm per strain). From set to set, the order of testing was rotated to maintain the equity of occurrence in the experiments. For example, experiment set 1 tracked RP472, RP526, RP247, and RP398 sequentially; then experiment set 2 was conducted in the order of RP526, RP247, RP398, and RP472. Additionally, for each set the same Petri dish was used and disposed after the completion of testing one set (four worms). The Petri dish was disposed after one set because the surface was noticeably affected by the platinum needle that was used to transfer worms to and from the plate.
Results and Discussion
A total of 128 worms (32 from each strain) were individually tracked. Each worm was continuously tracked for 3 min, which amounted to the processing of a total of 691,200 frames of images. When the original images were reduced to Level-2 images, the required processing time for feature extraction decreased from 1.5 s to 25 ms, allowing for real-time feature extraction during worm tracking. Simultaneously, the system also permits recording original-sized worm images, and the feature extraction method can be used for rapid off-line analysis.
Despite image size reduction for achieving real-time performance, a high degree of accuracy is maintained for the two features. This was verified by seven Hu moment invariants 20 that are often used as similarity measures. For two given objects of different sizes, the closer their Hu moment invariants, the more similar these objects, and the more accurate the extracted features from reduced-sized images.
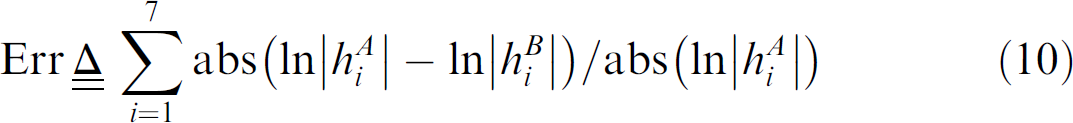
Table 3 lists a comparison of the seven Hu moment invariants of worm bodies in reduced-sized images and original images. Based on the Hu invariants, the shape-matching error 21 between shape A and B is
Seven Hu moment invariants of the two bodies
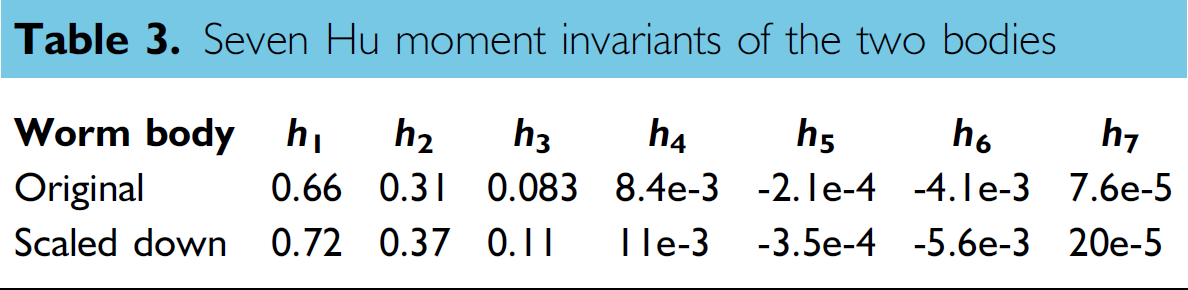
The shape-matching error between the original-sized images and the reduced-sized images was <0.73%, demonstrating that a high similarity is conserved when Level-2 images were used for online feature extraction.
Figure 9 shows that the skeleton recovered from Level-2 images is not as smooth as the skeleton obtained from original images, due to subsampling. The maximum shape-matching error, Err between the two skeletons is 0.14% that is further reduced by cubic spline fitting (Err between fitted skeleton and original skeleton is 0.06%). It can be concluded that fitted skeletons are nearly identical to the original skeletons. Thus, a high accuracy in locomotive feature extraction is conserved when skeletons are obtained in real time from Level-2 images and then cubic spline fitted.
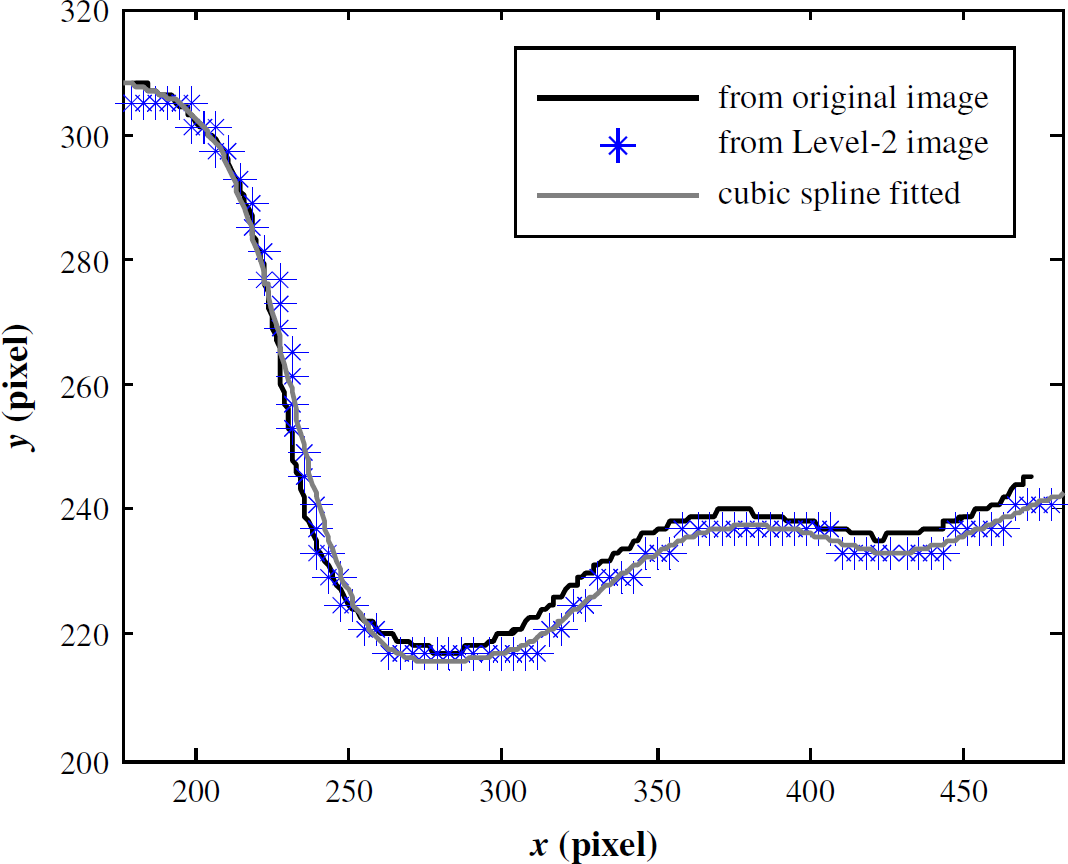
Skeleton comparison; x and y axes are image coordinates.
In the experiments, locomotive features of the 128 worms were extracted online. A set of representative data for a RP398 C. elegans is shown in Figure 10. The maximum sinusoidal amplitude and maximum travel speed of this worm reached 241 μm (∼3 times its body width) and 384 μm/s, respectively.
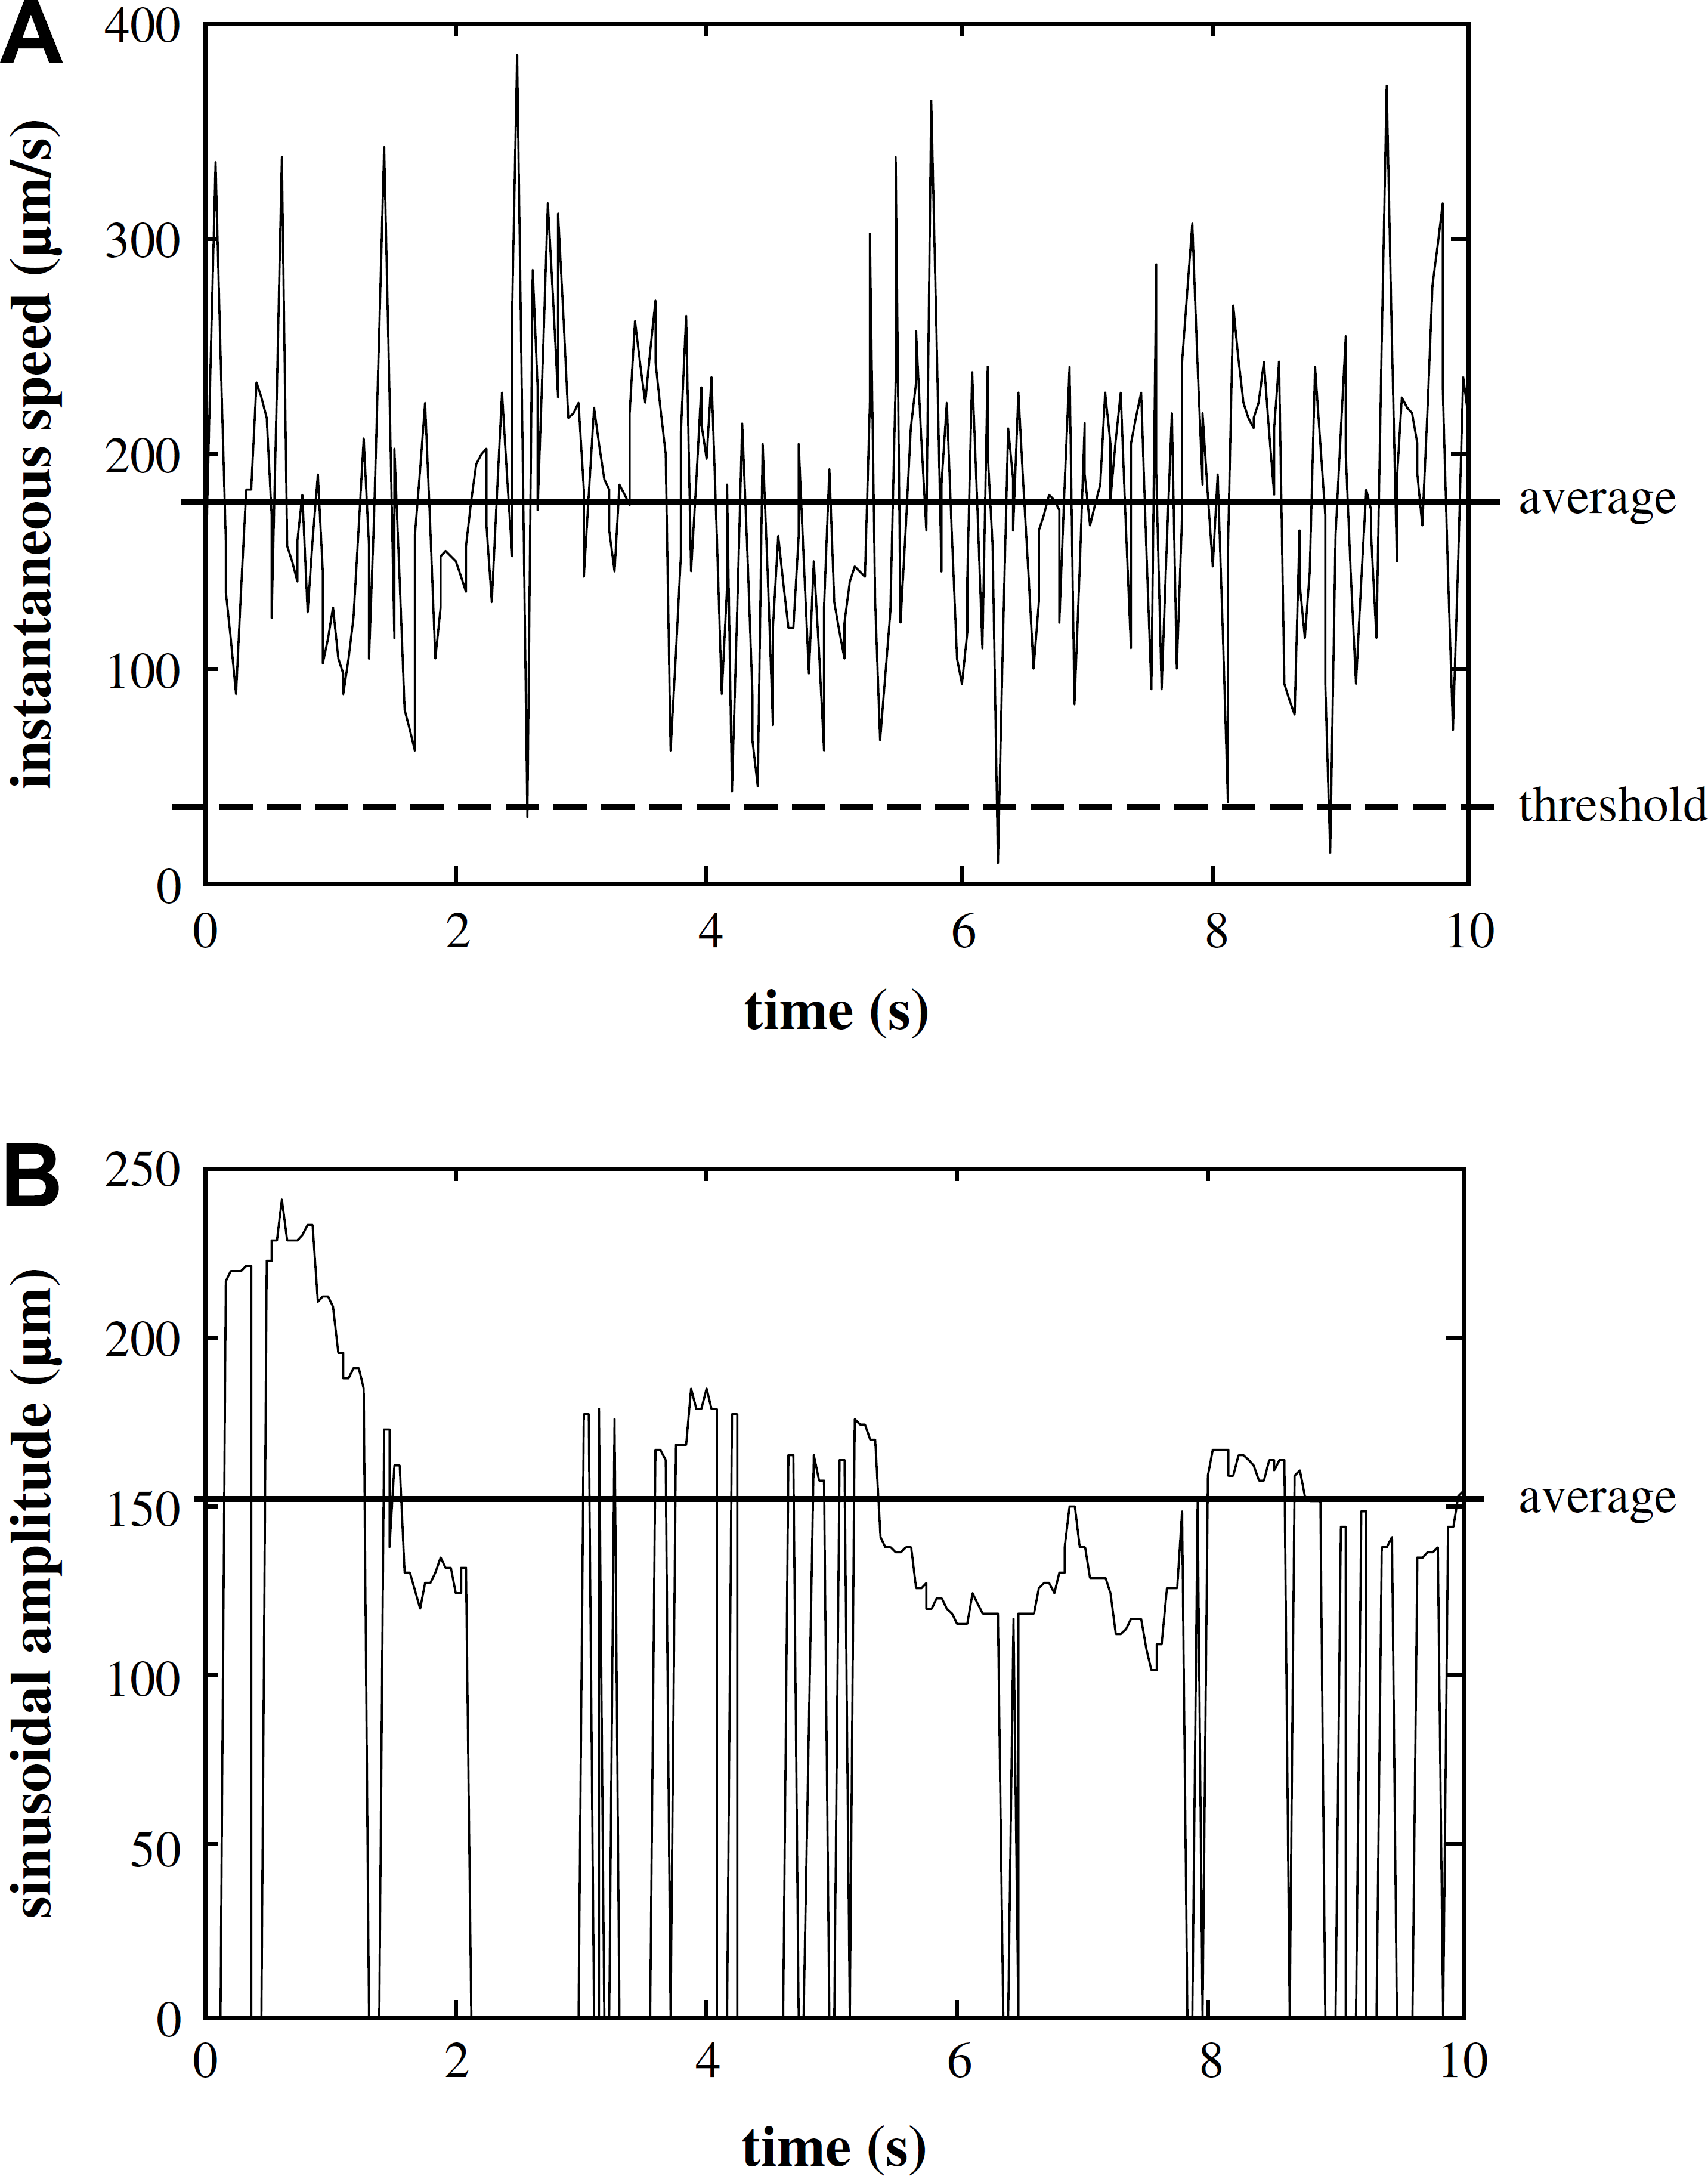
Locomotive features extracted in real time for a RP398 Caenorhabditis elegans. (A) Instantaneous travel speed. A threshold selected at 30 μm/s rules out the cases when the worm stayed stationary or moved very slowly. (B) Sinusoidal amplitude. The amplitude is nonzero only when the worm's locomotive pattern satisfied all the five criteria for classifying the pattern as sinusoidal.
The instantaneous travel speeds (Fig. 10A) exceeding a threshold value, which was used to rule out the case when the worm stayed stationary or moved very slowly, were averaged throughout the 3-min tracking period. The average speed was then divided by the body area of the worm to obtain a scaled travel speed. Scaling the average speed by the body area of the worm helped reduce the effect of size differences of individual worms. Similarly, a scaled sinusoidal amplitude was obtained for each worm (Fig. 10B). Subsequently, the mean value and the standard error of the mean (SEM) of the two locomotive features were calculated for each strain of 32 worms. Finally, the mean value and the SEM were normalized to the range of [0, 1] (i.e., normalized average speed and normalized average amplitude), which are shown in Figure 11.
Figure 11A shows that the mean values of the normalized average speeds are not correlated with the number of muscle arms. However, the mean values of the normalized average amplitudes increase with a greater number of muscle arms, as shown in Figure 11B. Despite the large SEMs, these preliminary data might lead to the hypothesis that more connections between muscles and the nerve, manifested in more muscle arms, allow muscles to receive more stimulation from the nerve. In response to more excitatory innervation received from the nerve, muscles generate more strength of contraction, leading to increased bending of the worm and consequently, higher sinusoidal amplitudes.
The large SEMs were possibly caused by imperfect temperature control; relatively short acclimation time allowed in the experiments; limited tracking time period; absence of bacteria (e.g., Escherichia coli as worm food); and environment differences in the 32 plates. However, they might also reflect actual variations in worms' locomotive behavior.
To attain more conclusive understandings of the correlations between phenotypic behavior and the number of muscle arms, if they exist at all, further detailed studies are required to test a large-scale sample set (200 worms per strain) under highly controlled experimental conditions, for example, precise temperature control with a variation of ±0.2 °C, longer acclimation time for 0.5 h, longer tracking time periods for 1 h per sample, and one plate with bacteria for each worm. The capability of the automated micropositioning system for real-time tracking and feature extraction with a high accuracy makes the investigation of a large-scale sample set for a long-time period practical.
Conclusions
This paper presents an image-based servoed micropositioning system that is capable of automatically accurately tracking C. elegans and performing online locomotive feature extraction. The employment of Gaussian Pyramid Level-2 images significantly reduces the image size by 16-fold and permits feature extraction at a full 30 Hz, without sacrificing accuracy due to the cubic smoothing spline fitting. Enabled by the capability of the automated micropositioning system in revealing subtle differences in locomotive behavior across strains, the relationship between C. elegans locomotive behavior and the number of muscle arms, for the first time, was investigated. Experimental results demonstrate the effectiveness of the automated micropositioning system for prompt, reliable, precise feature extraction to permit large-scale tracking of locomotion of C. elegans, promising important technological advance for investigating the subtle behavioral differences in the nematode. The potential impact of this research extends beyond revealing subtle phenotypic differences in C. elegans locomotive behavior across strains by demonstrating how automated micromanipulators can be used to provide valuable tools for genetic investigations of C. elegans.
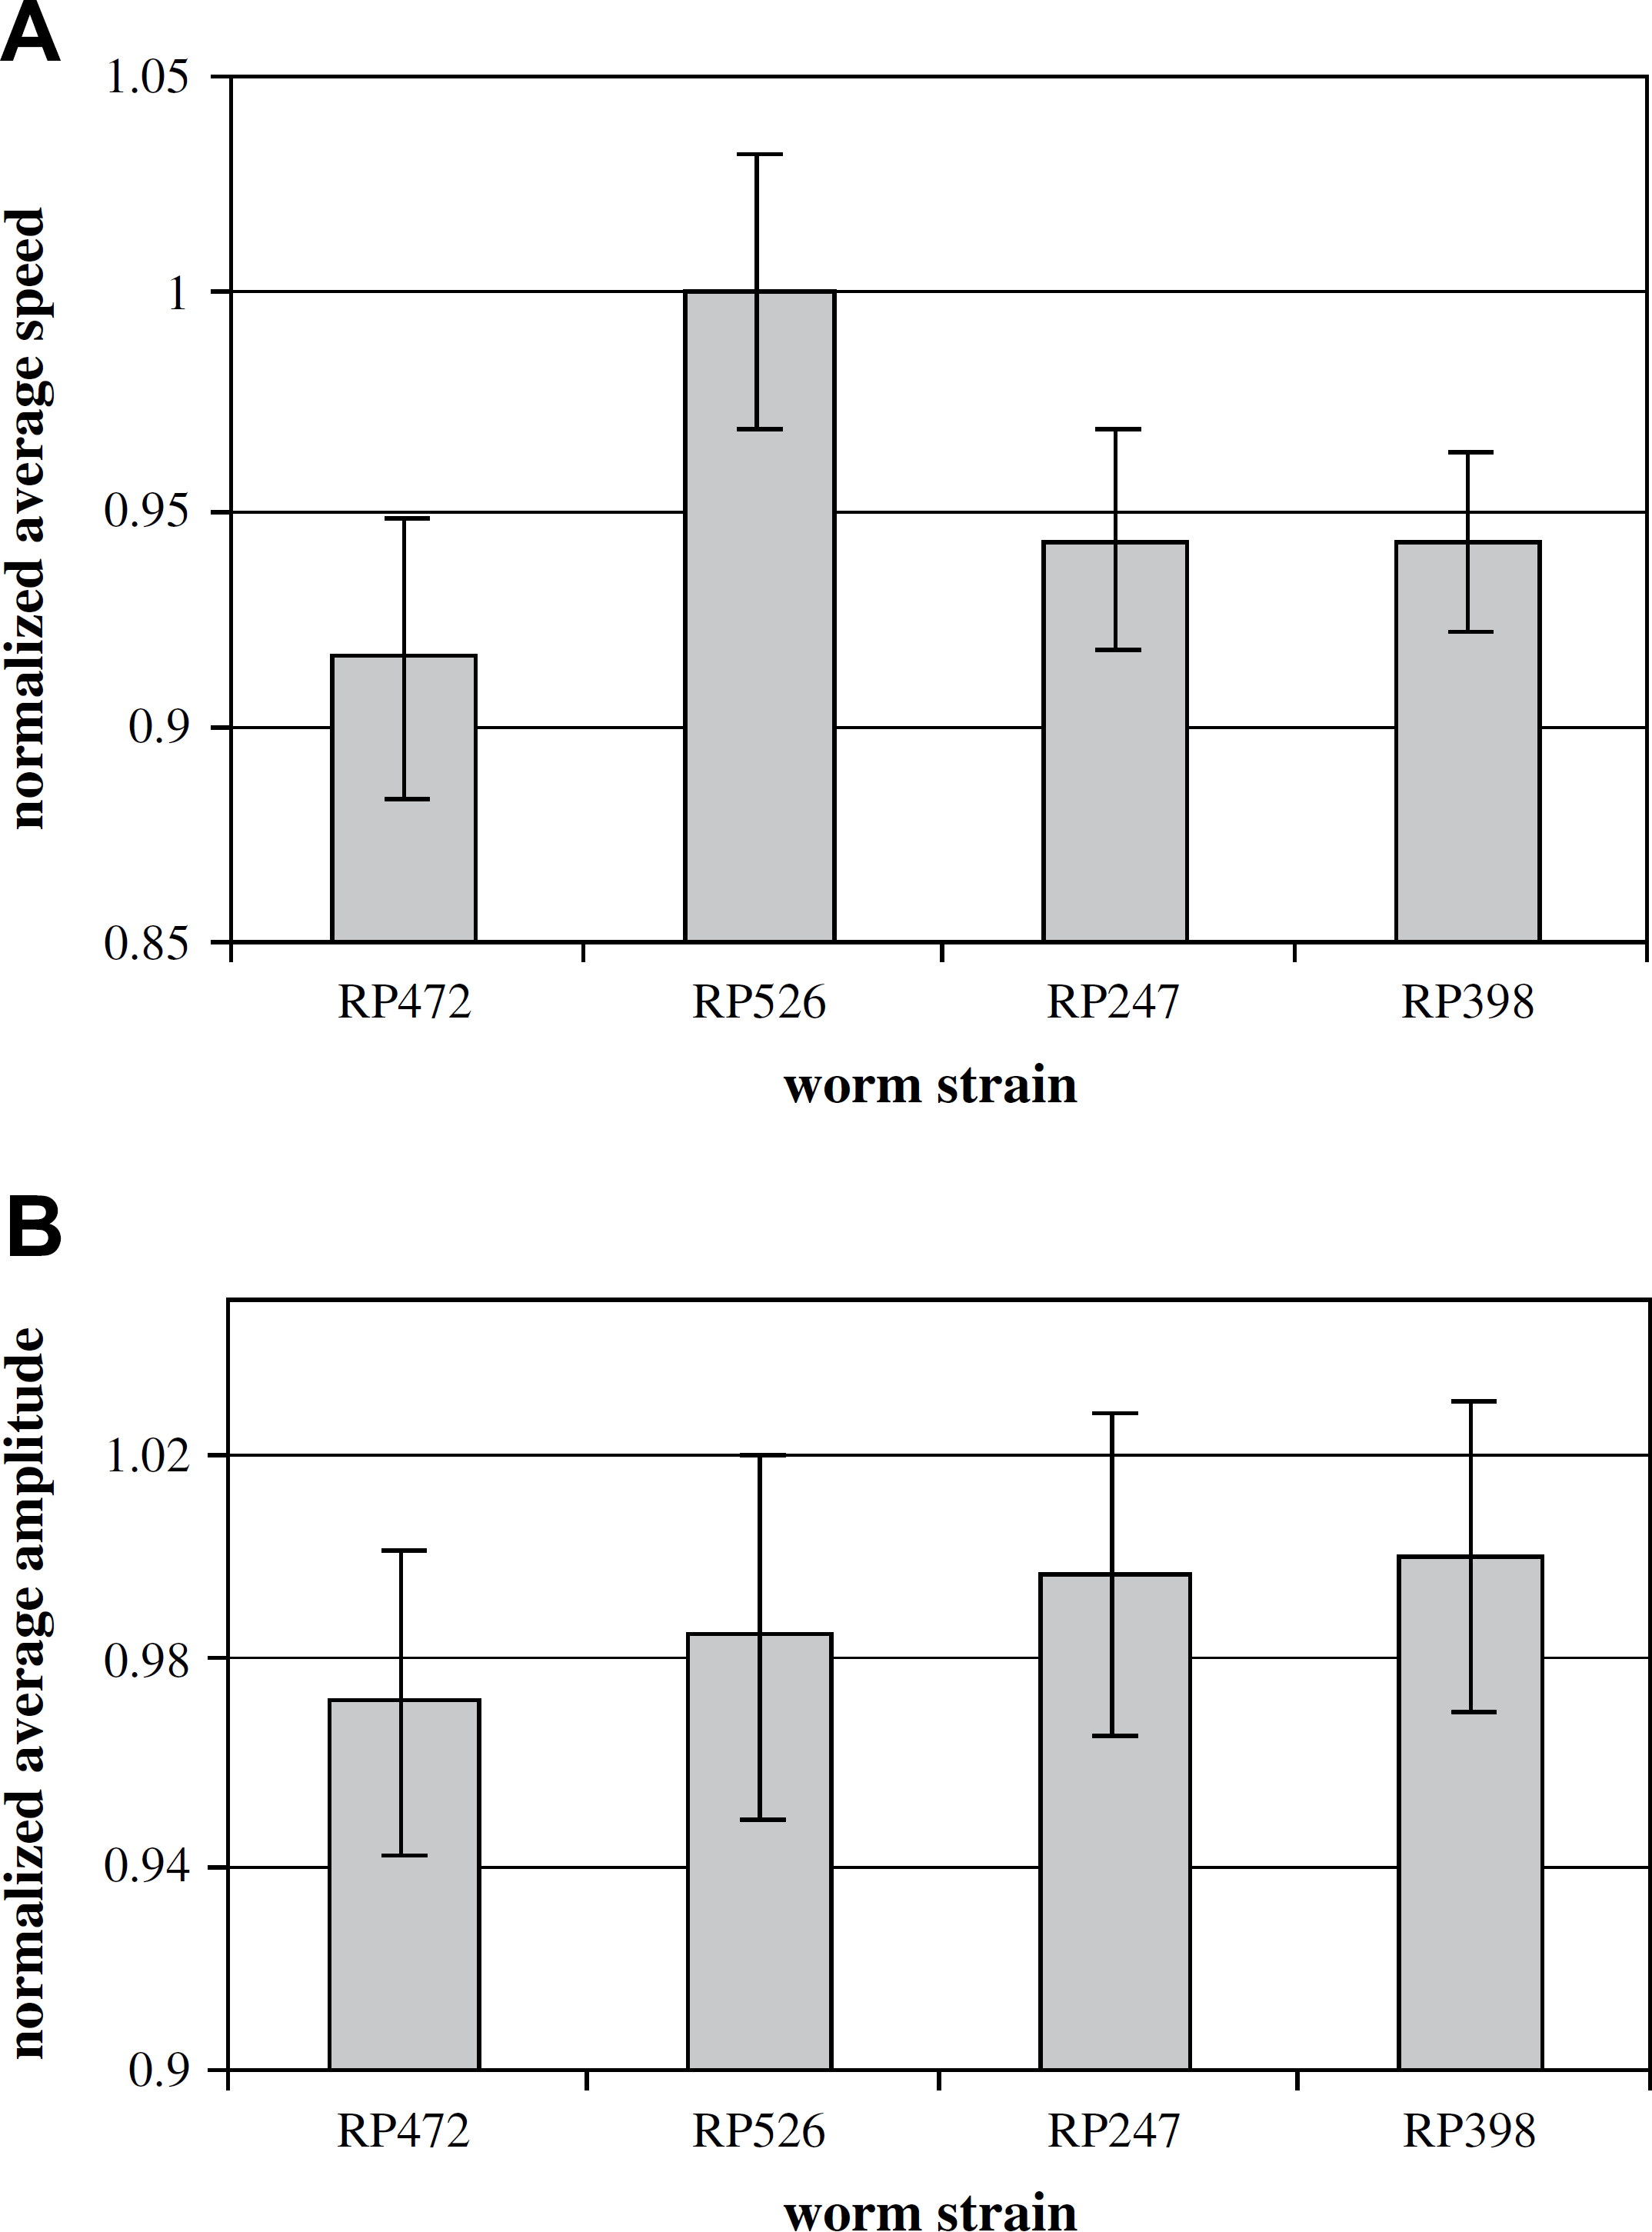
Statistical results of locomotive features of the four Caenorhabditis elegans strains. Worm strains shown on x-axis have an increasing number of muscle arms. Error bars represent the standard error of the mean. (A) Normalized average speed. (B) Normalized average amplitude.