
Abstract
The Allen Brain Atlas (ABA) is a genomic scale, web-based 3D atlas of expression of more than 20,000 genes in the mouse brain visualized using colorimetric in situ hybridization. Completing the ABA required imaging more than 1 million individual brain sections at cellular resolution. To facilitate these imaging needs, a high throughput, fully scalable, automated microscopy platform capable of imaging more than 3000 brain sections daily was developed. This system runs 24 h per day and 7 days per week with minimal operator supervision. The platform comprises a barcode scanner, fully automated microscope, stage, slide loader, digital camera, and custom software for managing the microscopy process. When operating at full capacity, the imaging system generates approximately one terabyte of uncompressed image data daily. Image data from the platform are freely available as part of the ABA online.
Introduction
The Allen Brain Atlas (ABA) 1 is an anatomically comprehensive, web-based 3D atlas of gene expression patterns for over 20,000 genes in the adult mouse brain. Data collection for the ABA project required imaging of more than 1 million individual brain sections labeled via colorimetric in situ hybridization (cISH) or Nissl staining at sufficient resolution to allow visualization of individual cells. Essential to the completion of the ABA within the project's 3-year timeframe, therefore, was the establishment of a scalable, high-throughput automated microscopy platform capable of imaging more than 3000 brain sections daily integrated with an efficient informatics data pipeline for image processing.
In this article, we describe the systematic scheme used to configure the slides into meaningful, easily tracked data sets; the imaging requirements for the project; the hardware and software assembled to accomplish the image capture; and the integration of the imaging platform with computational systems to manage capture and processing of the images.
ABA Slides
Slides for the ABA project each contain four mouse brain sections cut in either the sagittal or coronal plane. 2 To achieve uniform sampling across the brain, sections from a single brain are placed methodically on eight series of slides such that each slide contains four sections sampled every 200 μm. A brain sectioned sagittally through a single hemisphere yields 160 sections, and thus eight series of five slides (20 sections). A coronally sectioned brain yields 480 sections, and thus eight series of 15 slides (60 sections). In either plane, every fourth section (Series 4 and 8) is Nissl stained, providing anatomical reference sections sampled every 100 μm. Each of the other six series is labeled for a single gene. The initial ABA survey of all genes is done in the sagittal plane, with selected genes replicated in the coronal plane (see Fig. 1).
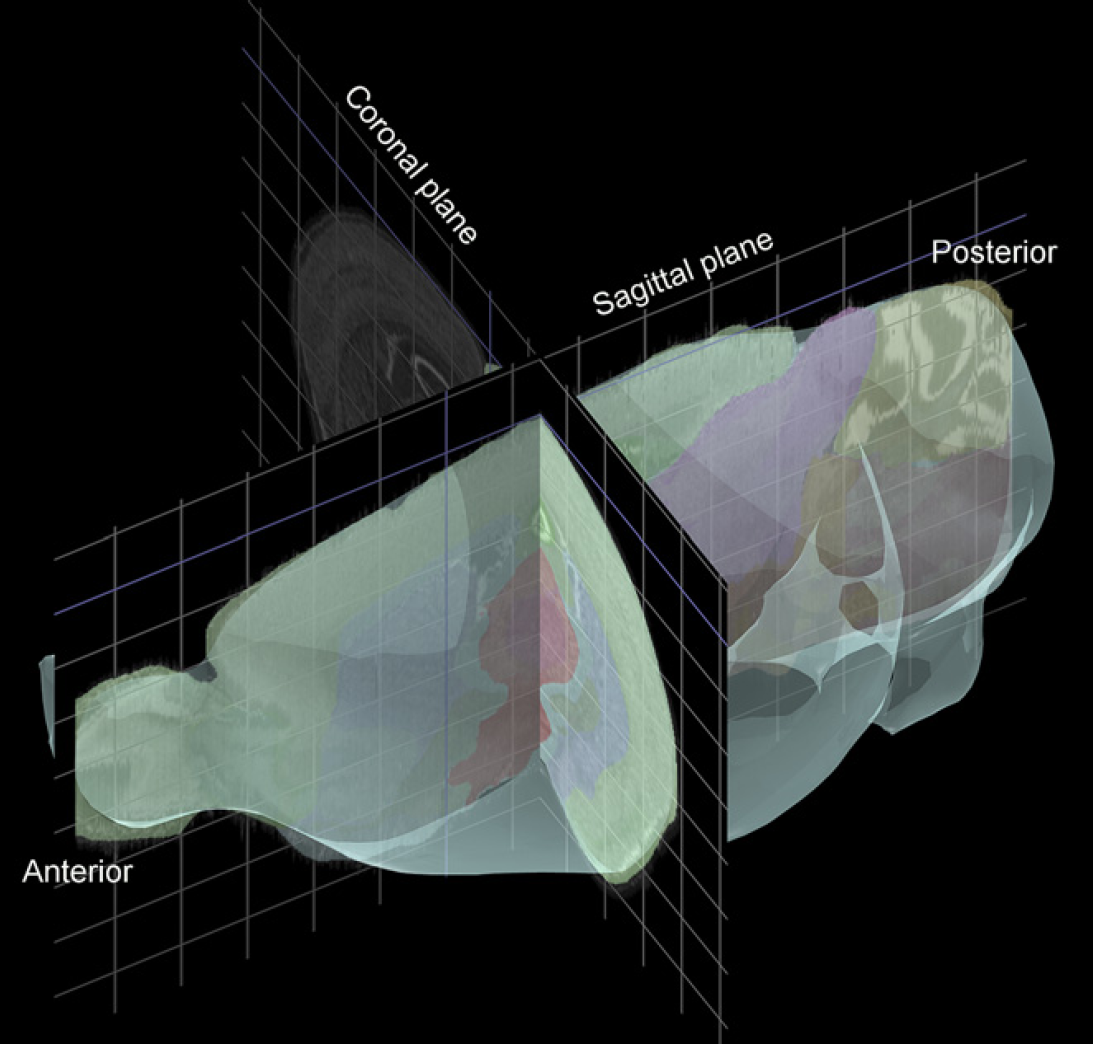
A screenshot image from the Brain Explorer application that can be used to display Allen Brain Atlas (ABA) data in three dimensions. This shot shows the orientation of sagittal and coronal slices through the brain. Brain Explorer may be downloaded for free from the ABA Web site at http://www.brain-map.org.
Slides for the ABA are uniquely barcoded by the manufacturer (Erie Scientific, Portsmouth, NH) 3 with a 10-digit barcode that is tracked by a custom laboratory information management system. An example slide from the project is shown in Figure 2.
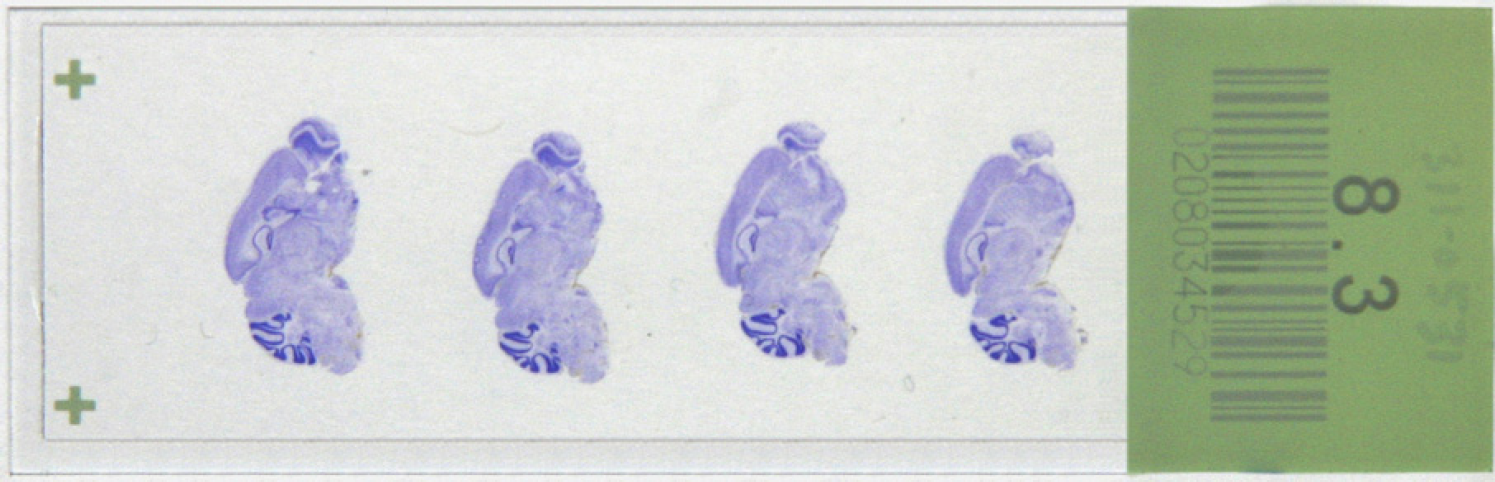
Nissl-stained slide from the Allen Brain Atlas project showing four mouse brain sections that have been cut sagittally. Each of the sections on the slide is separated by 200-μm sample spacing from the brain.
Imaging Requirements
The principal design goal in constructing our image-capture system (ICS) was to use existing technology to maximize slide throughput without sacrificing image quality. The output images of the ICS are used as the raw data source for further automated image-processing algorithms. Image quality must be high enough to provide cellular resolution while keeping data volume to a manageable size. These requirements led to several design decisions critical for efficient image capture for the Atlas.
The system should be fully automated and capable of 24 × 7 operations with minimal operator interaction. Images would be captured using bright-field imaging to maximize speed of capture and minimize data-storage space. Images resolution of the system should be about 1 μm/pixel.
The Atlas project involved imaging of about 1 million mouse brain sections within 3 years, so the ICS had to be fully automated. The majority of the imaging occurred over 1.5 years, requiring that the ICS capture images from about 2500 mouse brain sections per day. The high-throughput nature of the ICS platform generates enormous quantities of raw image data, thus increasing the complexity of the file-handling systems of downstream image processing. 4
Hardware
An ICS unit (see Fig. 3) consists of the following components:
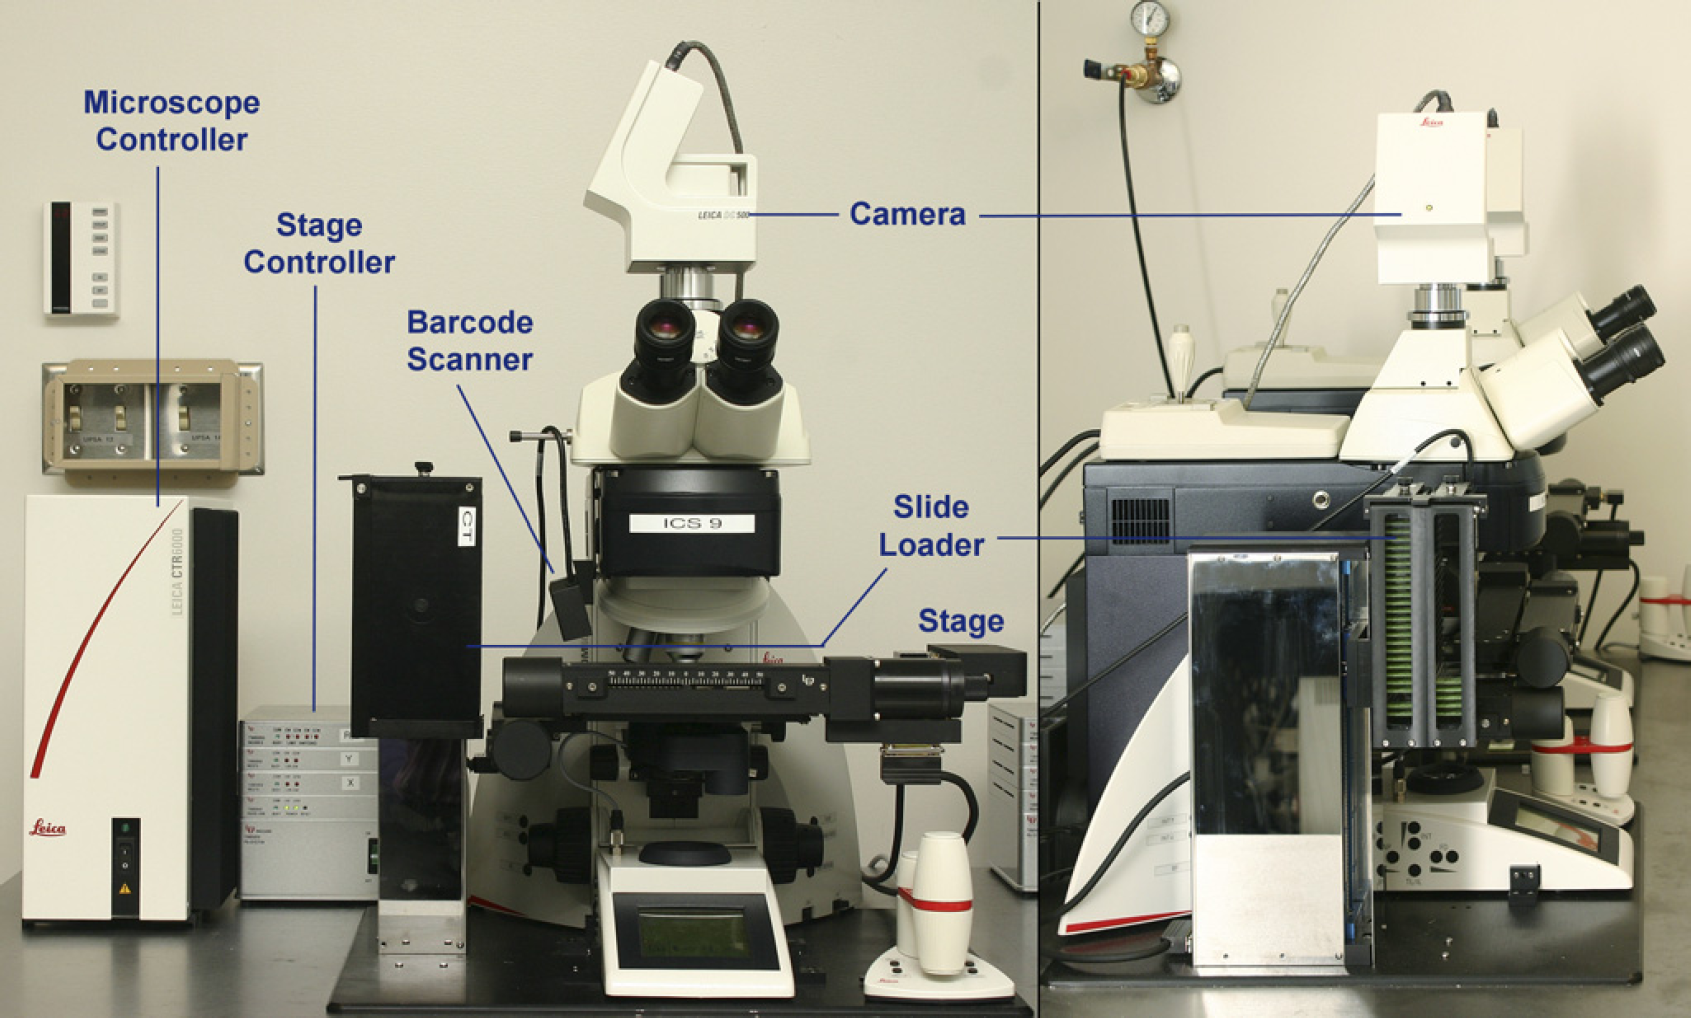
An image-capture system unit, viewed from the front and side.
High resolution images of cISH slides are acquired as a series of 1300× 1030 pixel tiles using bright-field microscopy with a 10× objective lens. 9 ABA images are captured using a 0.63× phototube, yielding a resolution of 1.05 μm/pixel. All images are acquired in 24-bit tagged image file format (TIFF) format and are stitched together and compressed into a JPEG2000 format file by downstream image-processing algorithms.
Scopecontroller Software
Image acquisition is accomplished using two software programs. The main supervisory image-acquisition program is a custom-software package called ScopeController (see Fig. 4) that was written to acquire data for the ABA project. This program is written in Visual Basic and handles all of the high-level system integration and configuration issues. ScopeController also controls the image-acquisition sequence. Lower-level image acquisition is handled by using function calls from ScopeController to the commercial image-processing software package ImagePro Plus. 10
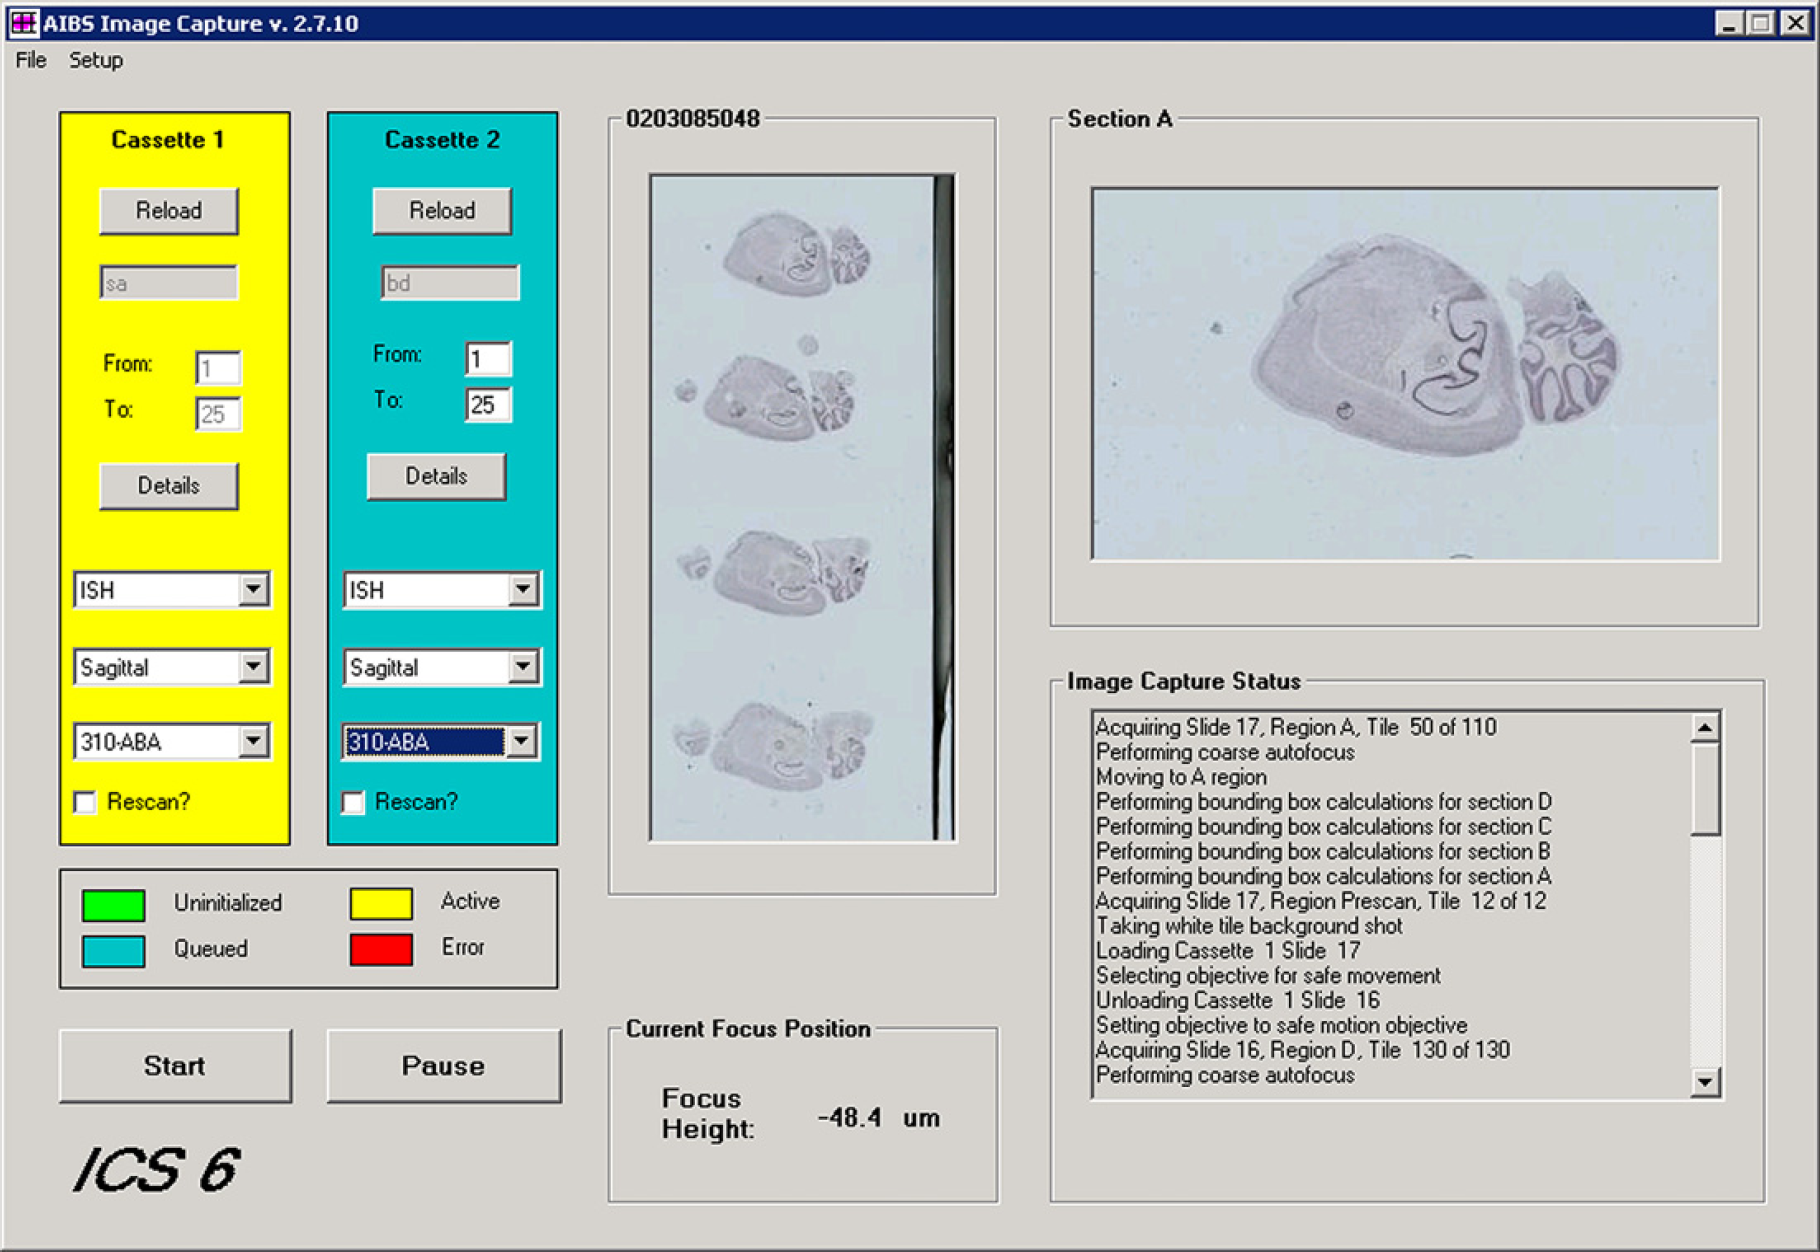
Main form of the ScopeController program. Configuration screens for setting up lens configuration, stage configuration, and image-capture parameters are accessed via menu items.
Before beginning to scan slides, the camera is aligned with the stage and corrected for background illumination and white balance by imaging a blank slide. Independent background correction images are taken for each objective used by the microscope. Background correction is important to avoid image tessellation when stitching images together. A tessellated image is one where the stitch boundaries between adjacent tiles are easily visible. The primary cause of tessellation is a poor background correction for the uneven illumination of the field of view by the light source. Background calibration values are checked twice daily on ICS units, with most systems requiring recalibration at least once per week.
In addition to the camera calibration, the load points for the Ludl stage are also calibrated and entered into the firmware before the automatic scanning begins. The load points for the stage are required to tell the stage motion controller where to pick up or replace slides from the storage cassettes. These points are programmed into the stage controller's firmware using a software program called RunIt supplied by Ludl with the stage's motion-control system.
Automated scanning can begin when the calibration process is complete and slides have been manually loaded into the two cassettes in the slide loader. ScopeController automates the following sequence of events to scan all of the sections on a slide.
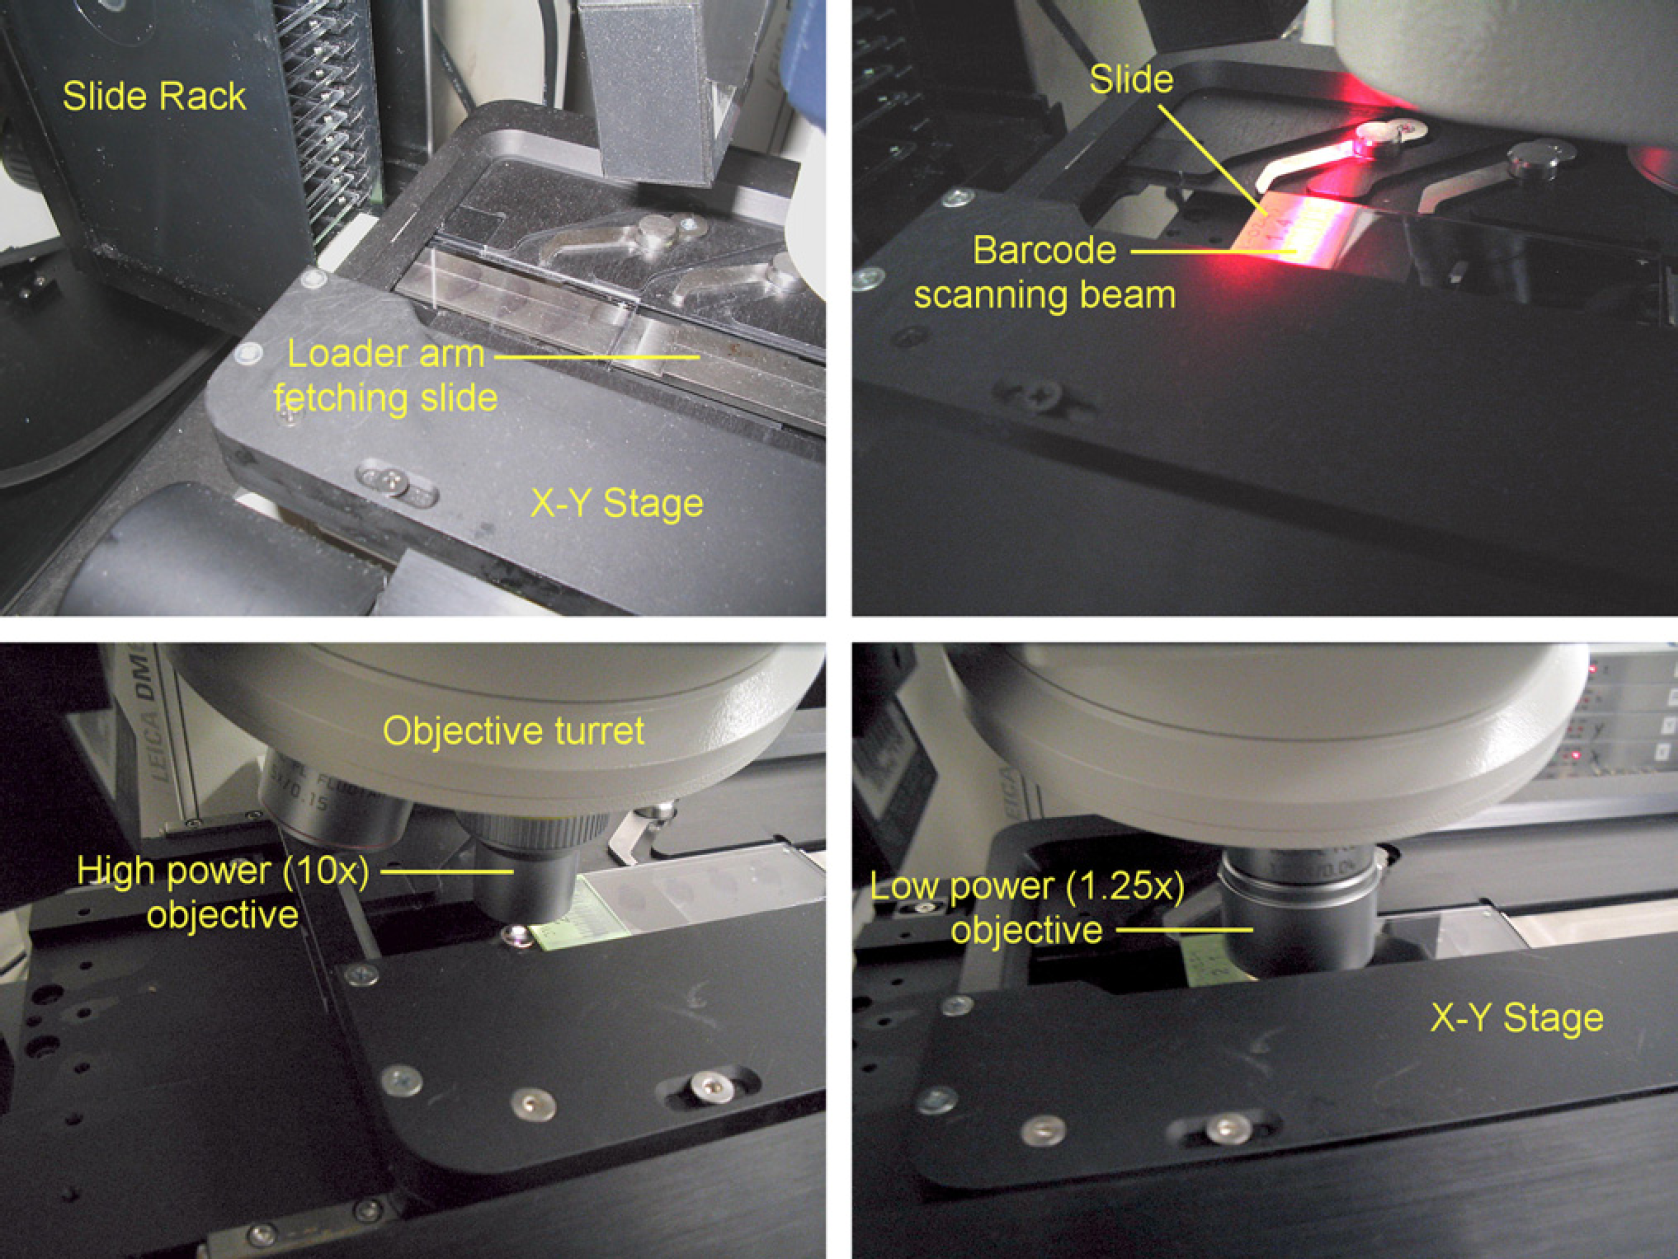
Fetch slide from the cassette (see Fig. 5, top left).
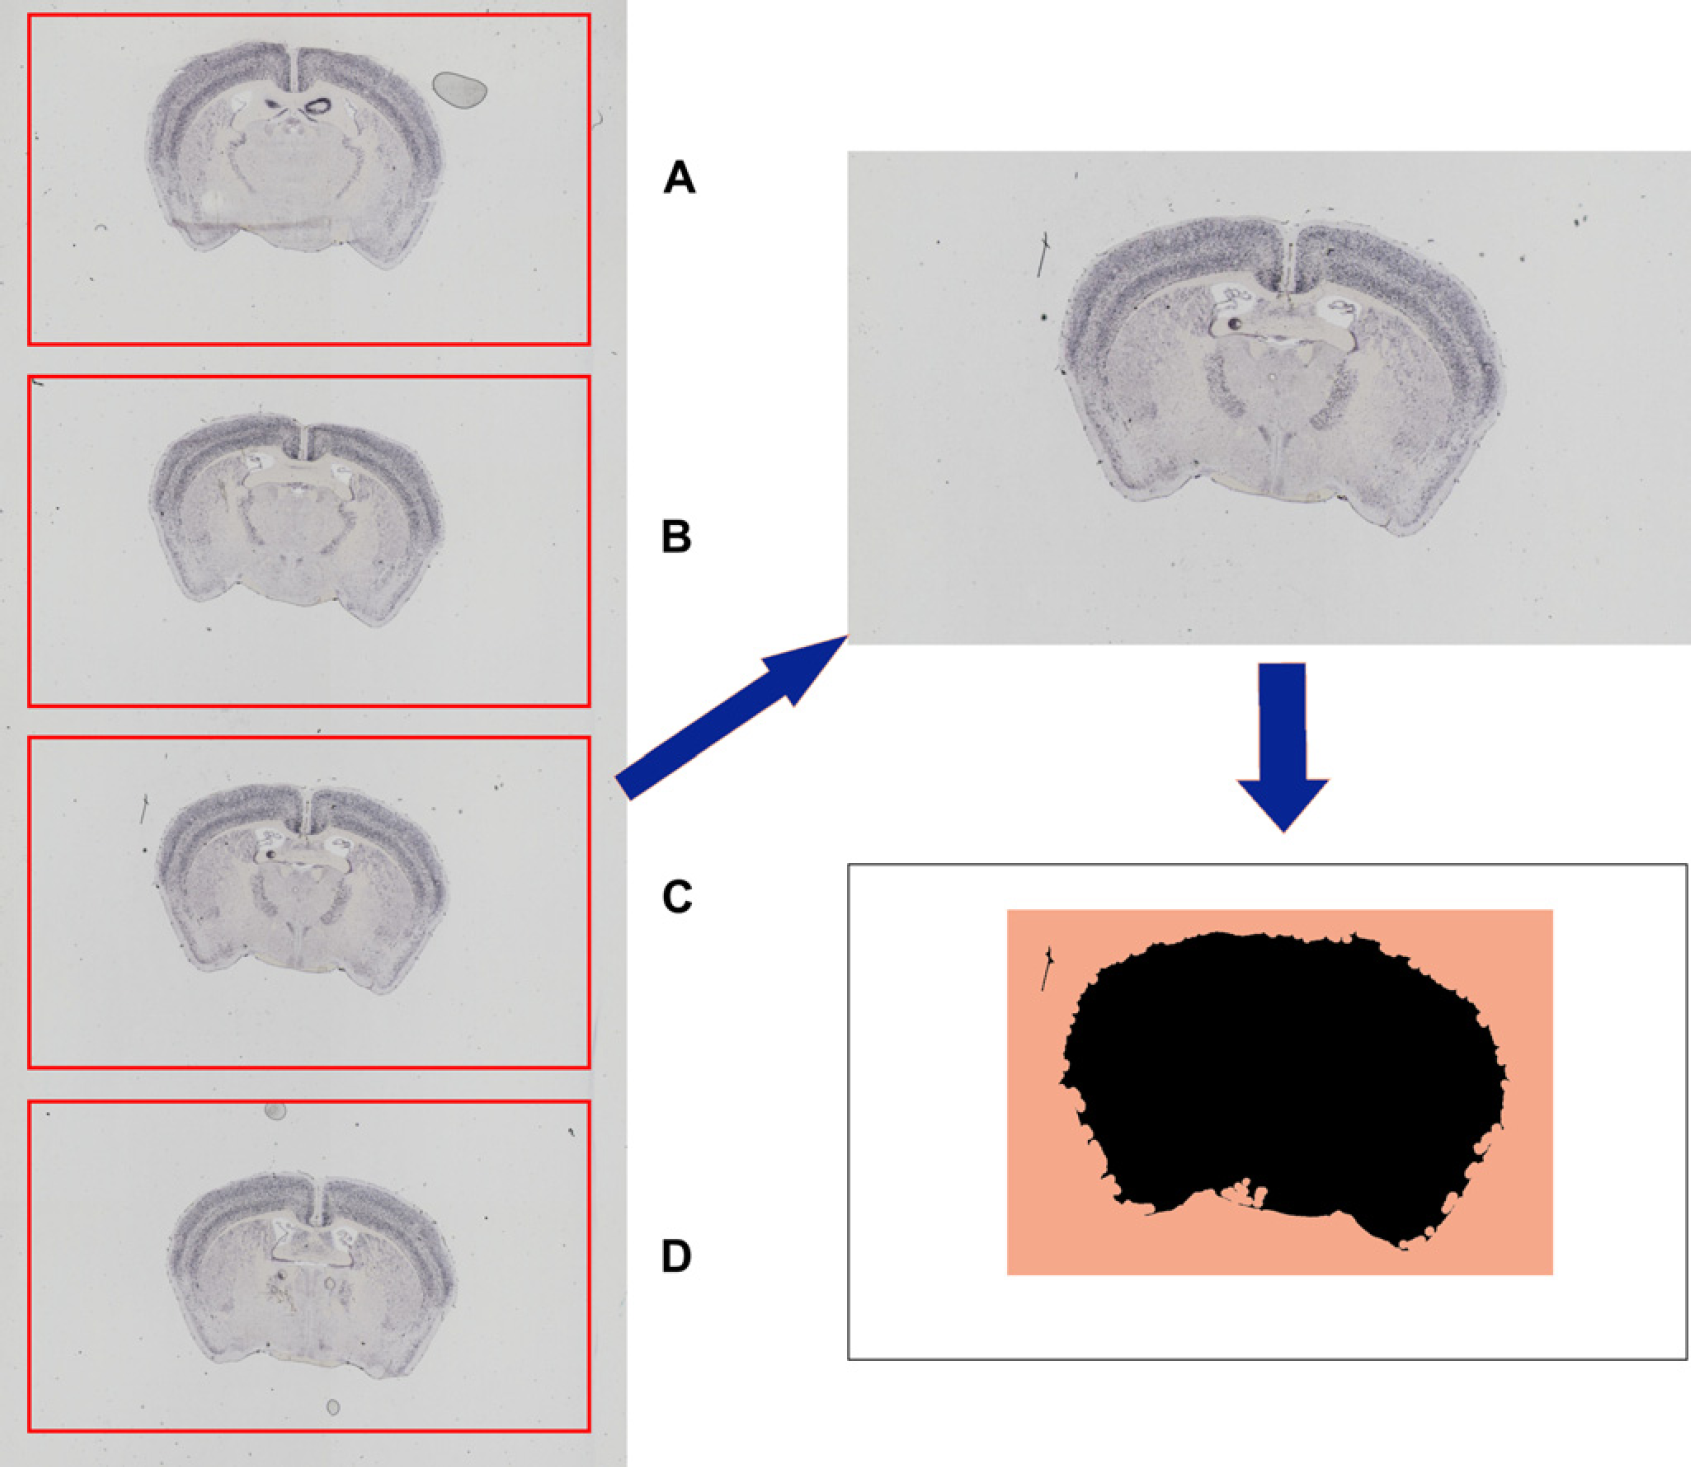
Image-acquisition sequence for acquiring Allen Brain Atlas slides. The image-capture system unit fetches a slide from the cassette (top left) and scans the barcode (top right). To check that the light intensity is still within acceptable levels, the intensity is checked off slide (bottom left) and then imaged with the lower-resolution 1.25× objective (bottom right). Scan the barcode on the slide (see Fig. 5, top right). All image tiles are saved under a directory name that is titled by the slide barcode. Move the objective to an area just off of the slide to do a color, white balance, and background correction check (see Fig. 5, bottom left). If the histogram of the off-slide image falls outside of acceptable values, then the scanning is stopped and an e-mail is sent to an e-mail distribution list to request recalibration of the camera. Using a lower-resolution 1.25× objective, scan the slide (requires 12 image tiles). See Figure 5, bottom right. These tiles are stitched together to provide an image of the slide area. Each section on the slide has been placed into a predefined area by the sectioning staff (see Fig. 6, left). The low-resolution image of the slide is separated into individual scan areas for each section (see Fig. 6, top right).
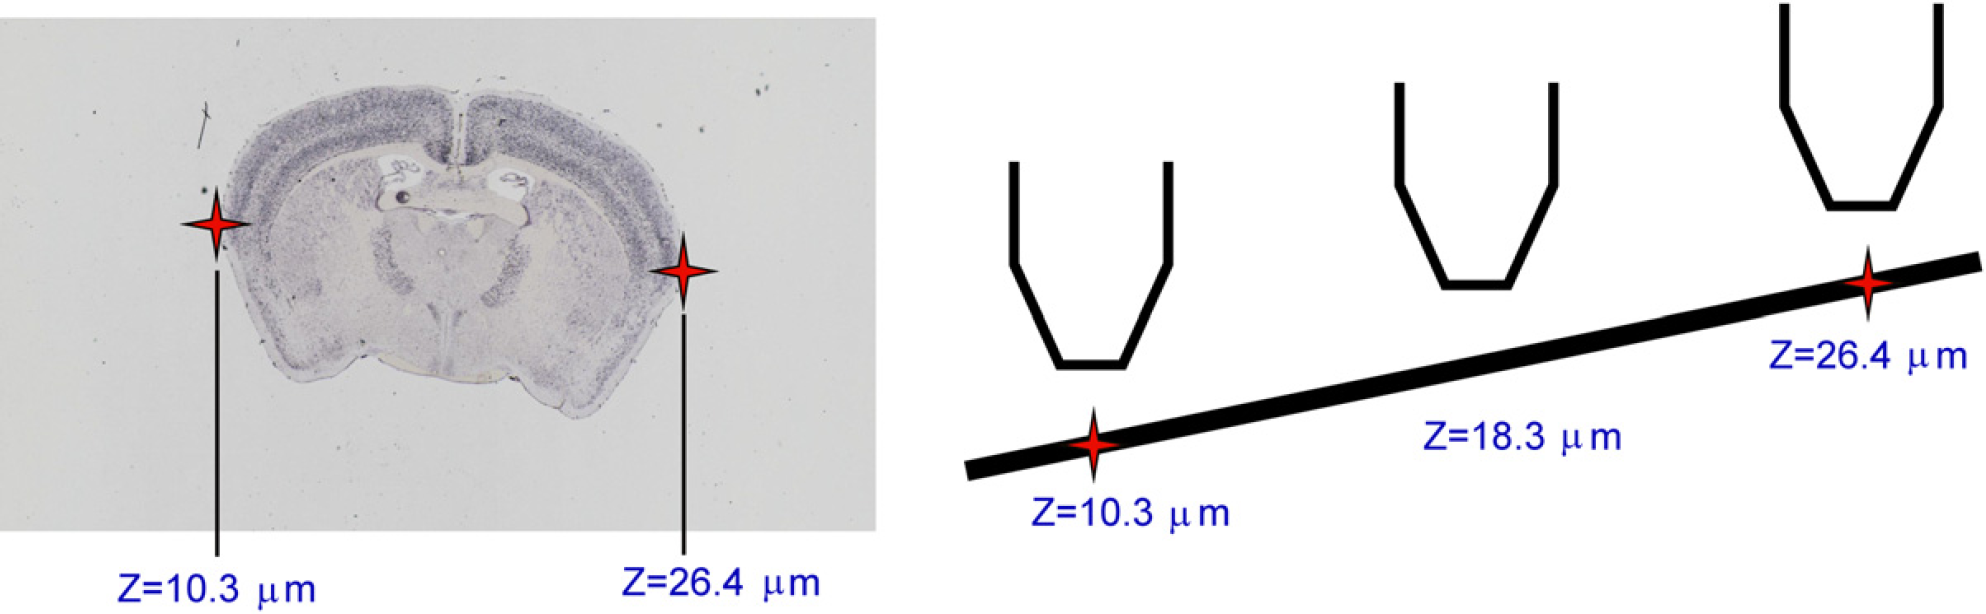
The 12-tile low-resolution image on the left is separated into the four sections where tissue should be placed on the slide, labeled A–D. This area is then subjected to a tissue-masking algorithm to find where the tissue is actually placed in that scan area (shown for Section C in this figure). The black area is the lower right part of the diagram that shows the tissue mask. The image-capture system will scan an area slightly larger than all areas that were identified by the tissue mask (shown by the colored area). The white space that fills the rest of the potential scan area is not imaged because it has no content. This saves both disk space and processing time. Within each scan area, ScopeController creates a tissue mask to identify where within the scan area the actual tissue is placed (see Fig. 6, bottom right). The tissue-mask algorithm uses multiple passes of an 11 × 11 octagonal open-filtering kernel to eliminate small dust particles from being detected as tissue and then detecting dark objects within the prescan image of the section. A bounding box is generated that will encompass the tissue, but will not scan extraneous white-space area with no tissue (shaded region in lower right portion of Fig. 6). The bounding box encompasses all of the area identified in the tissue mask plus an extraborder region of 0.7 mm around each edge of the tissue. ScopeController then switches to the 10× objective and performs an autofocus at the farthest left and farthest right edges of the tissue (see Fig. 7, left). Using these two points, a predicted slope of the correct focus height is generated across the slide (see Fig. 7, right). Experiments were conducted using more autofocus points, but these tests indicated that using two points to generate a focus plane was sufficient for almost all ABA slides. The typical change in focal height across the short tissue axis is less than the 6-μm focal depth of the 10× objective. As each autofocus event takes an additional 30 s, only the two autofocus points are used to maintain higher throughput.
Autofocus points are selected at the farthest left and right edges of the biggest piece of tissue identified by the tissue mask (see Fig. 5). These points serve to calculate the predicted slope of the tissue across the slide. As the raster scan progresses, the focus of the objective is adjusted to maintain this expected slope of the tissue. We found that there was little change in focus height from top to bottom across the small mouse brain tissue, allowing us to eliminate unnecessary additional focus points and increase system throughput. The slide is scanned in a zigzag pattern underneath the objective until all of the required image tiles are taken to image the entire section (∼ 100 typically, 140 tiles max). Scanning proceeds in this manner for all four sections on the slide. Typical imaging time is about 15–20 min/slide (depending on the orientation of the tissue). The total amount of image data per slide is typically about 1.6 GB of image tiles (4 sections × 100 tiles/section × 4 MB/tile). The slide is replaced in the cassette and the process repeats until all slides have been scanned.
System Integration
After scanning, metadata describing the imaging parameters and microscope setup are stored in a text file for each section. This information is stored in a database for later informatics usage. While scanning a slide, image tiles are stored on a local hard drive to maximize acquisition speed. On completion of each slide, all image tiles and the metadata information are automatically copied to a network location where the Informatics Data Pipeline 4 (IDP) software begins the image-analysis process. The IDP software runs a series of software modules that perform stitching, white balancing, registration, expression detection, pattern recognition, and data warehousing before releasing the processed information to the Web site for public viewing.
To allow the ICS to run unattended overnight, ScopeController was designed to recognize problems with the microscope and/or stage and stop processing slides in the event of an error. If a system error is detected, an e-mail message is generated and sent to an e-mail distribution list of staff that can diagnose and fix the problem. Similarly, an e-mail message is sent to staff whenever the slides that were loaded have completed scanning.
Increasing imaging throughput is straightforward due to the design of the ICS as a stand-alone unit. Adding capacity to scan more slides is simply a matter of building up and deploying more ICS units to run in parallel. Ten ICS units, at a cost of approximately $100,000 each, were used to complete the ABA project. Three ICS units can sit on a 3′ × 5′ (90 × 150 cm) vibration isolation table. Each unit in the microscopic laboratory has its own image-acquisition computer, but they share I/O peripherals by using a keyboard/video/mouse switch.
Results
The raw image tiles that are acquired by the ICS are processed using the IDP pipeline software. The raw resolution of the resulting stitched image tiles remains 1.05 μm, allowing images to be zoomed in and displayed at cellular resolution as shown in Figure 8.
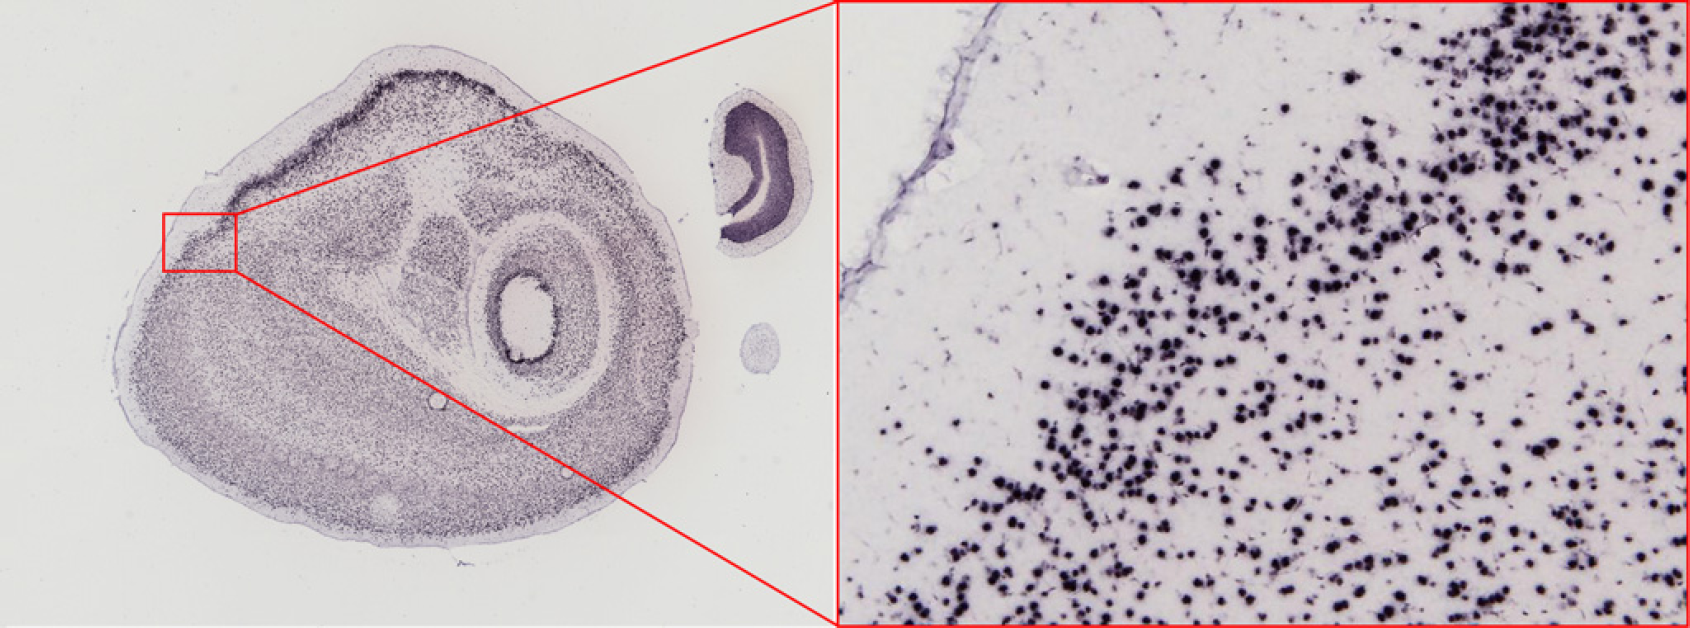
Large scale stitched images from the Allen Brain Atlas can be zoomed in to reveal the cellular resolution images taken by each camera shot.
Processed images are freely available online via the ABA web application, allowing public access to information on gene expression for all genes that have been successfully analyzed. The ABA data can be accessed via the web application shown in Figure 9 at http://www.brain-map.org.
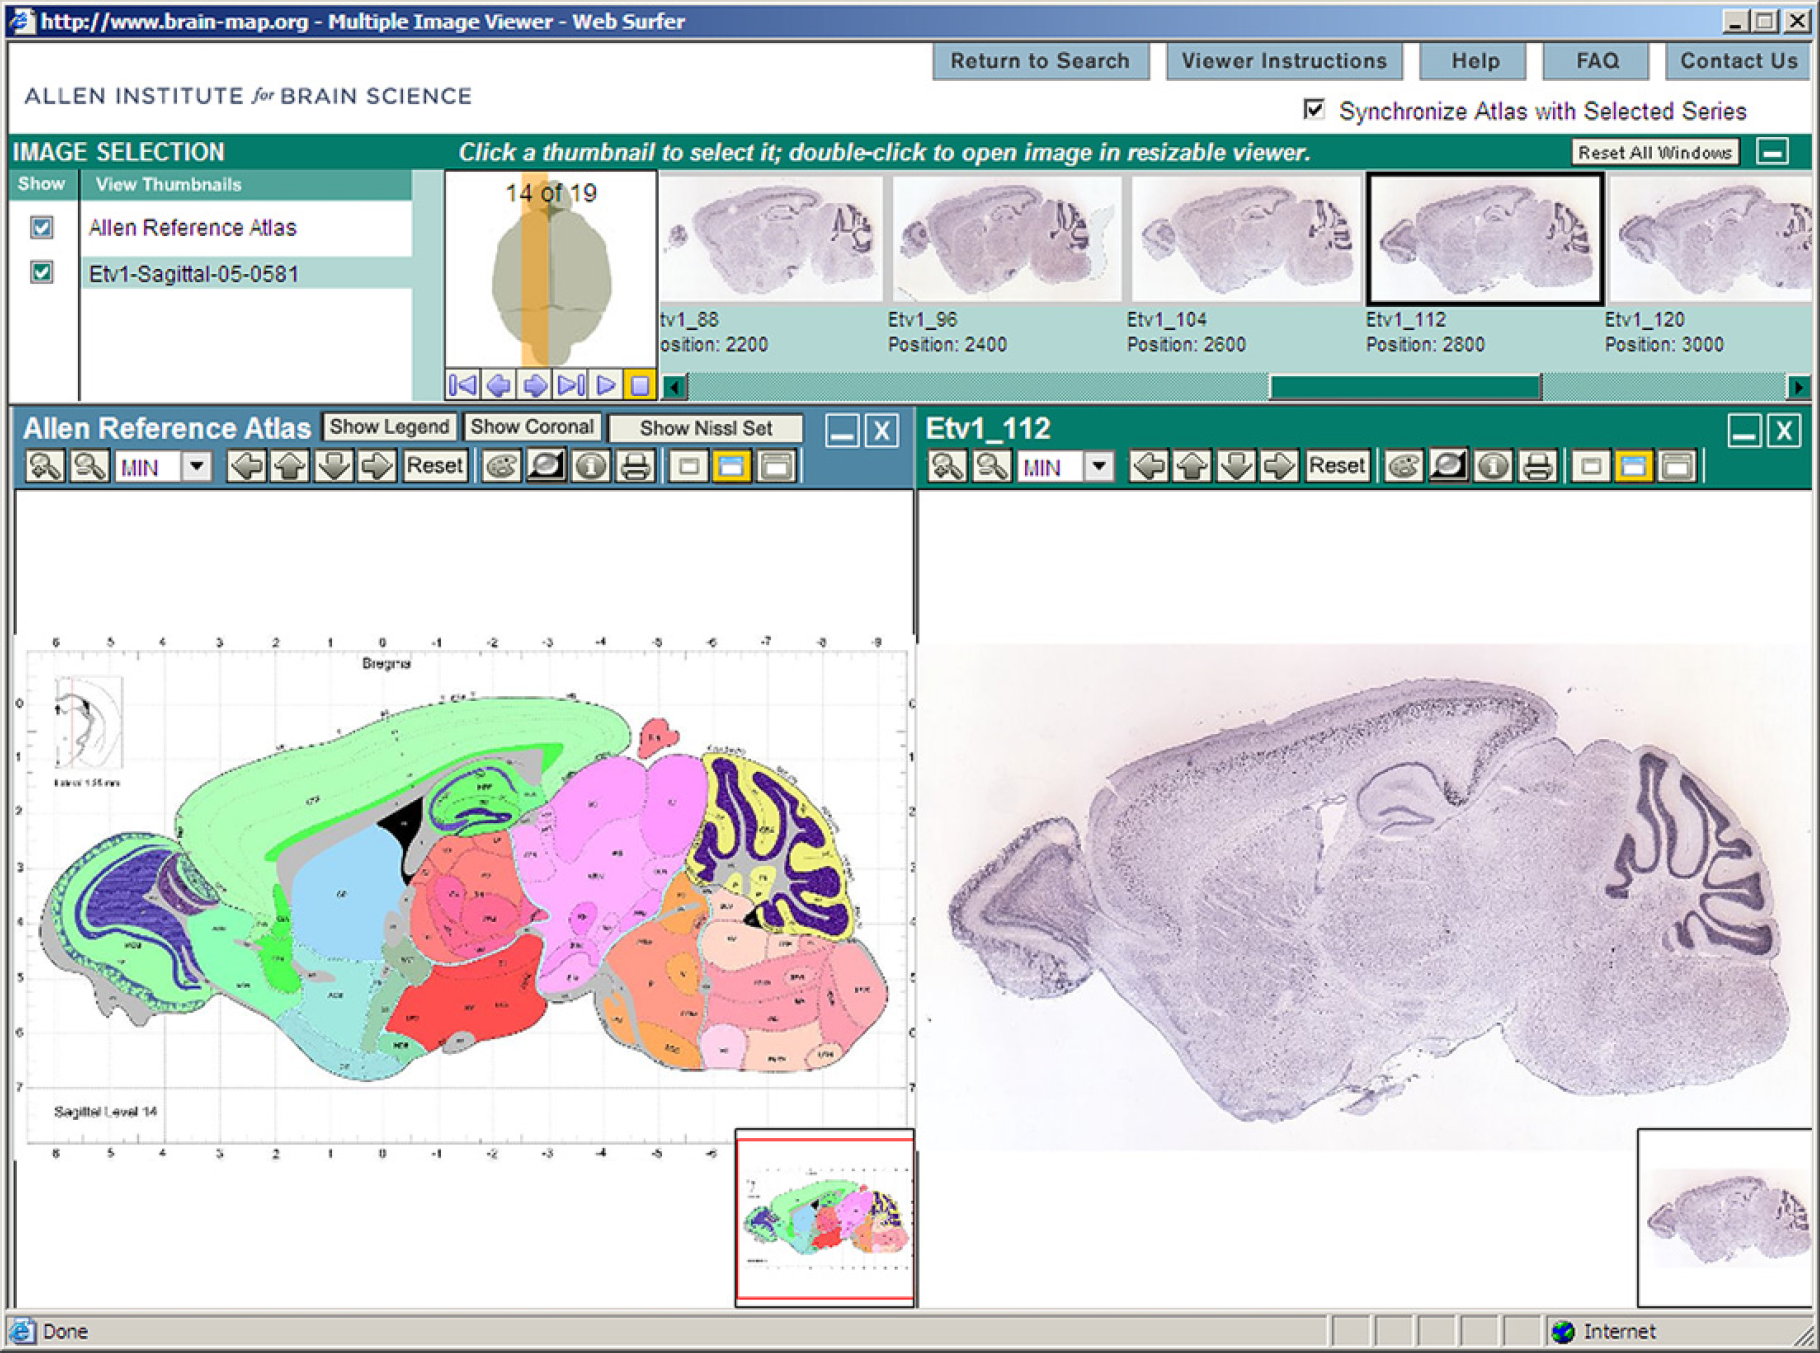
Allen Brain Atlas web application screenshot showing the Allen Reference Atlas on the left panel and one of the colorimetric in situ hybridization images of a brain section labeled for the gene Etv 1.
Discussion
The ICS generates high throughput, fully automated image acquisition. This system has been used to successfully image several hundred thousand slides to build the ABA. Since the completion of the ABA project, the ICS platform has been further developed to scan three color fluorescent in situ hybridization (ISH) and human tissue sections. Future applications include the development of a larger format scanning platform and integration with a spinning-disc confocal microscope.
Acknowledgments
The authors would like to thank the staff at the Allen Institute who have participated in this project, particularly Lon Luong, Leonard Kuan, Carol Thompson, and Chinh Dang. They would also like to thank the Institute Founders Paul G. Allen and Jody Patton, and their Atlas Scientific Advisory Board, without whose support this work would not be possible.