
Abstract
Automated devices and methods for biological sample preparation often use surface functionalized microbeads (superparamagnetic or nonmagnetic) to allow capture, purification, and preconcentration of trace amounts of proteins, cells, or nucleic acids (DNA/RNA) from complex samples. We have developed unique methods and hardware for trapping either magnetic or nonmagnetic functionalized beads that allow samples and reagents to be efficiently perfused over a microcolumn of beads. This approach yields enhanced mass transport and up to fivefold improvements in assay sensitivity or speed, dramatically improving assay capability relative to assays conducted in more traditional “batch modes” (i.e., in tubes or microplate wells). Summary results are given that highlight the analytical performance improvements obtained for automated microbead processing systems using novel microbead trap/flow-cells for various applications including (1) simultaneous capture of multiple cytokines using an antibody-coupled polystyrene bead assay with subsequent flow cytometry detection; (2) capture of nucleic acids using oligonucleotide-coupled polystyrene beads with flow cytometry detection; and (3) capture of Escherichia coli 0157:H7 from 50-mL sample volumes using antibody-coupled superparamagnetic microbeads with subsequent culturing to assess capture efficiency.
Introduction
Complex samples present a number of challenges for the trace detection of target biomolecules. The presence of potentially interfering material in environmental, manufacturing (e.g., food processing), and clinical samples can vary widely and may lead to false positives, false negatives, or reduced accuracy and sensitivity of biological assays. The use of surface functionalized microbeads has been widely used in bioassays for whole cells, 1 , 2 nucleic acids, 3 and proteins. 4 –6
Although bead-based approaches have provided some purification and concentration capability, they are generally done in a “batch” mode and suffer from being diffusion limited. A novel approach described here uses a microcolumn of beads through which samples, reagents, and wash solutions can be perfused. 7 –9 This approach results in enhanced mass transport leading to improved capture efficiencies for whole cells and proteins and improved hybridization efficiency for nucleic acids. With this enhancement, assays can be performed in significantly less time or with improved sensitivity. These microcolumns of beads or particles can be automatically packed and released within the fluidics system, providing fresh solid-phase reagents for each sample and assay. 10 For all assays presented here, each sample was processed using a freshly packed column of beads. No attempt was made to regenerate or reuse microbead columns. Each column of beads was stable in the presence of all analytical reagents used including buffers, dye, and air. Heating beads to temperatures required for hybridization (40–42 °C) had no deleterious effects.
Experimental
Automated Fluidics System
The automated fluidics system is illustrated in Figure 1. It consists of a multiposition selection valve (Valco Instruments Co. Inc., Houston, TX), a digital syringe pump (Tecan, San Jose, CA), and a microbead trap/flow-cell fabricated in-house from Teflon. 11 , 12 Details of the microbead trap/flow-cell are shown in Figure 2a and a picture is shown in Figure 2b. The internal diameter of the microbead trap/flow-cell was 1 mm. Teflon tubing with 0.7 mm inside diameter (1 mm outside diameter) was used for all liquid connections.
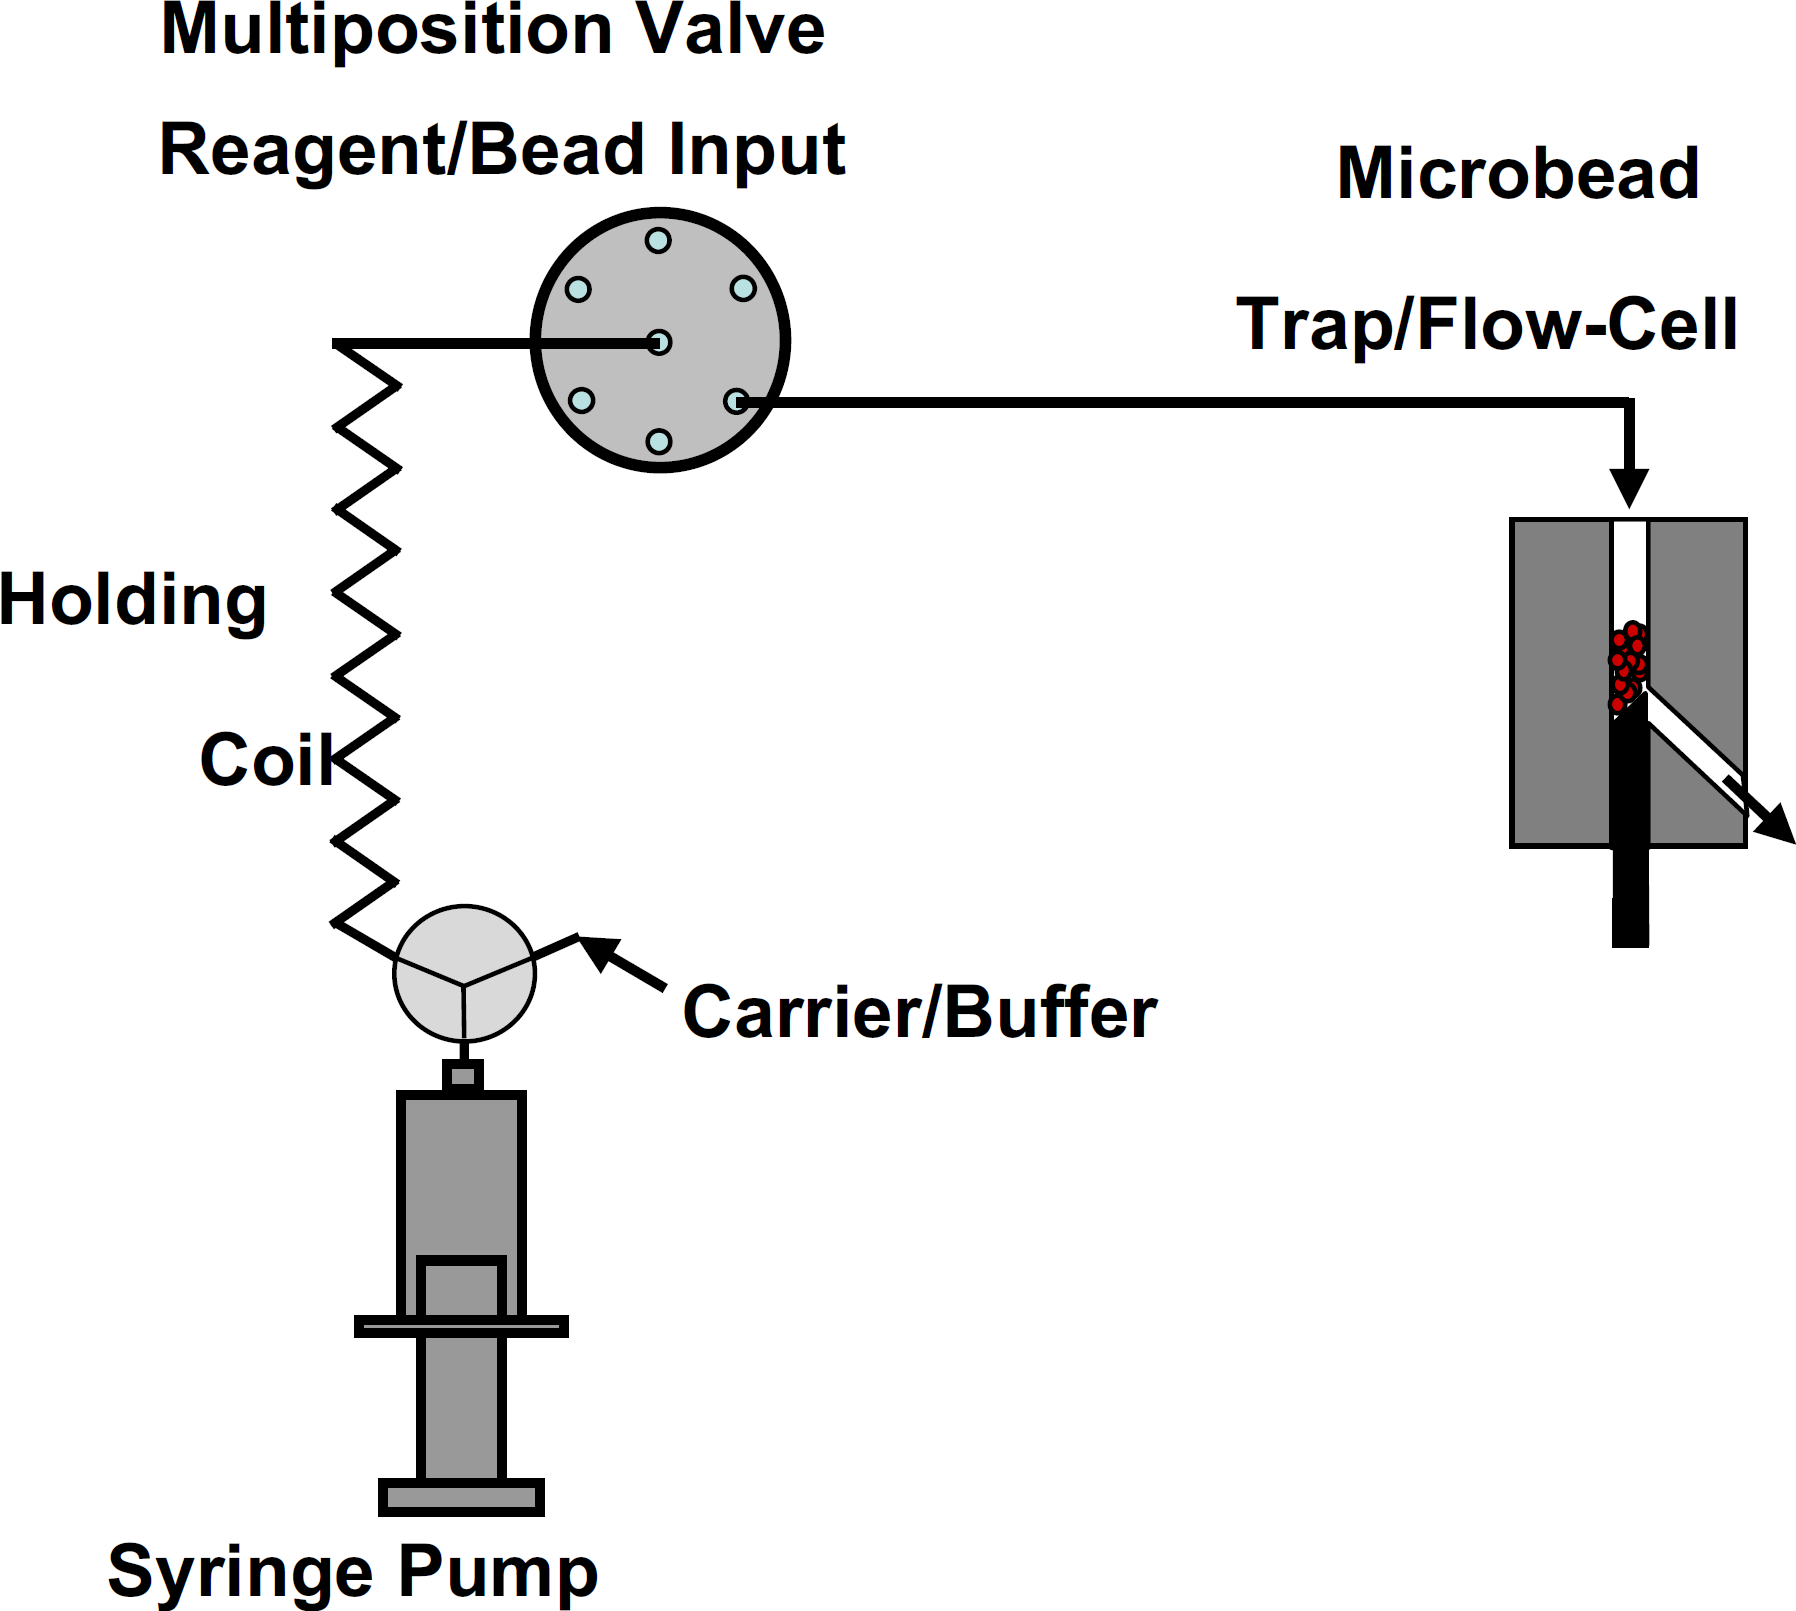
Automated fluidics system used for liquid and microbead suspension handling. A digital syringe pump aspirates solutions through the multiposition valve into the holding coil. Solutions are then dispensed to the microbead trap/flow-cell. A three-way valve attached to the syringe pump allows carrier solution to completely flush any residual solutions out of the holding coil, valve inlet/outlet lines, and flow-cell between samples analysis.
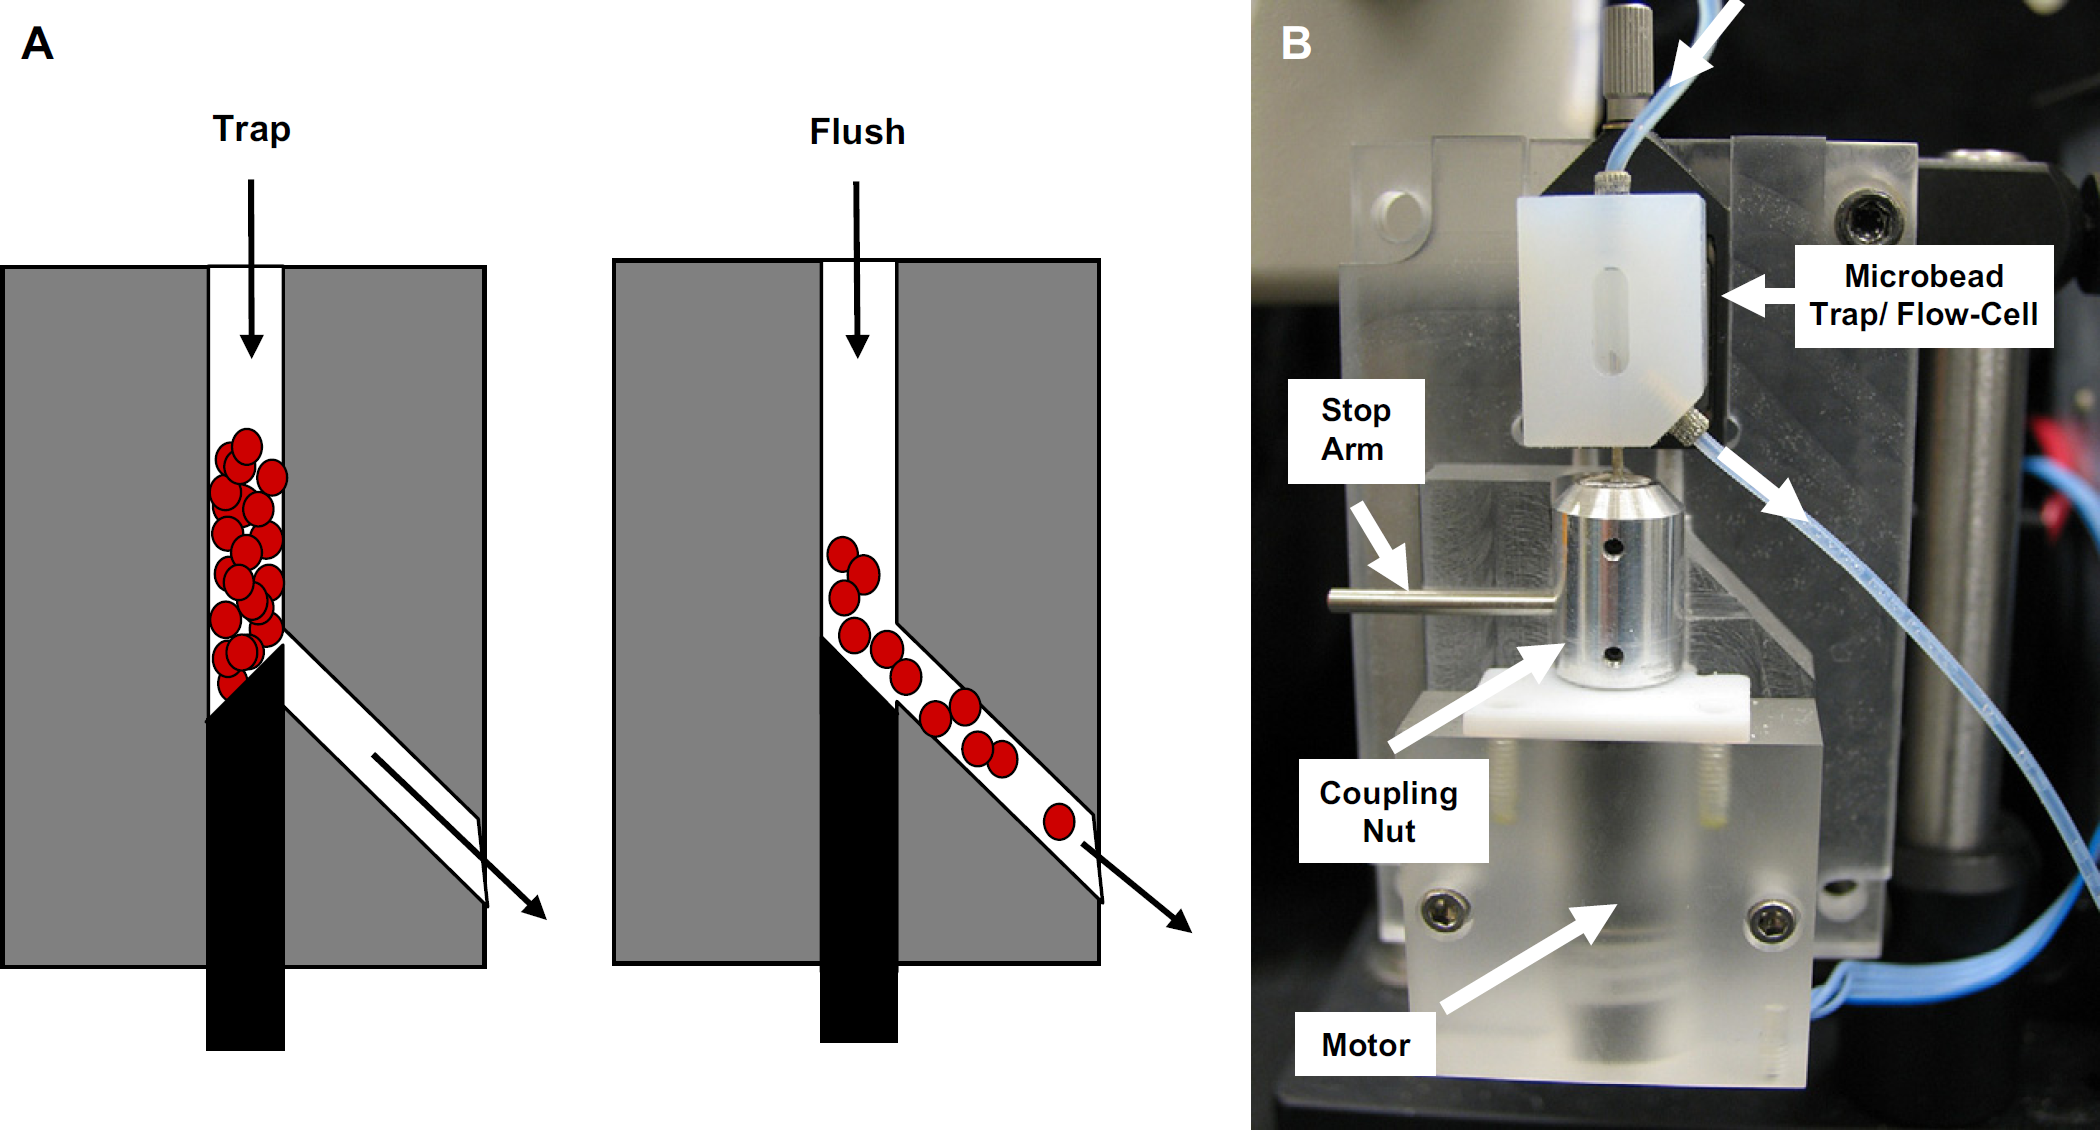
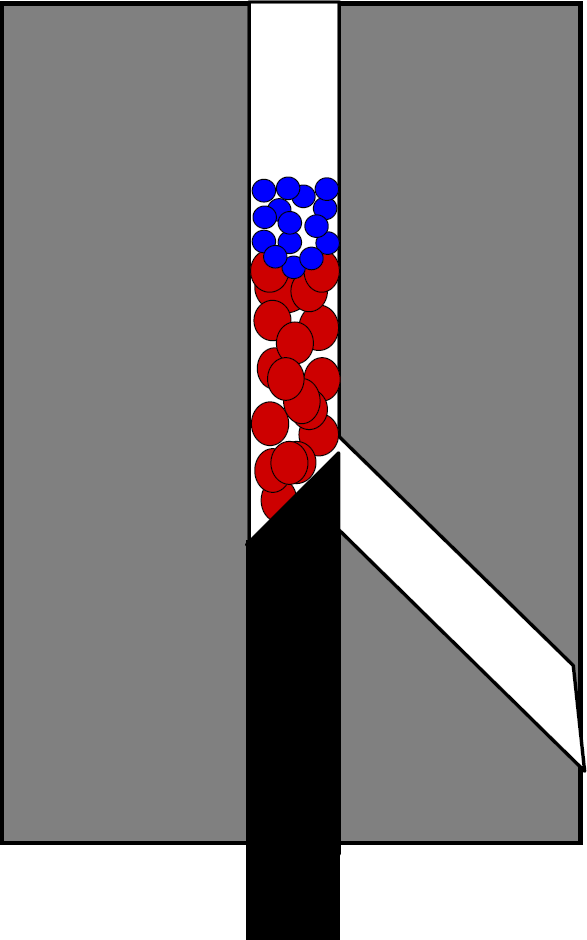
(A) The microbead trap/flow-cell. In the “Trap” position, beads are captured above a beveled rod (shown in black), while sample, reagent, and wash solutions can still pass. In the “Flush” position, the beveled rod is rotated 180° and the beads are flushed and collected for further analysis (e.g., flow cytometry) or for culturing captured whole cells on agar plates. (B) A picture of the microbead trap/flow-cell in the “flush” position. Samples, reagents, and beads are introduced from the 0.7 mm i.d. tube at the top of the microbead trap/flow-cell and exit through the tube at the bottom. A motor is connected to the beveled rod via a coupling nut. The coupling nut has a stop arm, which is used to define trap and flush positions when the beveled rod is rotated 180° by the motor. The entire assembly is 9 cm high × 6 cm wide × 3 cm deep. The Teflon microbead trap/flow-cell is 22 mm high × 16 mm wide × 13 mm deep.
Multiplexed Cytokine Sandwich Immunoassay with Flow Cytometry Detection
Antibody-coupled flow cytometry beads, phycoerythrin (PE)-coupled detection antibody reagent, wash buffer, diluent, and standards were provided by BD Biosciences (San Jose, CA) as BD Cytometric Bead Array kits. Polystyrene beads (18.97 μM diameter, Bangs Laboratories, Fishers, IN) were used to retain the smaller (7.6 μM diameter) antibody-coupled flow cytometry beads in the microparticle trap/flow-cell. Analyte standards used for comparing microfuge tube benchtop batch assays with the Pacific Northwest National Laboratory automated fluidics microbead trap/flow-cell approach were human Th1/Th2 cytokines interleukin (IL)-4, IL-5, and IL-10. Analyte standards used to show the improvement in sensitivity when using larger sample volumes were human chemokines IL-8, RANTES (a member of the IL-8 family of cytokines and also known as CCL5), Monokine Chemoattractant Protein-1 (MCP-1; also known as CCL2), human Macrophage Inflammatory Protein (MIP)-lα (also known as CCL3), and MIP-1β (also known as CCL4). All standards were supplied as freeze-dried pellets and were made fresh daily by serial dilution in diluent solution.
Benchtop batch assays were performed in 1.5 mL low-retention microfuge tubes purchased from Fisher Scientific (Pittsburg, PA). Both automated fluidics and benchtop assays were conducted at room temperature (∼18–21 °C) in the dark. Benchtop assays were performed by conducting the following steps within a microfuge tube (in the order stated): (1) add 10 μL of each type of antibody-coupled flow cytometry bead, (2) add 10 μL of each standard analyte, (3) add 50 μL of PE detection reagent and incubate mixture at room temperature, (4) wash with wash buffer, centrifuge, and decant, and (5) resuspend beads in wash buffer and measure on cytometer.
A sequential injection fluidics system such as that shown in Figure 1 was used for all automated sandwich immunoassays. A “mixed bed” microbead packing approach 11 was used as shown in Figure 3. A protocol flow diagram of the automated fluidics sandwich immunoassay procedure is shown in Figure 4.
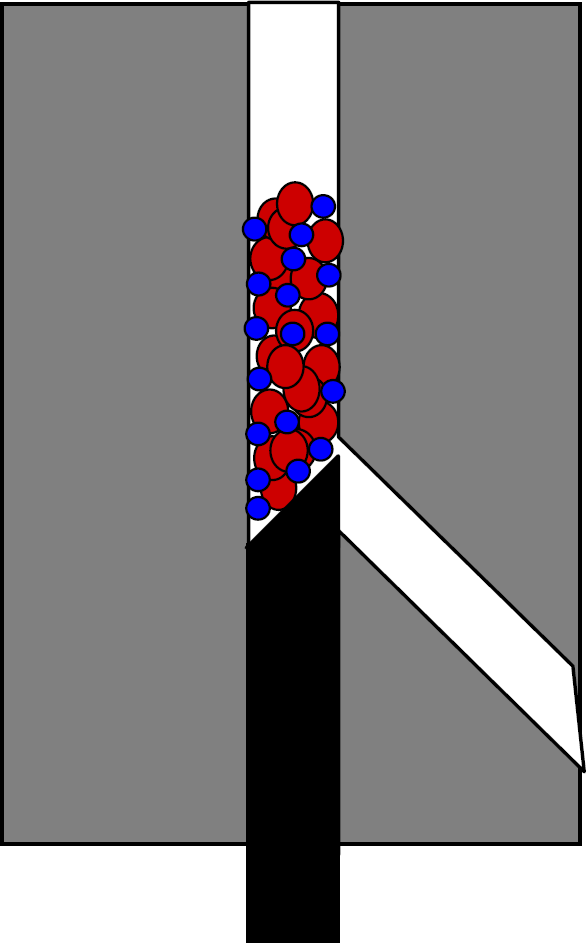
For automated fluidics-based multiplexed cytokine sandwich immunoassays, a “Mixed bed” bead packing strategy was used. Because the “leaky tolerance” for the beveled rod is on the order of the size of the antibody-coupled flow cytometry beads, larger (18.97μm diameter) plain polystyrene beads are used to retain the smaller beads.
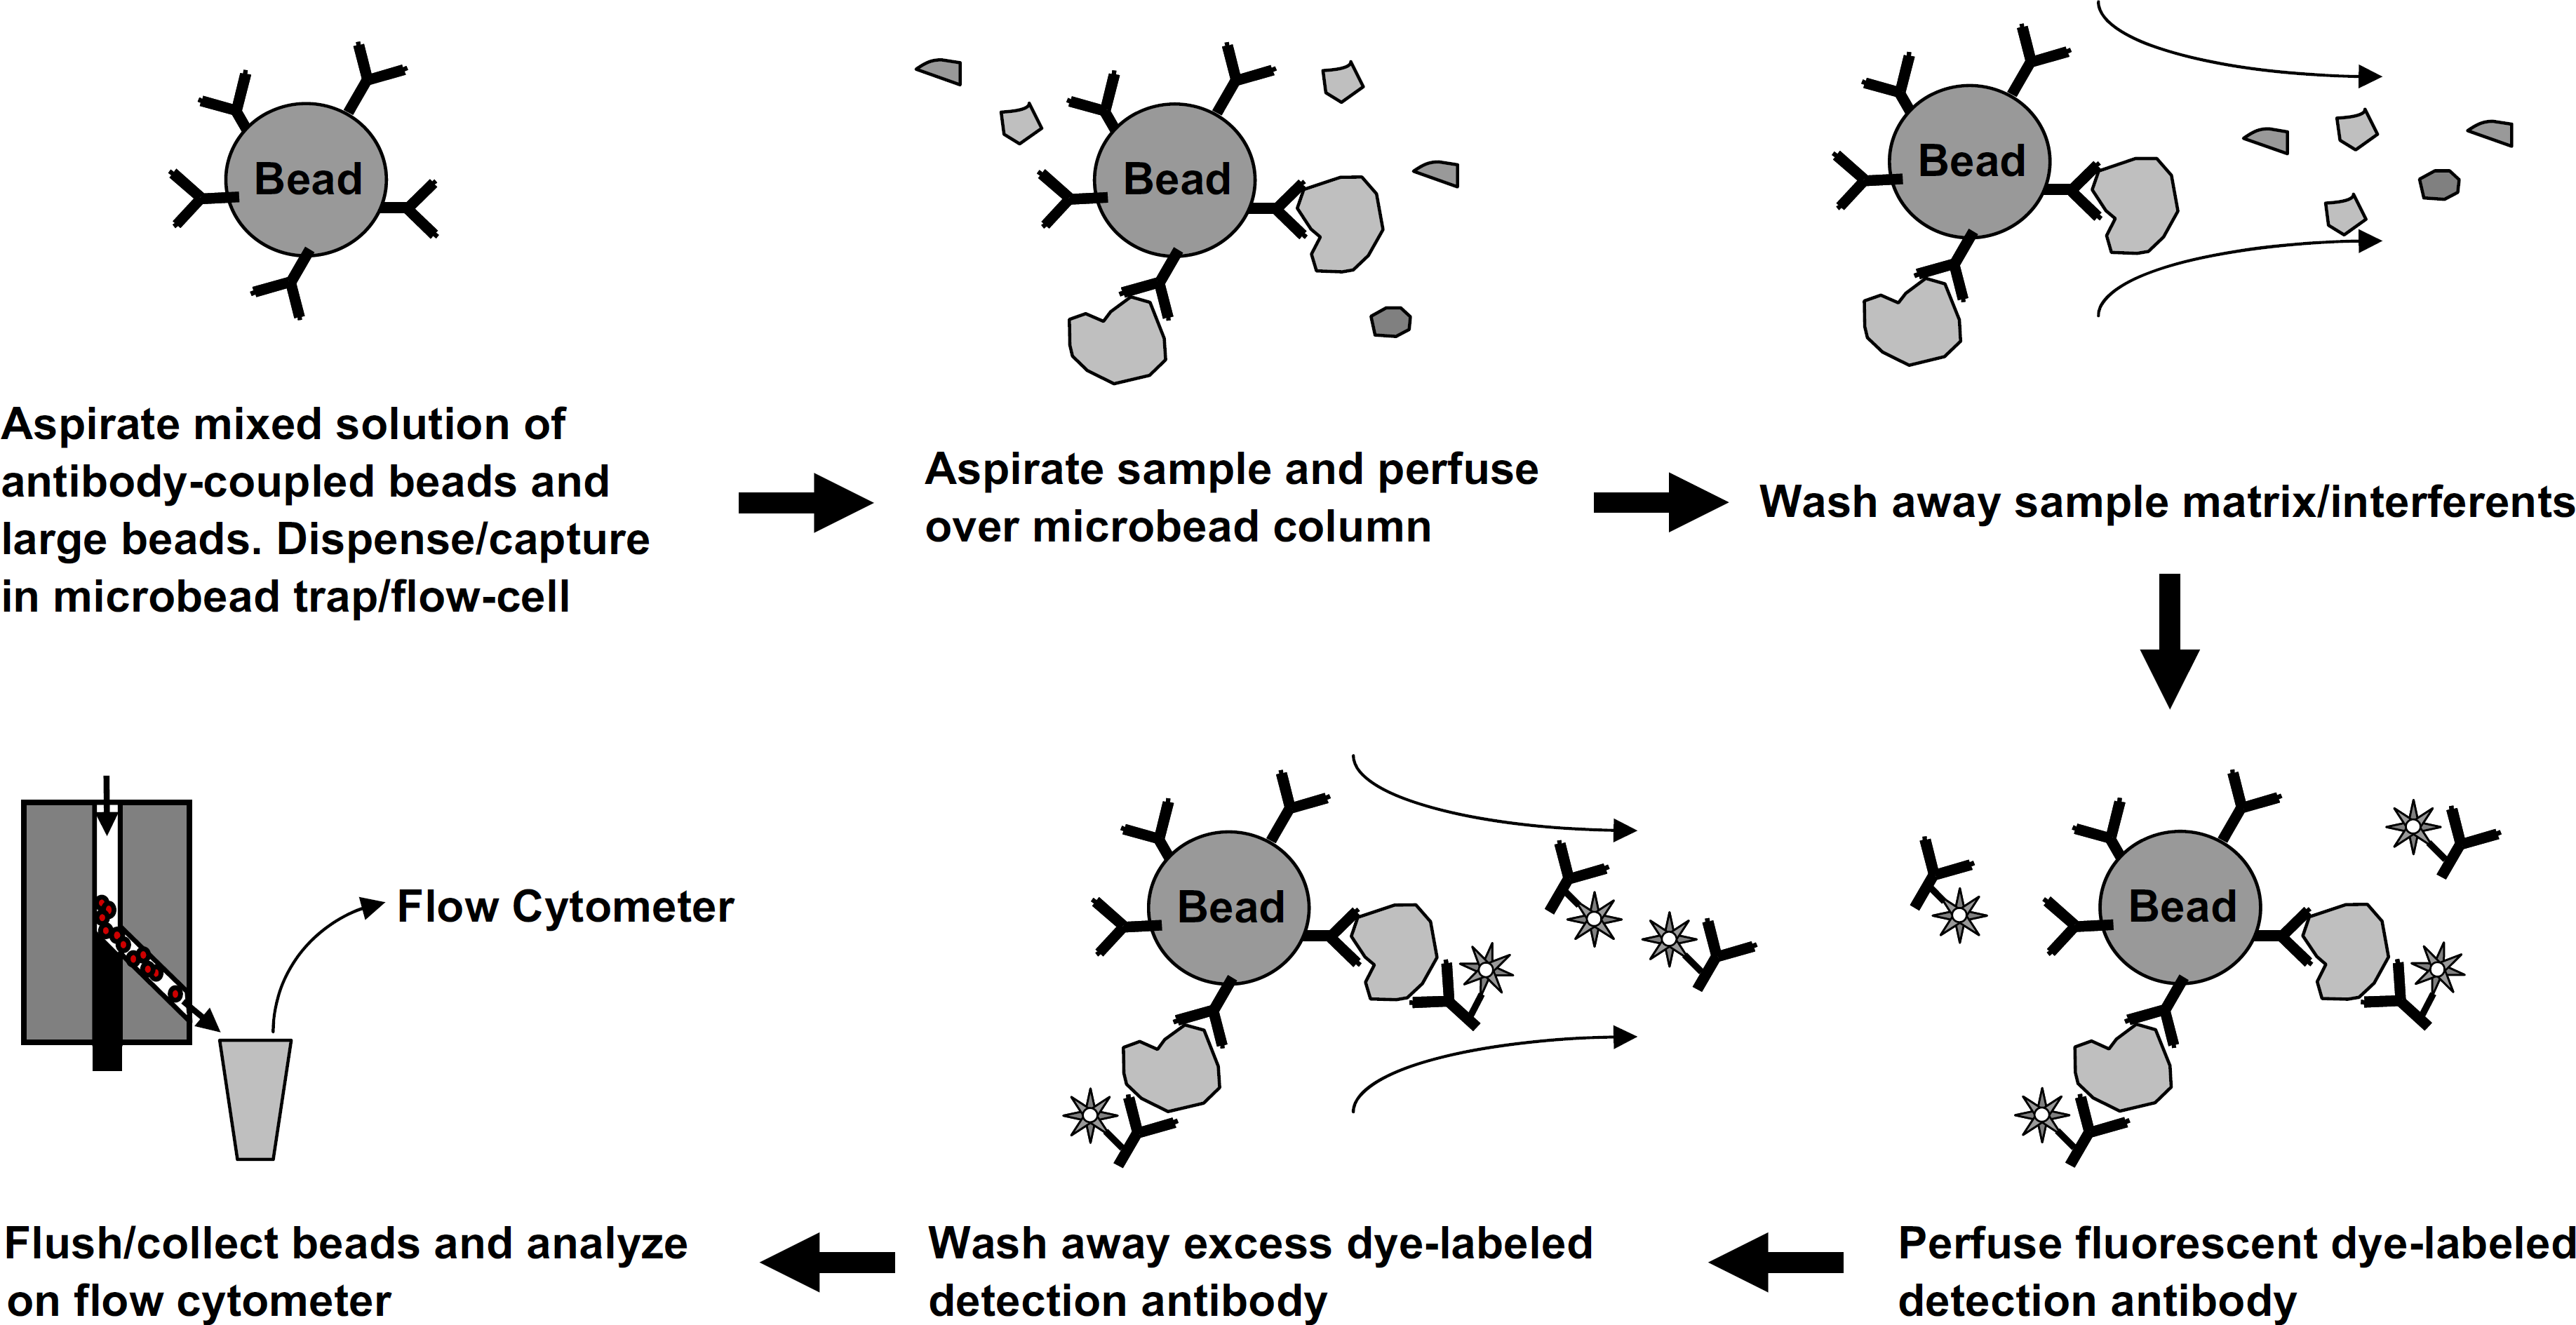
A graphical summary of the automated fluidics protocol for sandwich immunoassays. Each microbead column contained approximately 5000 of each type of antibody-coupled microbeads. The microbead trap/flow-cell enables sample matrix and excess fluorescent dye-labeled detection antibody to be efficiently washed away.
Nucleic Acid Hybridization with Flow Cytometry Detection
Oligonucleotide probes were obtained from Integrated DNA Technologies (Coralville, IA). The “uidA1” probe (CAACCCGTGAAATCAAAAAACTC GACGGCCTGT GGGCATT) is complementary to the uidA1 gene in Escherichia coli (E. coli). Bangs QuantumPlex 5.5 μm carboxyl microbeads were obtained from Bangs Laboratories, Inc. (Fishers, IN), and the oligonucleotide probe was coupled to the beads using standard EDC/NHS chemistry. Genomic DNA was extracted from Salmonella typhimurium (ATCC# 14028) and E. coli (ATCC# 43894) cell culture, which was obtained from the American Type Culture Collection (ATCC, Manassas, VA), using a Qiagen DNeasy Tissue Kit (Cat# 69506, Qiagen, Valencia, CA) and eluted with nuclease free water. Primers were HPLC purified and the forward primer labeled with a 5′ Alexa 488 molecule.
For each hybridization reaction, 10,000 beads were washed with 4X SSC, 0.04% Tween-20 buffer (Sigma-Aldrich, St. Louis, MO), and resuspended in 125 μL of the same. One microliter of 1 μg/μL salmon sperm DNA was added to reduce nonspecific binding; 100 ng of denatured PCR target was added (target was heated to 95 °C for 2.5 min and snap chilled). The final hybridization volume was 51 μL. Samples were incubated for 30 min in a water bath at 42 °C. The beads were washed with 200 μL of 2X SSC, 0.02% Tween-20, and 0.5% Sarkosyl; a second time with 200 μL of 0.5X SSC, 0.005% Tween-20, and 0.125% Sarkosyl; and resuspended in 400 μL of 0.5X SSC, 0.005% Tween-20, and 0.125% Sarkosyl for analysis on the flow cytometer.
A fluidics system such as that shown in Figure 1 was used for all nucleic acid hybridization automated assays. A “top-layered” microbead packing approach 11 was used as shown in Figure 5. A volume of 130 μL of 0.5 mg beads/mL 0.01% Triton X-100 of 18.97-μm polystyrene packing/capture beads (obtained from Bangs Laboratories Inc., Fishers, IN) was packed into a column. A volume of 21 μL of the 5.5 μm oligo-coupled beads (10,000 beads) was packed on top of the larger beads. 100 microliters of 2X SSC, 0.02% Tween-20 wash buffer was then perfused through the microbead trap/flow-cell; 51 μL of hybridization buffer (2X SSC, 0.02% Tween-20) and 100 ng PCR product was perfused through the column in 1 μL intervals with total perfusion time equivalent to the desired hybridization time. During perfusion, the temperature of the cell was 40–42 °C. The column was then washed with 100 μL of 2X SSC, 0.02% Tween-20, and 0.5% Sarkosyl; and a second time with 100 μL of 0.5X SSC, 0.005% Tween-20, and 0.125% Sarkosyl. Beads were briefly back-aspirated out of the column, the rod was rotated, and the beads were eluted using 400 μL of 0.5X SSC, 0.005% Tween-20, and 0.125% Sarkosyl, and collected in a vial for analysis on the flow cytometer. A protocol flow diagram of the automated fluidics hybridization procedure is shown in Figure 6.
For automated nucleic acid hybridization, a “Top-Layered bed” bead packing strategy was used. Because the “leaky tolerance” for the beveled rod is on the order of the size of the antibody-coupled flow cytometry beads, larger (18.97 μm diameter) plain polystyrene beads are used to retain the smaller beads.
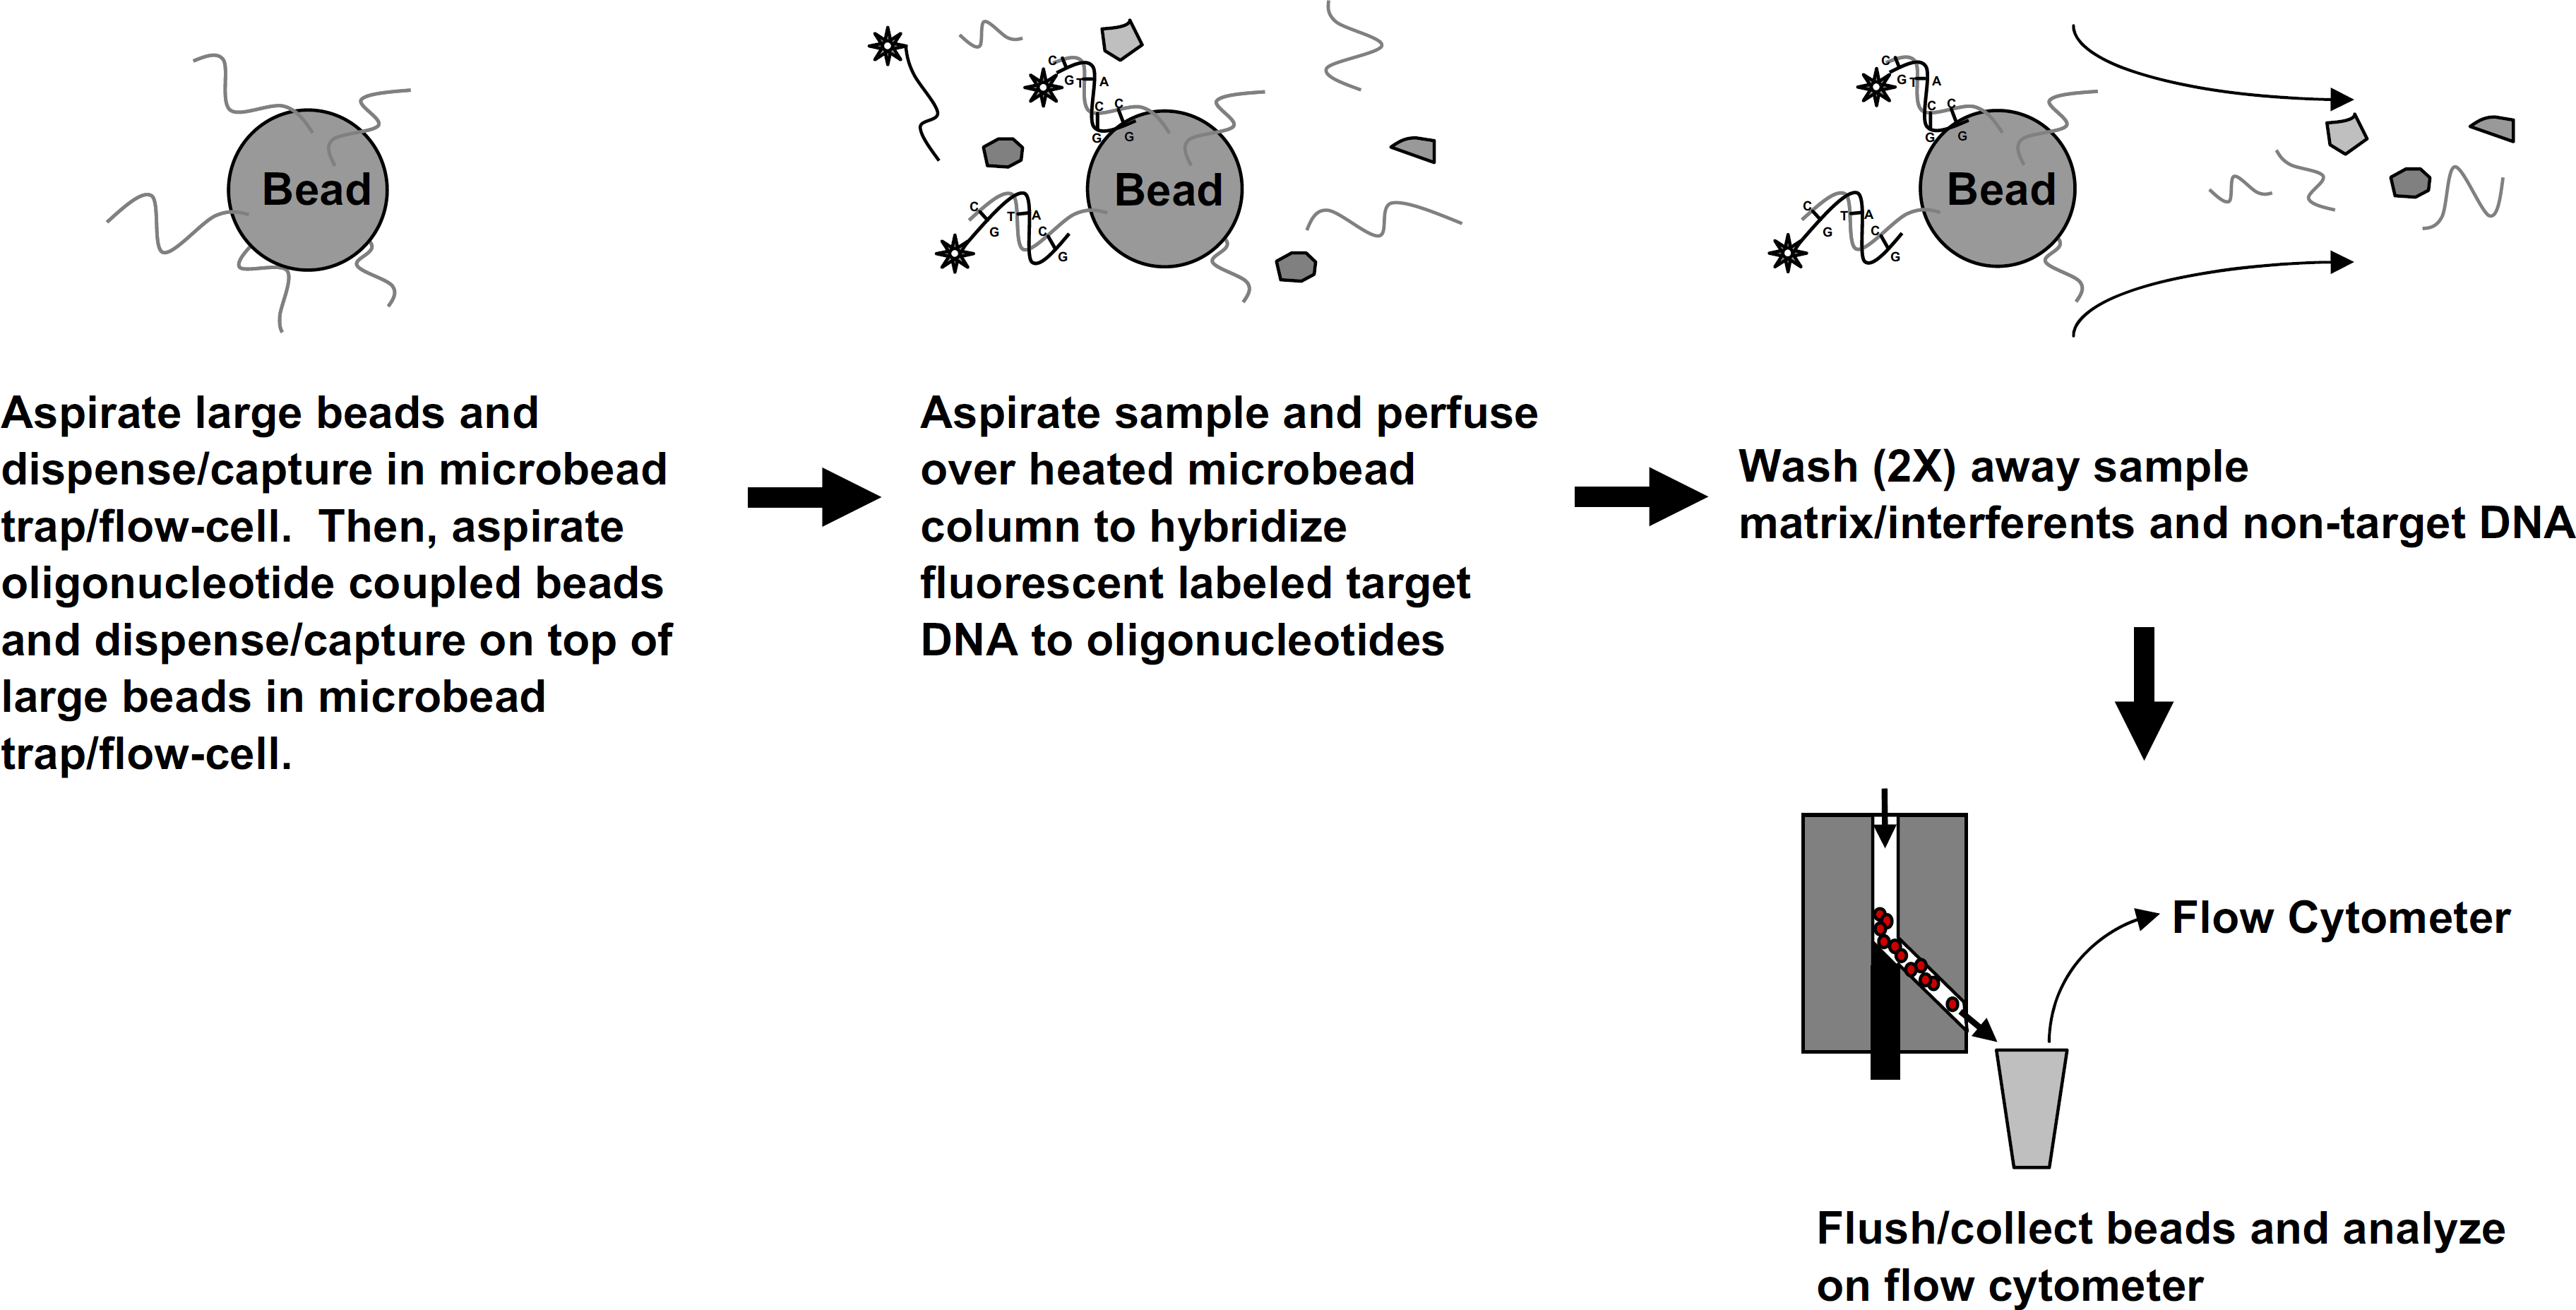
A graphical summary of the automated fluidics protocol for on-column nucleic acid hybridization. Each microbead column contained approximately 10,000 of each type of oligonucleotide-coupled microbeads. Fluorescent-labeled target DNA hybridizes to complimentary strands of nucleic acid present on the microbeads via G–C (Guanine–Cytosine) and A–T (Adenine–Thymine) bonds. The microbead trap/flow-cell enables sample matrix and hybridization/wash solutions to be efficiently washed away.
A BD Biosciences FACS Caliber flow cytometer was used for analysis of the hybridized beads. The internal dye of the bead is excited by a 633-nm laser diode and the emission is measured in the cytometer FL4 channel (661 ± 8 nm). A gate in the FL4 channel is used to reject the larger beads while selecting the desired smaller cytometry beads. The beads gated from the FL4 channel were then analyzed on the FL1 channel (530 ±15 nm), where the measured median fluorescence intensity is proportional to the amount of Alexa 488 fluorescent dye present, which in turn is directly proportional to the amount of hybridized PCR product standard analyte.
E. coli 0157:H7 Immunomagnetic Capture from Large Volumes
Anti-E. coli 0157:H7 immunomagnetic “Dynabeads” were purchased from Invitrogen (Carlsbad, CA) and washed and diluted daily according to manufacturers instructions before use using 1X PBS/0.05% Tween-20 (Sigma-Aldrich, St. Louis, MO). Fifty-milliliter Falcon polystyrene tubes (BD Biosciences, San Jose, CA) were used for all samples. E. coli 0157:H7 was purchased from the American Type Culture Collection (ATCC, Manassas, VA) and grown to log phase daily before use by incubation/mixing at 37 °C for 4–5 h to log phase. The E. coli concentration was approximated by measuring the optical density at 600 nm, but colony forming units (CFUs) per mL of all samples were determined each day by plate count analysis by culturing overnight at 37 °C on agar plates.
For each sample, 10 μL of Invitrogen (Carlsbad, CA) anti-E. coli 0157 superparamagnetic “Dynabeads” were used. Capture efficiency was assessed by culturing supernatant before and after processing. Positive control samples included samples containing E. coli with no added beads and were used to establish the actual number of CFU per mL of solution. E. coli was cultured by plating eight 20 μL spots for each sample. Negative control samples included Millipore (Billerica, MA) purified water with beads and showed no contamination (no colony growth). Manual benchtop assays were performed by spiking 50 mL of 1X PBS/0.05% Tween-20 with 10–50 μL of E. coli into a 50 mL tube to achieve the desired final concentration of 2000 CFUs per mL. The tube was invert mixed for 1 h at room temperature. Samples for automated fluidics assays were prepared in the same manner as manual benchtop assays. The sample was then circulated through a magnetic microparticle trap/flow-cell using an automated fluidics system shown in Figure 7. Sample flow rate was 32 mL/min using an Ismatech (Zurich, Switzerland) peristaltic pump (model #CP 78016–10). The volume of the 2.8 mm inside diameter Tygon tubing sampling line (from inlet to outlet), including the nickel foam (80 pores per inch; Porvair, Norfolk, UK) microparticle trap was 10 mL. The nickel foam piece was 20 mm in length and 4.75 mm in diameter. Six NdFeB magnets (part # 0056; Forcefield, Fort Collins, CO) surrounded the trap. Each magnet was 6.35 mm in diameter and 25.4 mm in length. The nickel foam acts as a magnetic flux conductor within the flow-cell to provide high magnetic field gradients across the width and length of the column, allowing uniform distribution of magnetic beads throughout the entire flow-cell. After 1 h of recirculating the 50-mL sample, a portion of the liquid was removed for culturing to assess whole-cell capture efficiency of the antibody-coupled superparamagnetic beads. After processing, the magnets were removed and the beads were flushed to waste and the nickel foam was reused for the next sample. Blanks (containing no bacteria) were processed through the automated system and culturing confirmed that there was no carryover of bacteria.
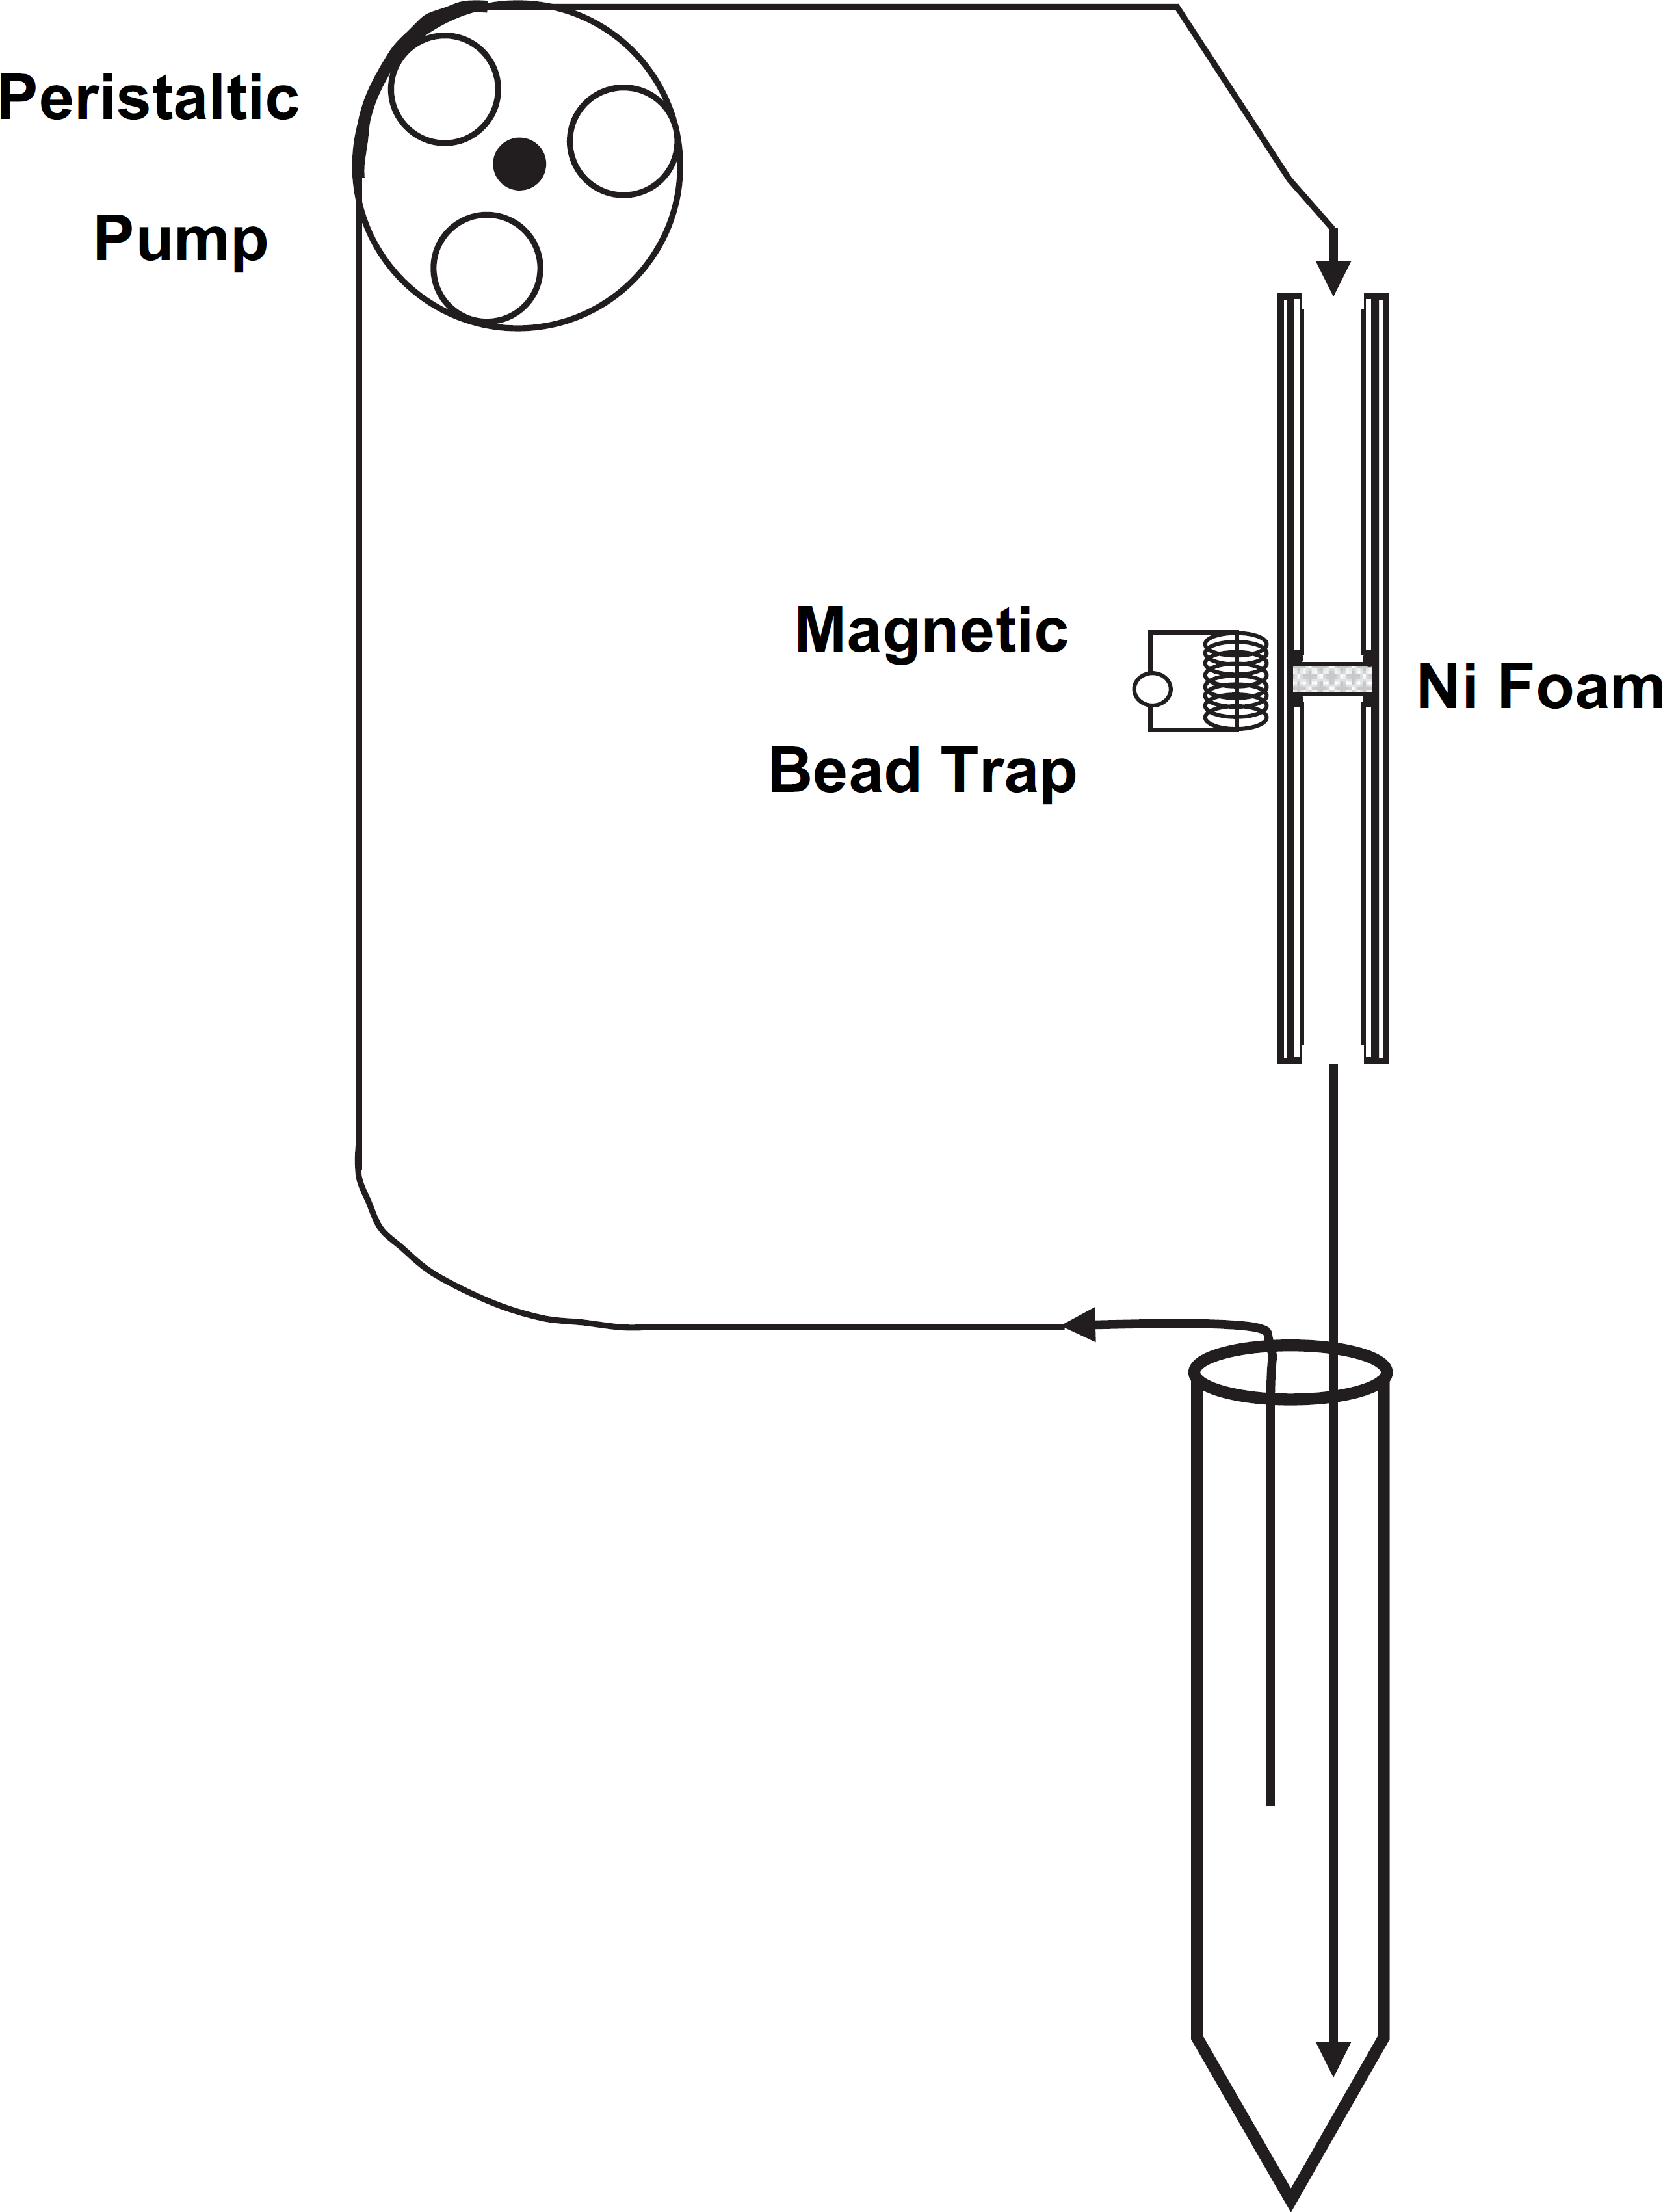
Diagram of the magnetic trap/flow-cell and fluidics system for cell capture on immunomagnetic beads. This system used a peristaltic pump, flexible tubing, and a magnetic bead trap that has a nickel foam insert that functions as a magnetic flux conductor. Whole cells were efficiently captured on the trapped immunomagnetic beads by recirculating the sample.
Results and Discussion
Multiplexed Cytokine Sandwich Immunoassay with Flow Cytometry Detection
Comparison of automated fluidics assays versus manual benchtop assays was performed for three different cytokines (IL-4, IL-5, and IL-10) at 625 pg/mL and 2500 pg/mL. Fluidics assays were performed for 30 min and benchtop assays were performed for 30, 60, 120, and 180 min. Figure 8 shows mean fluorescence intensity (MFI) versus time for fluidics and benchtop assays at the two different target analyte concentrations. MFI values for the automated fluidics at 30-min reaction times are all higher than the corresponding manual benchtop results at 180 min. Comparison of fluidics 30-min assays with benchtop 30-min assays shows that at the same reaction time, MFI values for the fluidics samples were two to three times higher. The fluidics system approach has several advantages over a batch (manual benchtop approach). Because beads are trapped in the microbead trap/flow-cell and the original liquid is expelled, no dilution to the sample occurs. Also, sample and PE detection reagent are sequentially perfused over the microbead column; again, the fluidics approach has an advantage because the sample is not being diluted by the PE detection reagent. However, even considering dilution, the fluidics approach still has improved signal indicating that enhanced mass transport is occurring due to “forcing” the entire sample to pass within close proximity of the beads and interact with the reagents on their surfaces.
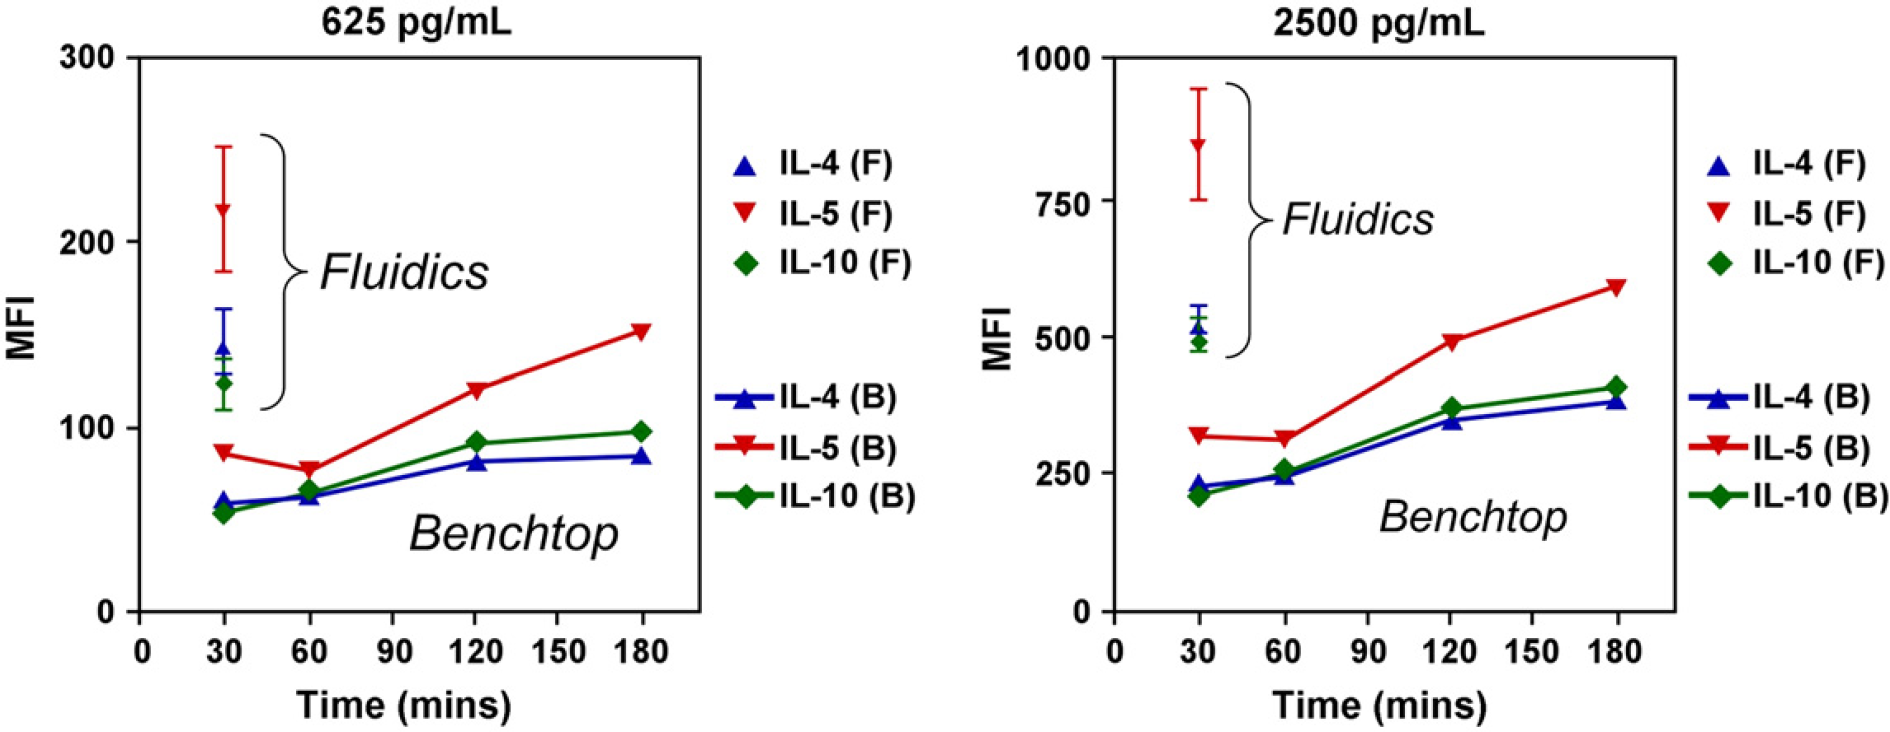
Mean fluorescence intensity (MFI) versus time for the automated fluidics approach (F) and benchtop assays (B) at target analyte concentrations of 625 pg/mL (n = 5 for fluidics) and 2500 pg/mL (n = 11 for fluidics). Benchtop data represent a single sample at each time. MFI values for the automated fluidics at 30-min reaction times are all higher than the corresponding manual benchtop results at 180 min. In addition, comparison of automated fluidics 30-min assays with benchtop 30-min assays shows that at the same reaction time, MFI values for the fluidics samples were two to three times higher.
Figure 9 shows automated fluidics data from a five-plex sandwich immunoassay with analytes (IL-8, RANTES, MIP-1α, MIP-1β, and MCP-1) performed with increasing sample volumes (50, 100, and 150 μL). As can be seen from Figure 9, perfusing larger volumes of sample improved sensitivity of the assay and the relative improvement varied by analyte. Again, the fluidics approach is advantageous because increasing the volume of sample does not dilute other reagents, as is the case with benchtop “batch” approaches.
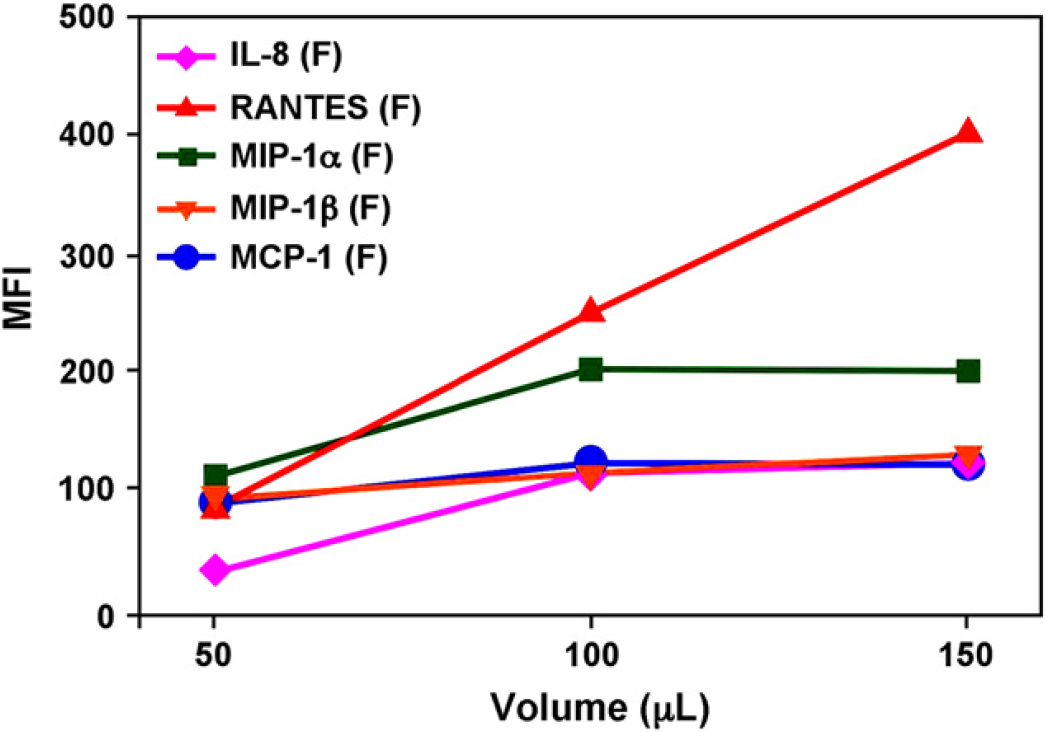
Automated fluidics data (median fluorescence intensity vs volume) from a five-plex sandwich immunoassay performed with increasing sample volumes (50, 100, and 150 μl_) for a single sample. Perfusing larger volumes of sample improved sensitivity of the assay and the relative improvement varied by analyte.
Nucleic Acid Hybridization with Flow Cytometry Detection
Figure 10 shows a comparison of nucleic acid hybridization efficiency of the automated fluidics system versus a standard manual benchtop approach performed in microfuge tubes. The resulting fluorescently labeled hybridized PCR product was measured on a flow cytometer using the geometric MFI. The fluidics system achieves twofold higher hybridization efficiencies versus the benchtop approach. Furthermore, the fluidics approach is faster, less labor intensive, and does not require a centrifuge or heating block. The fluidics approach is faster because the manual hybridization method relies on centrifugation/decanting for bead washing before hybridization and the two washes after hybridization, whereas the fluidics device can simply wash the beads before and after hybridization by rapidly flowing solutions over the microbead column. As stated above, advantages for the fluidics approach are thought to be due to no dilution effects and enhanced mass transport within the fluidics microbead trap system.
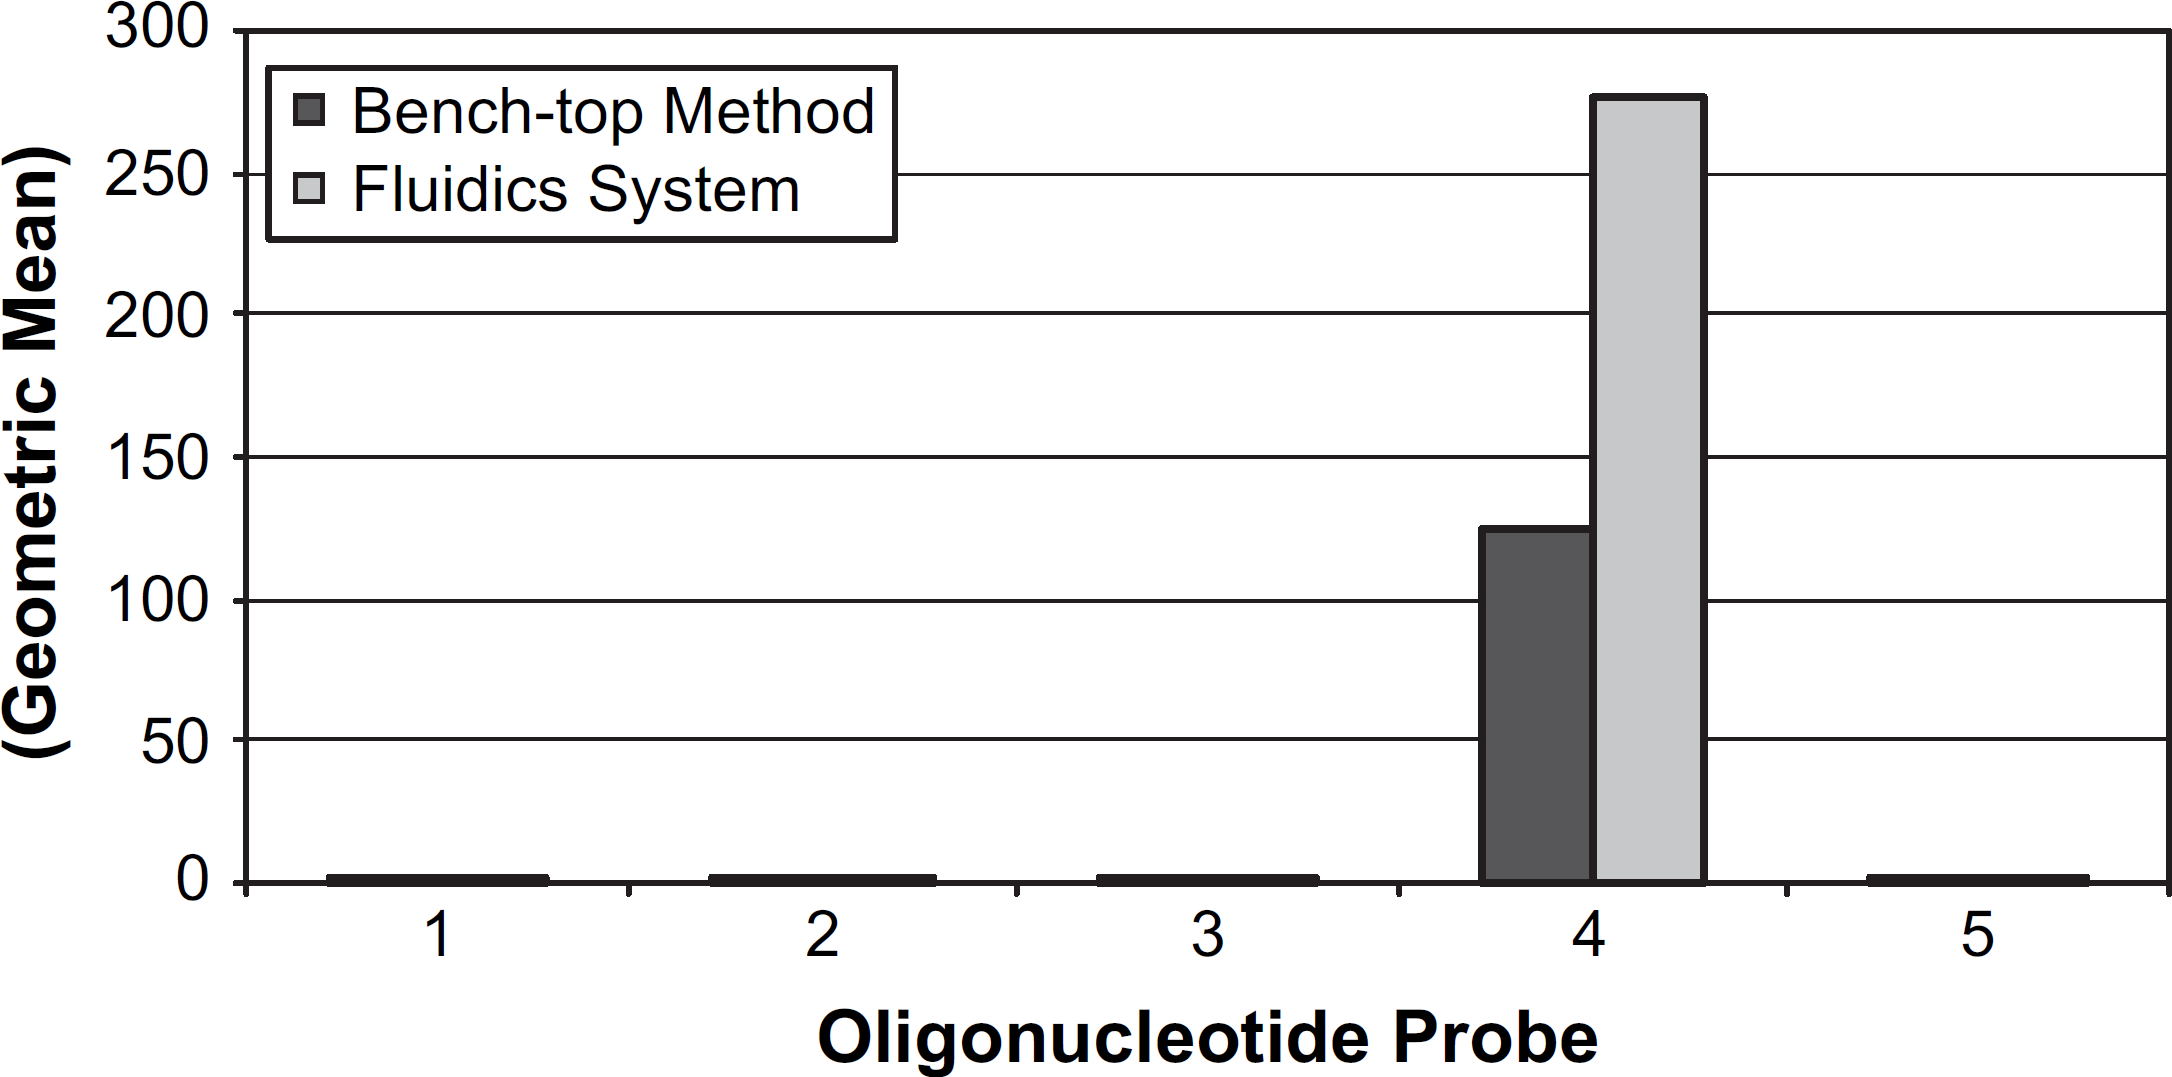
Comparison of nucleic acid hybridization efficiency of the automated fluidics system versus a standard manual benchtop approach for a single sample. The resulting fluorescently labeled hybridized PCR product was measured on a flow cytometer using the geometric mean fluorescence intensity. The fluidics system provided a two-fold increase in hybridization efficiency. Controls showed no cross-hybridization and included oligonucleotide probes invA (probe 1), lacZ (probe 2), stx1 (probe 3), and no oligonucleotide/bare bead (probe 5).
E. coli 0157:H7 Immunomagnetic Capture from Large Volumes
Use of a magnetic trap/flow-cell also provides performance advantages versus manual benchtop “batch” assays. Figure 11 shows whole-cell capture efficiency for samples processed in a benchtop format and on a fluidics system with and without a nickel foam insert placed in the magnetic trap/flow-cell. 7 A control sample (no cells present) was also analyzed on the fluidics system and indicated no carryover/contamination was present after analyzing samples. Capture efficiencies were determined by culturing a portion of the sample not containing beads before and after processing. Using the fluidics system with magnetic capture on the inside of the fluidics tube without nickel foam provided a twofold improvement in whole-cell capture. When nickel foam was used in the fluidics system, a nearly fourfold improvement in capture efficiency was realized relative to the manual benchtop approach. Performance improvements for the automated fluidics system in this case are likely entirely due to enhanced mass transport, because there are no “dilution” issues for these sample types. By “forcing” the fluid to pass near the immunomagnetic beads, capture efficiency for the cells in the sample is enhanced versus the standard benchtop approach that relies on diffusion (even though the benchtop sample was continuously invert mixed to overcome diffusion limitations). The improvement using nickel foam in the fluidics system is likely due to the magnetic beads being trapped more uniformly throughout the cylindrical flow channel of the magnetic trap/flow-cell, thus providing a better chance that a cell will contact an immunomagnetic bead.
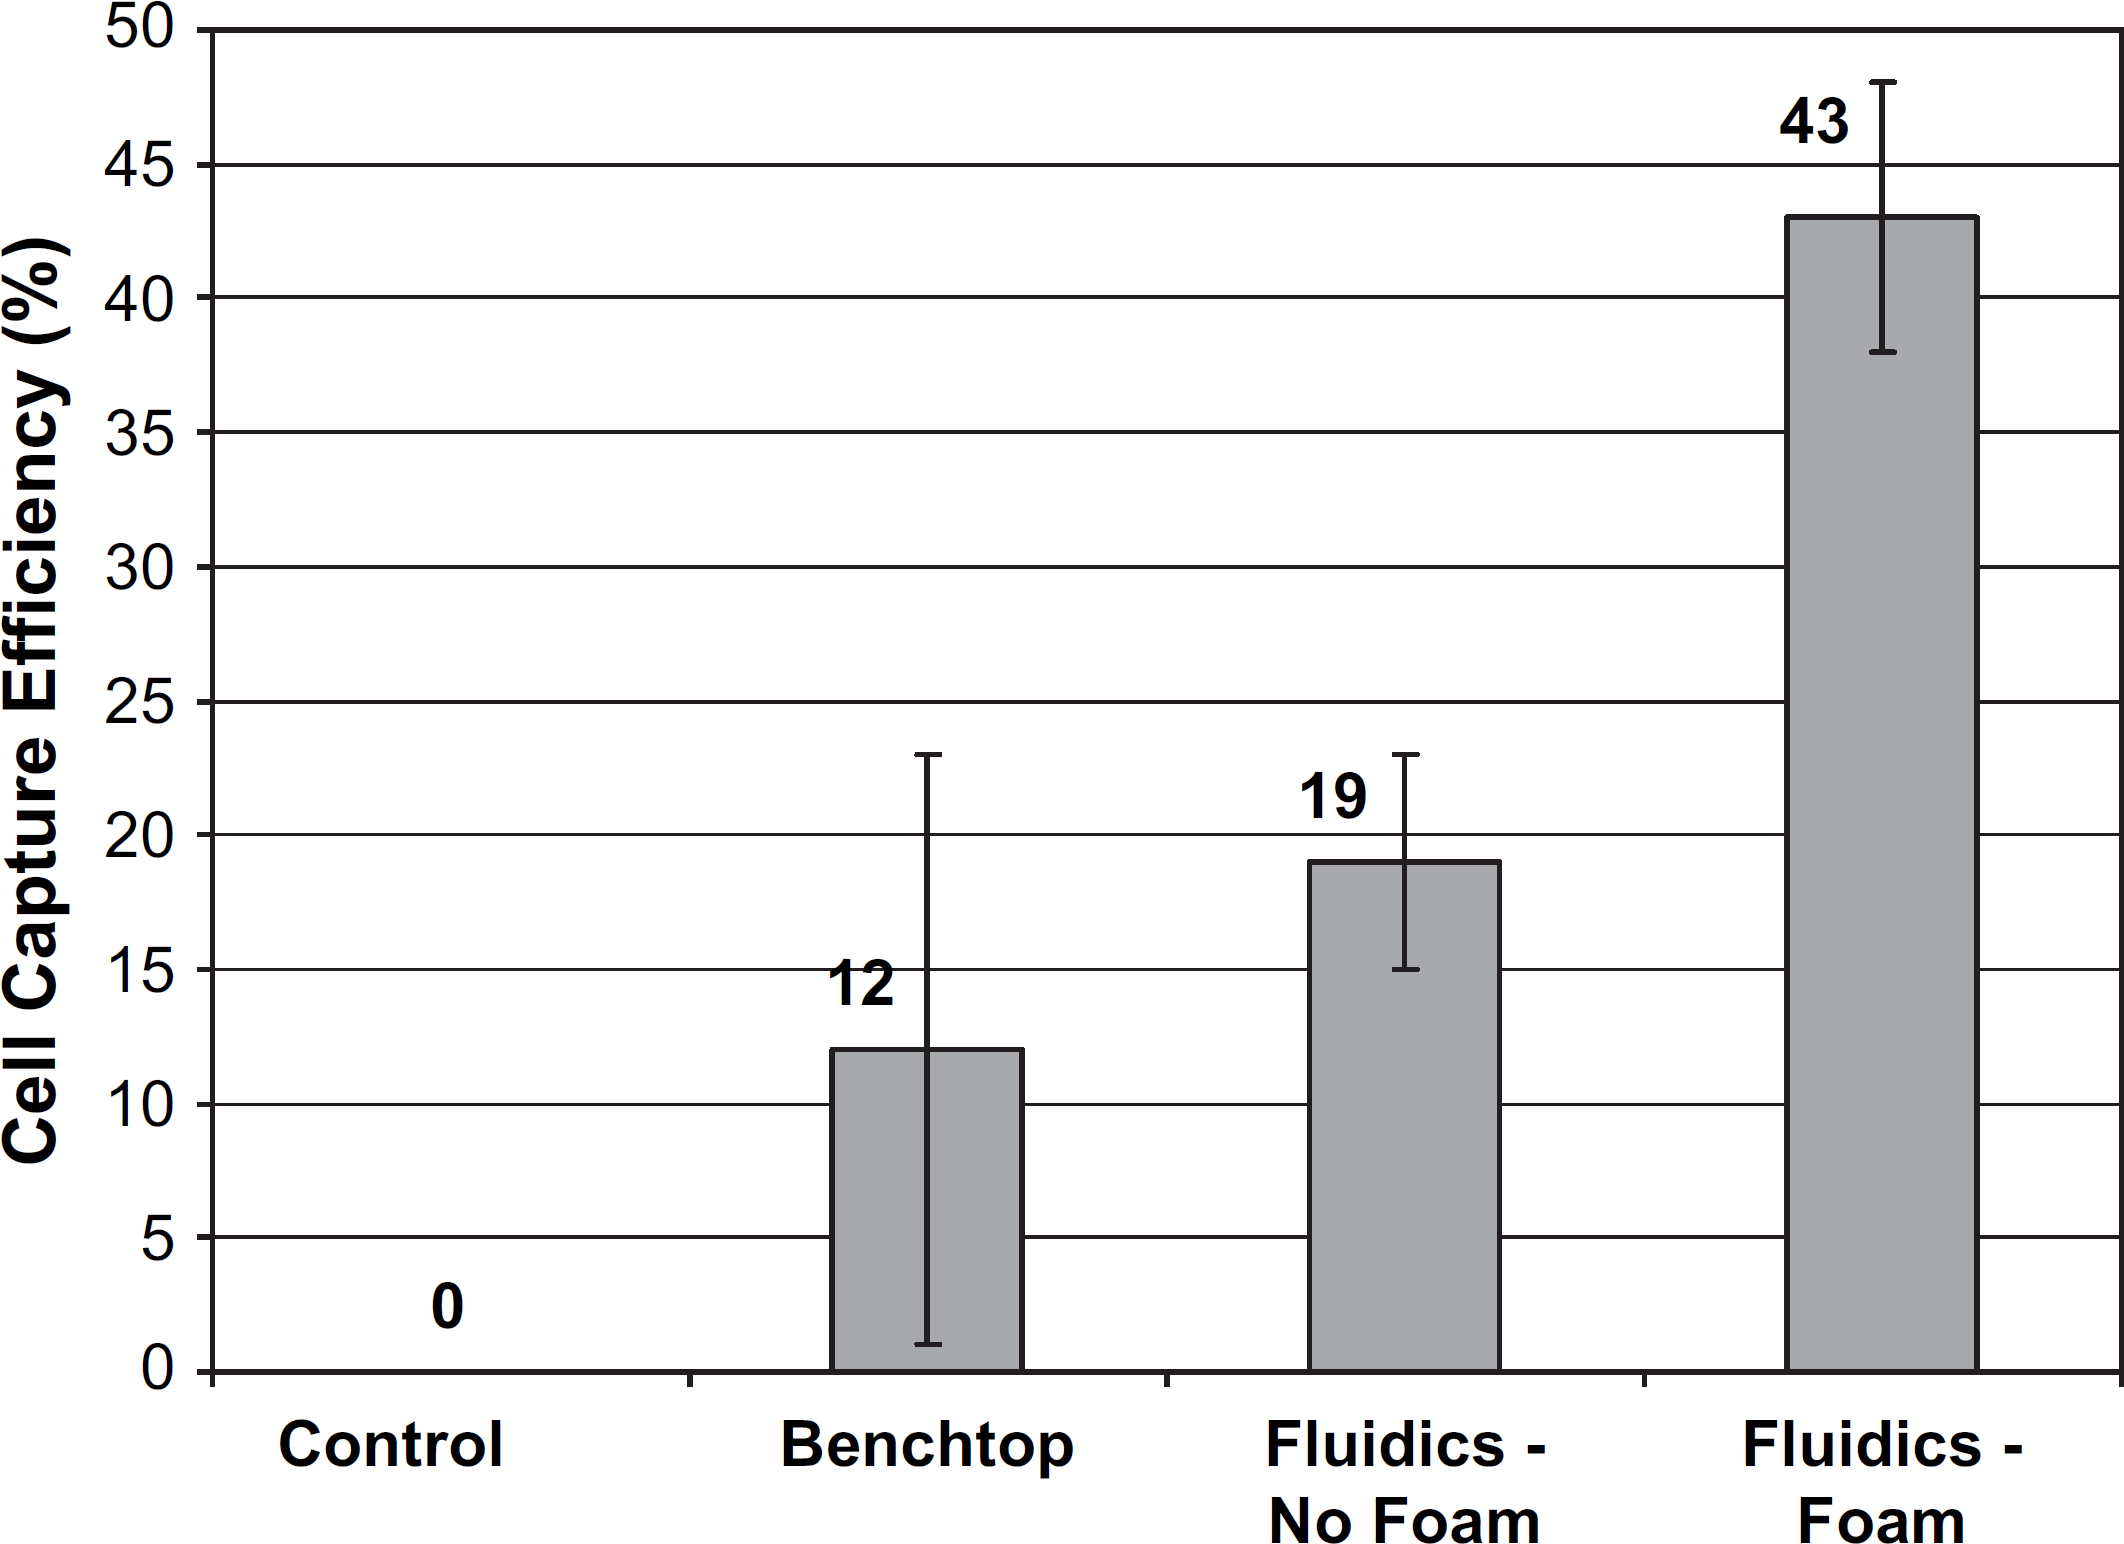
Escherichia coli (E. coli) 0157:H7 whole-cell capture efficiency for samples processed in a manual benchtop format (n = 2) and on an automated fluidics system with (n = 11) and without (n = 2) a nickel foam insert placed in the microparticle trap/flow-cell. A control sample (no cells present) indicated no carryover/contamination was present after processing samples on the fluidics system. Note: Automated fluidics captures with no nickel foam were performed at an E. coli concentration of 1500 cells/mL. All other captures were performed at 1000 cells/mL.
Conclusions
The microbead trap/flow-cell used in automated fluidics systems provides significant performance advantages for bead-based bioassays versus traditional batch assays performed in tubes or microplate wells. Assay speed and sensitivity can be enhanced using this approach. Different microbead traps have been developed and tested for both nonmagnetic and magnetic beads. 10 In addition to avoiding dilution effects that occur during many traditional batch assays, the microbead trap/flow-cell has the added advantage of improving mass transport. In addition, this approach allows larger volumes of sample to be perfused over the microbead column providing sample preconcentration that can improve assay sensitivity. Although no attempt was made to regenerate or reuse microbead columns in this work, it is possible for certain assays. The microbead trap/flow-cell is a scaleable device that can be modified to handle microliter to liter sample volumes. By simply changing the bead surface chemistry, reagents, and fluidics handling routines, these systems are readily adaptable to other assays without requiring changes to the apparatus. Current work is ongoing to develop microbead trap/flow-cells for parallel sample processing and to design disposable versions of these devices. A prototype 12-channel device has been constructed and designs for 96-channel devices are being pursued. Therefore, a variety of design options exist for effectively integrating the microbead trap/flow-cell into existing automated liquid handling systems.
Acknowledgments
Funding for this research was made possible by the American Water Works Association Research Foundation, the Department of Energy Laboratory Technology Research Program, the Department of Homeland Security Science and Technology Directorate, and Laboratory Directed Research and Development funds. The authors would like to thank the following for their assistance with the cytokine research: J. Ember and B. Bowman (BD Biosciences). Pacific Northwest National Laboratory is operated by Battelle Memorial Institute for the United States Department of Energy under contract DE-AC0676RL0 1830.