
Abstract
Microarray analysis as a tool that provides the opportunity for simultaneous study of thousands of molecules has greatly contributed to research in many areas including functional genomics and proteomics, disease diagnosis and drug discovery. Pin-based spotting has been widely used in microarray fabrication. This paper investigates blotting procedure, that is, removing excess reagent from pins. A new optimum blotting pattern is proposed. Blotting constraints and parameters are identified and a new pattern, Beta program is proposed and compared with a patented and commonly used blotting pattern, Alpha program. A simulation program has been developed using LabVIEW to demonstrate and compare different blotting patterns. Based on the simulation results, the optimal blotting pattern in terms of speed of blotting operation and density of spots on a slide using different types of source microplates has been obtained. The optimum Beta program showed an increase of 11 times in the density of spots compared to the Alpha program. The Beta program is ready for implemention to improve the efficiency of blotting procedure.
Introduction
One of the major technologies that help biochemists and molecular biologists in Genomics and Proteomics to perform in parallel a large number of experiments is the microarray. A microarray can be traditionally defined as a laboratory slide populated with a high-density array of very small volumes of molecules. Microarray technology has attracted tremendous interests among bioscientists as it provides a simultaneous study of thousands of genes or their products (i.e., proteins) in a given living organism. In 1995, Brown of Brown Lab at Stanford University developed the cDNA microarray machine in which a high-speed robot was used to automate the dispensing operation. 1 This created a major breakthrough and thereafter, the technology called “microarray” has been extensively used in various related fields.
Figure 1 shows conceptually the complete four-step process of microarray analysis. 2 Overall quality of microarray analysis depends on the quality of each of these four steps. This paper is focused on improving blotting procedure, which is part of pin-based printing process for microarray fabrication.

Different steps in microarray analysis.
Blotting or preprinting refers to the removal of excess solution on the pins to dispense consistent spot sizes in contact-based dispensing method. Once the pins are dipped into the solution, the early spotting produces larger and inconsistent spot sizes before attaining consistent spot sizes. 3 It is assumed that the absorption of the solution onto the outer surface of the pins causes the variable spot sizes. 4 , 5 Therefore, more preprinting is required when there is a larger solution volume in the wells of microtitre source plates. For example, if the solution volume in the wells of a 384-well format plate exceeds 6 μL, blotting procedure is required. 4 The blotting process is done by spotting few times onto an ordinary glass slide (blotting slide) to drain excess solution from the outer surface of the pins until consistent spot sizes are reached.
The motivation for optimizing the blotting procedure originated from the need for maximizing the usage of blotting slides to increase the walk-away time. Many commercialized microarray systems use glass slides for blotting. For examples, PerkinElmer, Inc. (Boston, MA) and TeleChem International, Inc. (Sunnyvale, CA) use four and two blotting slides, respectively. There is a limited space on the platform of microarray systems, hence limited numbers of blotting slides are available, and consequently, the walkaway time is limited. Therefore, the blotting pattern needs to be optimized to generate maximum spot density without overlapping spots. A LabVIEW program has been developed to simulate and compare different blotting patterns. The program consists of a user-interface to define required blotting parameters and an algorithm that determines preprinting pattern on a slide. A new optimum blotting pattern is proposed and compared to a patented blotting algorithm using our developed blotting simulation program.
The paper is structured as follows. Blotting parameters, constraints and assumptions are defined followed by descriptions of a patented blotting pattern and a newly proposed blotting pattern. Then, a method of comparison is presented and simulation results of the two aforementioned blotting patterns using different source microtitre plates are provided. Furthermore, results are discussed and advantages of the new optimum blotting pattern are explained. Finally, the conclusions and future works are presented.
Blotting constraints, parameters, and assumptions
All blotting constraints that have been considered in this study are summarized in Table 1. Fixed constraints are defined by the capability of the microarray system, thus they cannot be changed. Defined parameters are constraints that can be varied; however, they are set to constant values for the simplicity of analysis. Input parameters are constraints that are specified by the user for specific blotting applications. Each constraint is explained in the following section.
Constraints of a Blotting Pattern
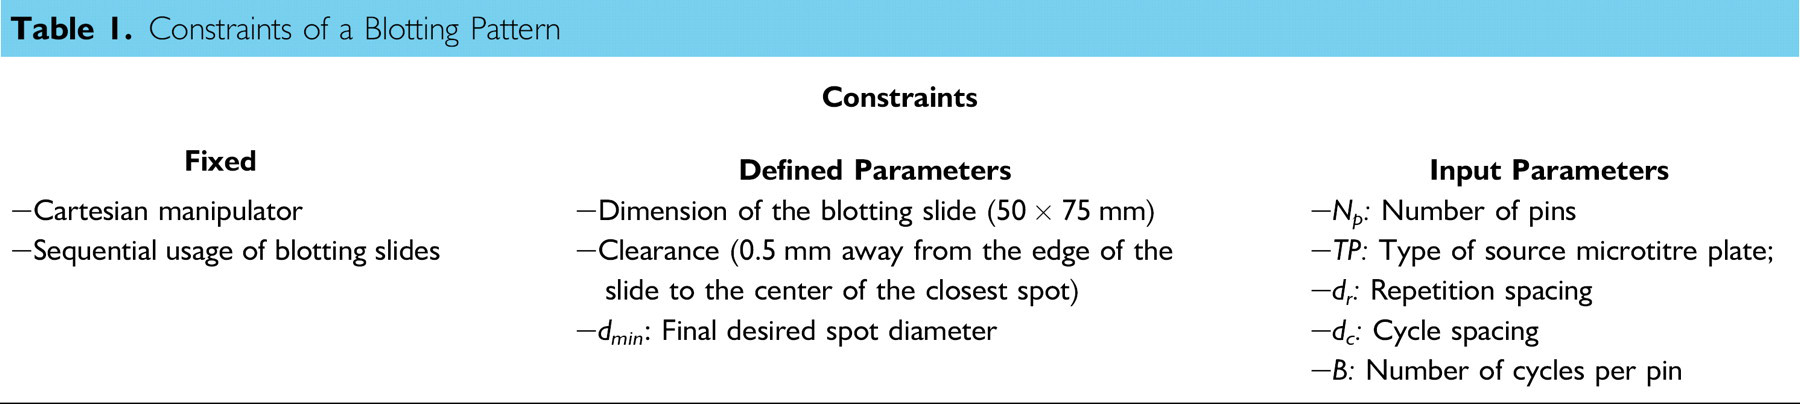
Fixed Constraints
The first constraint is due to the usage of a Cartesian manipulator in microarray systems. Almost, all commercialized systems use a Cartesian manipulator. Consequently, this limits the end-effector movement to just translation without any rotation. The second constraint that has been considered in this study is that in each blotting cycle, slides are blotted individually and simultaneous usage of slides have not been considered.
Defined Parameters
Three parameters are defined. These parameters can be varied in different setups; however, in our analysis they are defined to be constant values as follows: (1) Dimension of blotting slides: 50 × 75 mm has been considered as the dimension of blotting slides. This size has been used by most microarray manufacturers; (2) Blotting area: a clearance of 0.5 mm is considered from the edge of the blotting slide to the center of the nearest spot, for example, if the spot diameter is 0.8 mm, then there should be a safety distance of 0.1 mm from the edge of the slide to the spot as shown in Figure 2; (3) Final desired spot diameter: the final desired spot diameter (d min), which is the consistent spot diameter after blotting and also the last spot size in the blotting procedure, was selected to be 100 μm. This value has been used in most microarray systems.
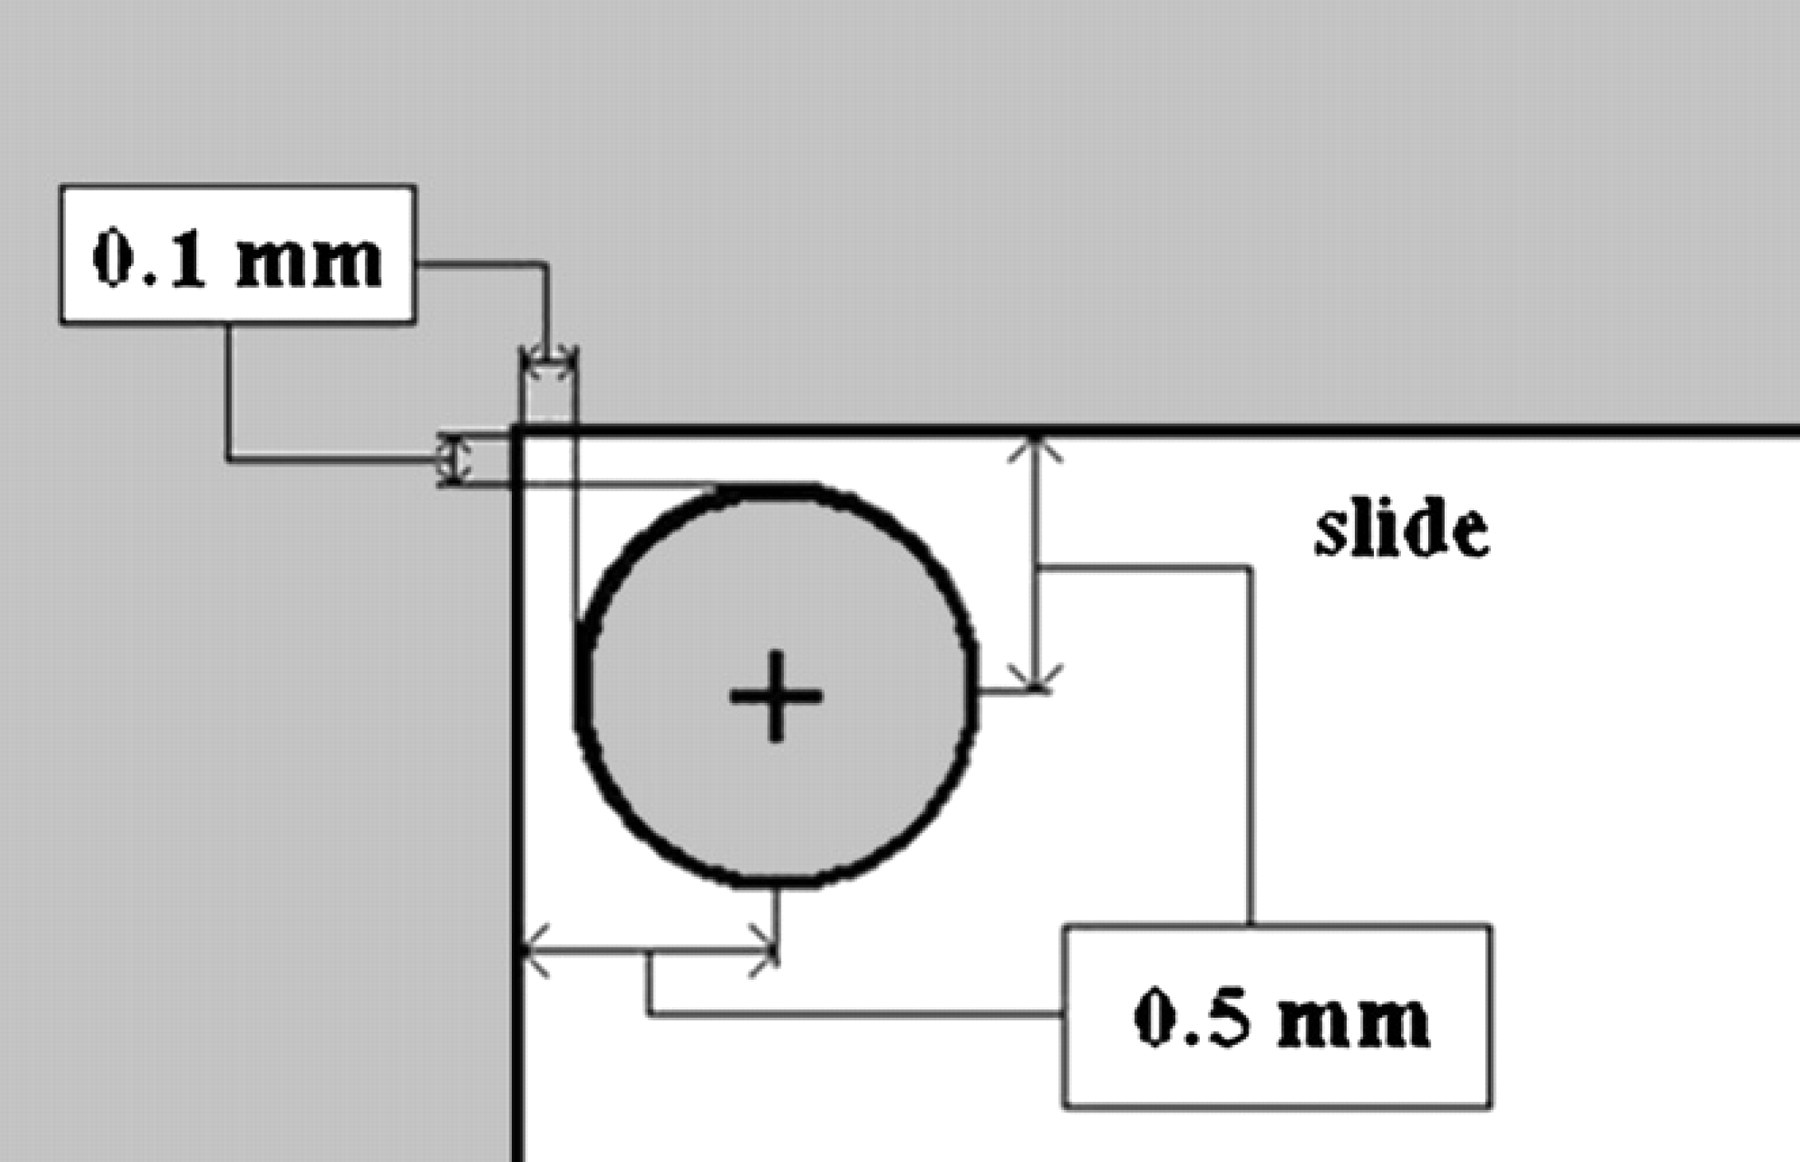
Required clearance from the edge of a blotting slide.
Input Parameters
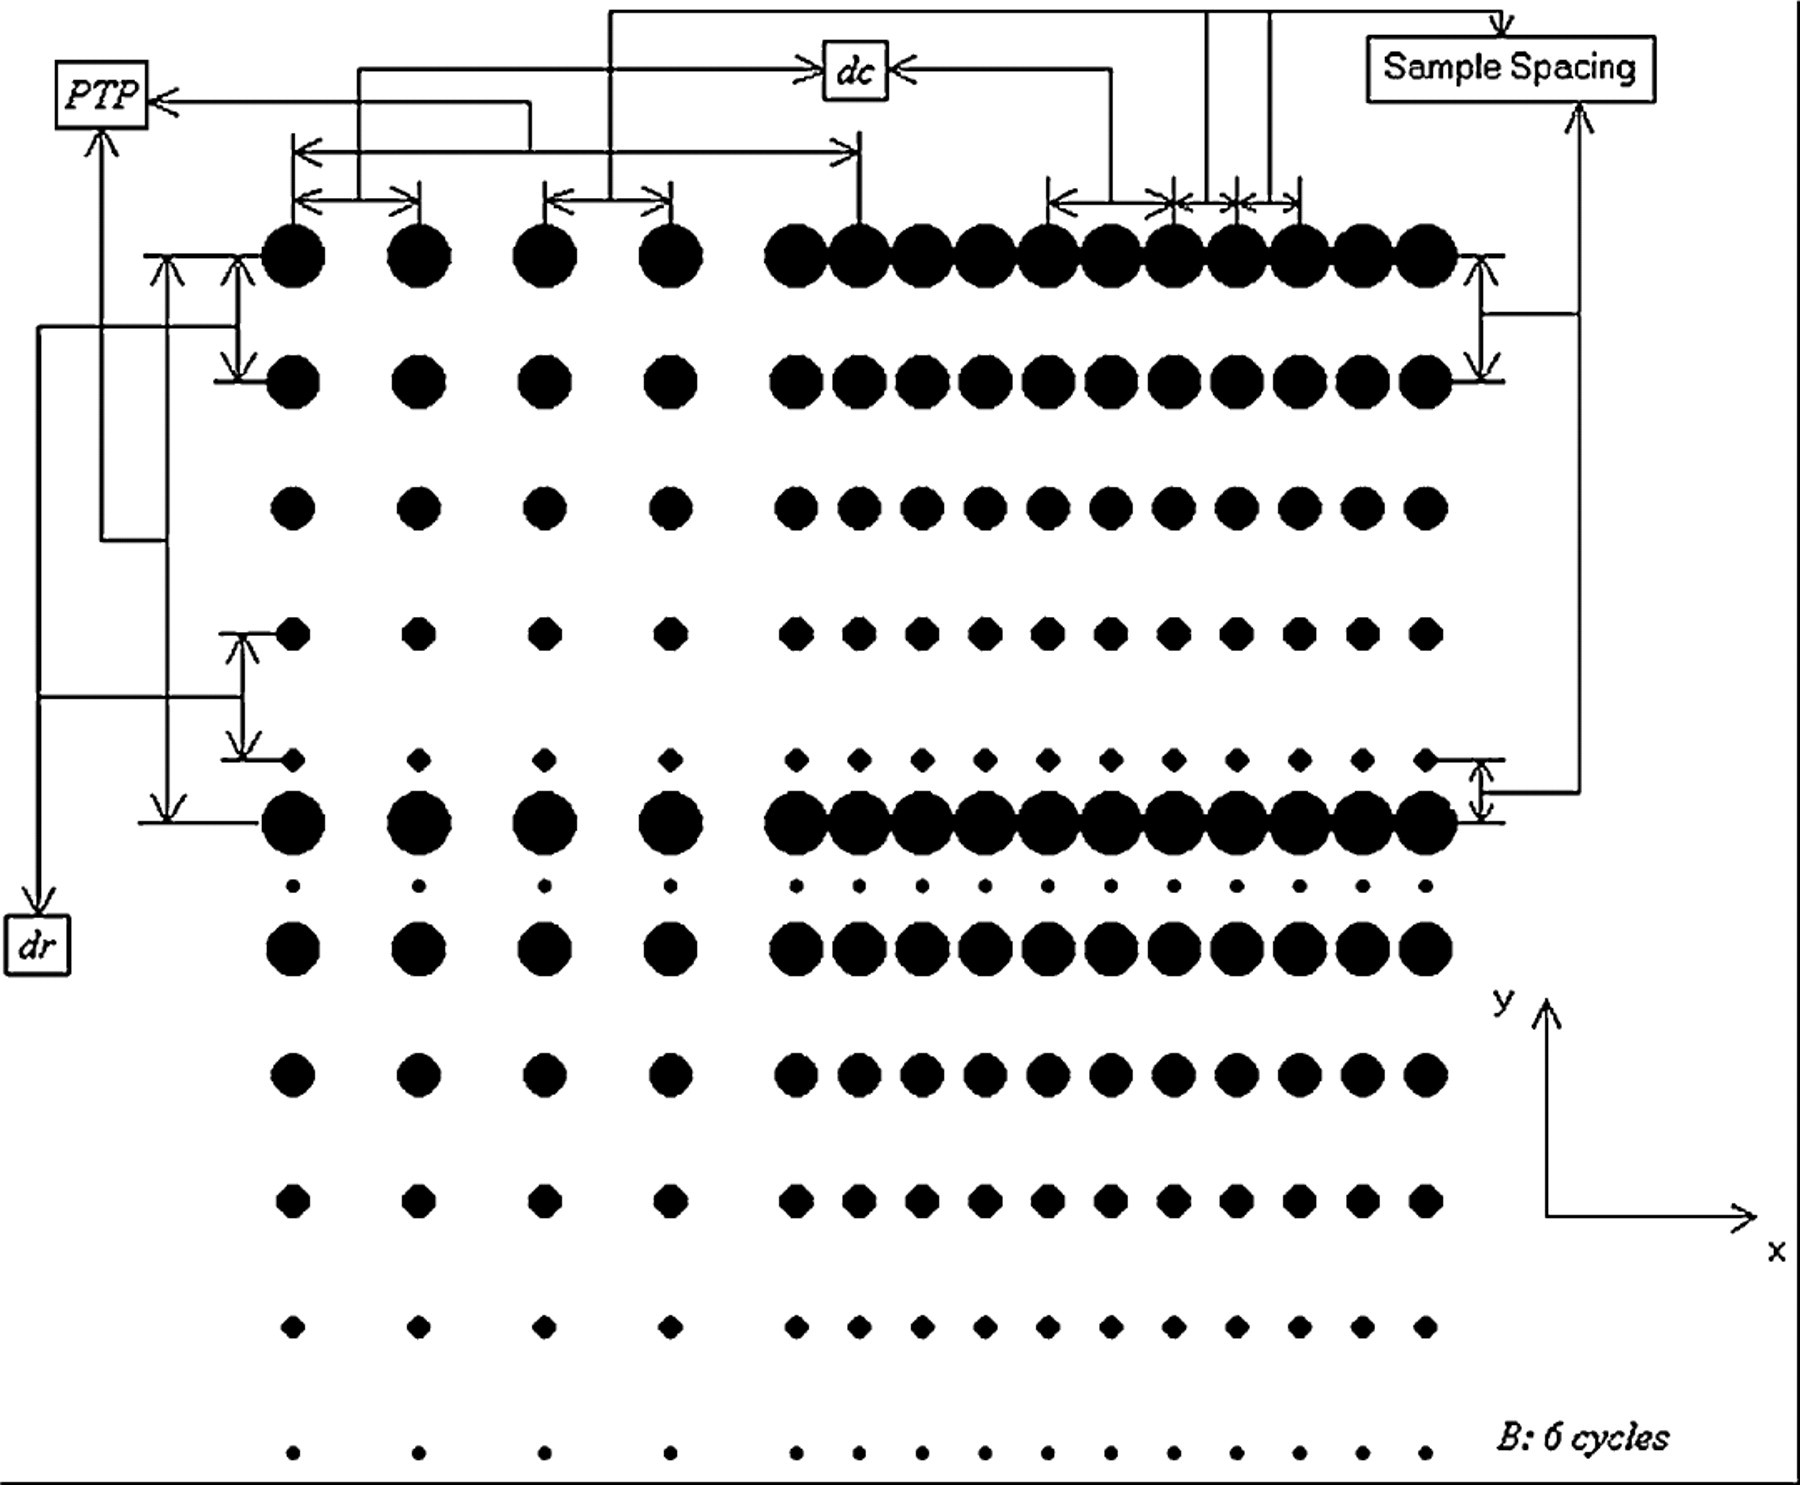
The basic input parameters, as shown in Table 1 are defined as follows: (i) Np (N pr × N pc): number of pins in the pinhead (number of pins in the row × number of pins in the column of a pinhead). The most common combinations are 4 (1 × 4), 16 (4 × 4), 32 (4 × 8), 48 (4 × 12), and 64 (4 × 16) pins; (ii) TP: type of source microtitre plate refers to the format of source plates. The most common formats are 96- and 384-well formats; (iii) dr : repetition spacing is the “y” distance that pins move between spots; (iv) dc : cycle spacing is the “x” distance that pins move between spots; and (v) B: number of cycles per pin is the number of times that each pin spots per loading in blotting procedure. Repetition spacing, cycle spacing, and number of cycles per pin are depicted in Figure 3 with an arbitrary example of a 2 × 2 pin array. This pin-array format is not used commercially; however, it is chosen because parameters can be shown better in a small size picture using this format. Furthermore, type of source microtitre plate defines spacing distance between pins, where 96- and 384-well formats have a pin-to-pin spacing (PTP—distance between center-to-center of the pins in the pinhead) of 9.0 mm and 4.5 mm, respectively. Also, the maximum spot diameter (d max), which is the spot diameter of the first spot per loading, was assumed to be 800 μm and 500 μm for the 96- and 384-well formats, respectively. The 96-well format has a larger initial diameter due to its greater contact surface area with pins.
Definitions of input parameters.
Blotting Assumptions
In our simulation, we have assumed a linear relationship for the changes in the diameter of spots per cycle; therefore, spot diameters can be calculated as follows:

where n is the nth spot created by a pin, dn is the diameter of the nth spot, d max is the maximum spot diameter, d min is the minimum spot diameter (final desired spot diameter), and B is the number of cycles per pin.
Alpha blotting pattern
A commonly used blotting pattern, 6 that is called Alpha pattern in the paper, is explained in this section. Input parameters in the Alpha program are defined as follows: (i) number of pins and the type of source microtitre plate are defined by the user; (ii) repetition spacing, cycle spacing, and the number of cycles per pin are calculated by the program. The repetition spacing and the cycle spacing (in millimeter) are calculated as dr = N pr/factor and dc = N pc/factor. The factor depends on the type of source microtitre plate. This value for 96- and 384-well formats is 1 and 2, respectively. For example, assuming a 2 × 4 pin array with 384-well format, the repetition spacing and the cycle spacing are 1 mm and 2 mm, respectively. This can provide sample spacing (the distance between center-to-center of the closest spots at the end of the blotting procedure) of 0.5 mm that ensures no overlap to prevent cross contamination. Furthermore, the number of cycles per pin is calculated in most cases as the number of spottings that can fit in one column without overlapping spots.
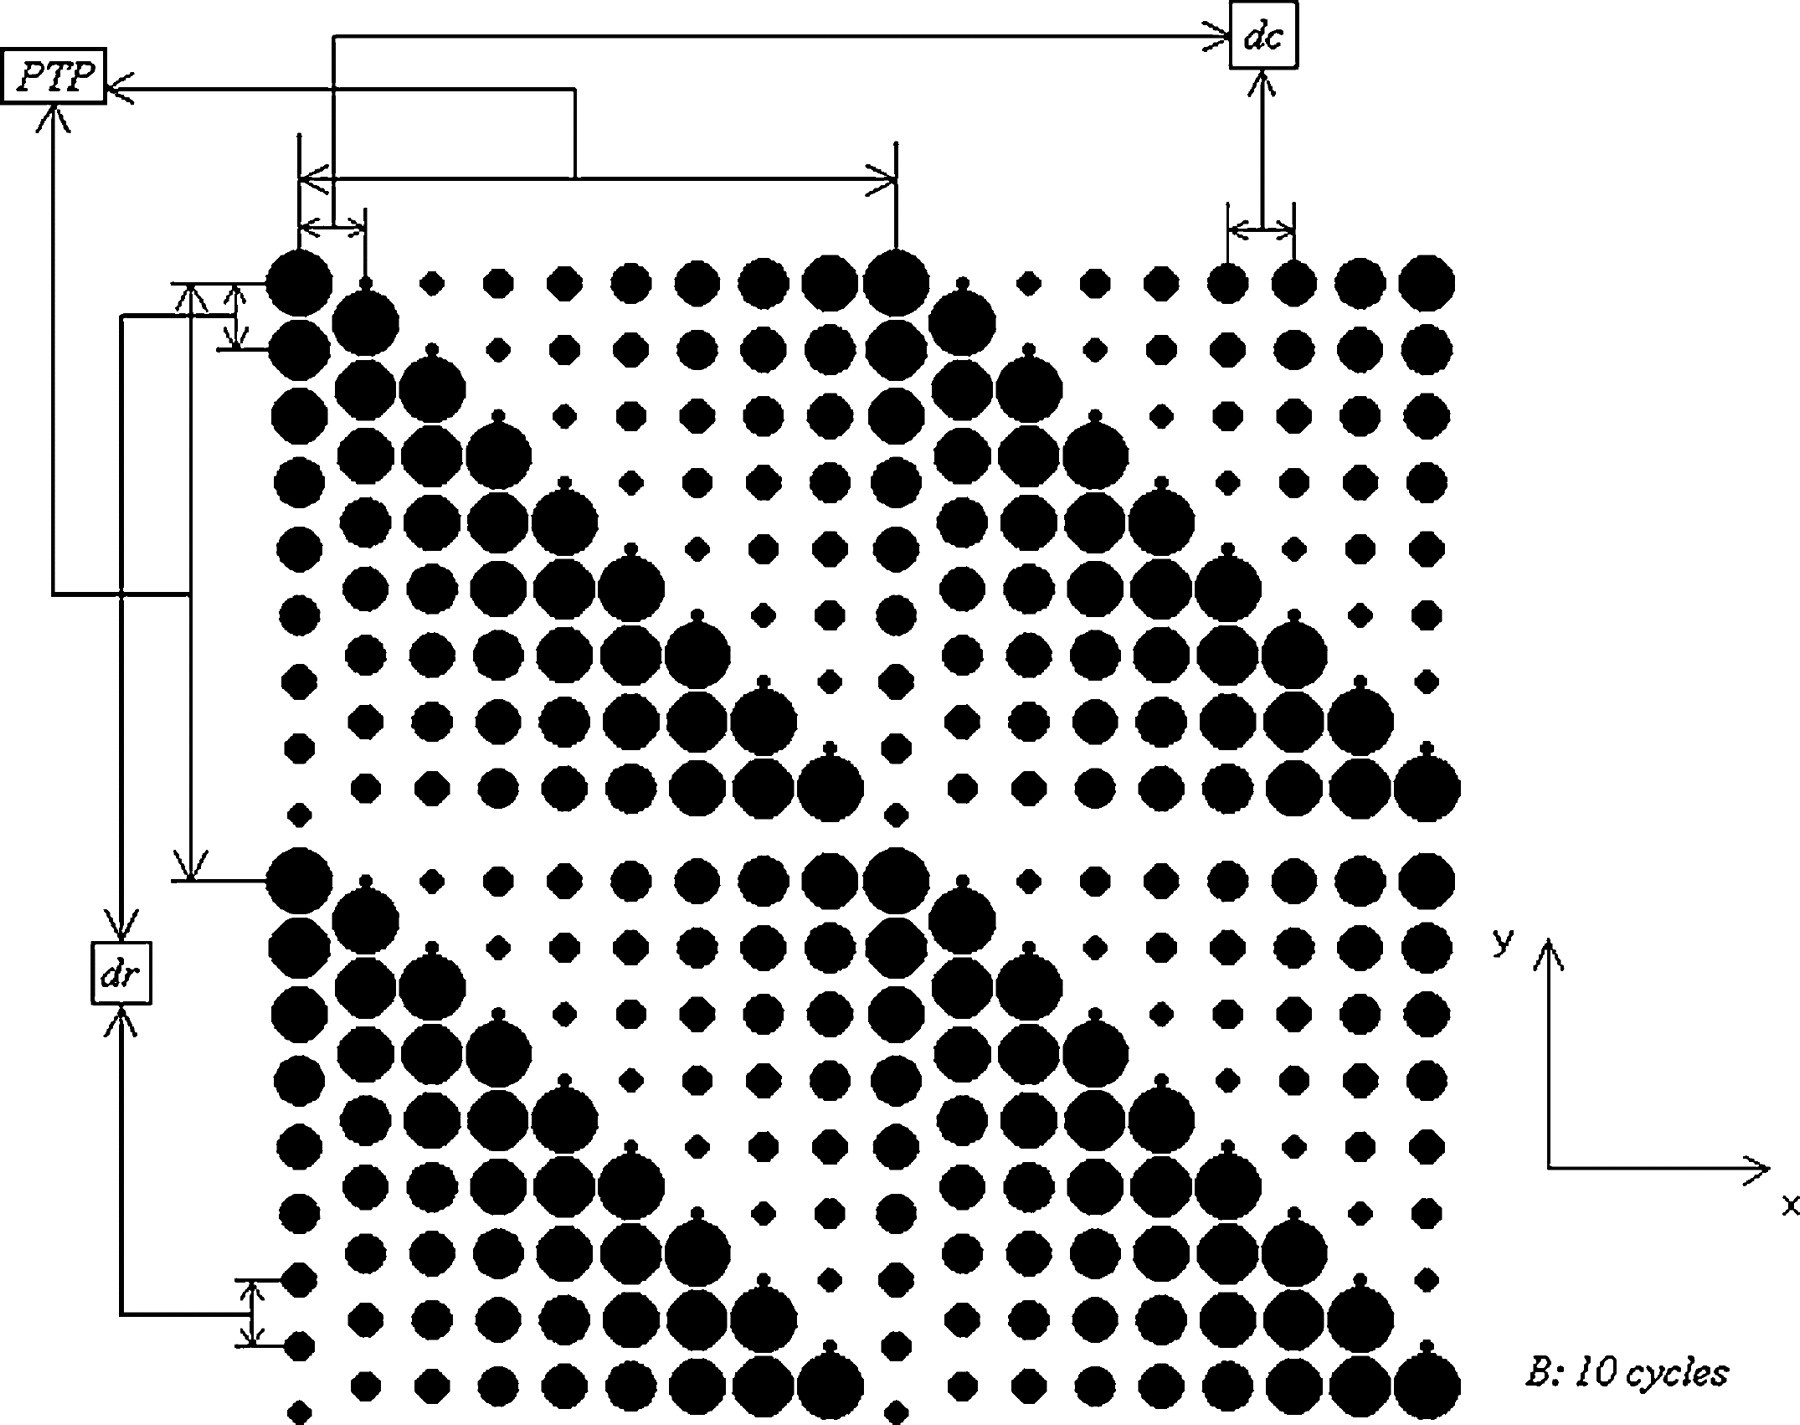
The blotting protocol for the Alpha program is as follows: (1) spotting starts in the y direction (downward), with a repetition spacing between spots until they exceed the size of the blotting slide; (2) then pins are moved in the x direction (to the right) by the cycle spacing and also go back (up) to the initial y position for another cycle; and (3) steps 1 and 2 are repeated until the x direction exceeds the size of the blotting slide. Once the procedure is finished, an array of spots is created such as shown in Figure 4. This figure is created for demonstration of the Alpha program assuming a 2 × 2 pin-array format and the number of cycles per pin is chosen as six.
The blotting pattern of the Alpha program using a (2 × 2) pin array.
Beta blotting pattern
As an alternative to the Alpha pattern, we propose a new pattern that is called Beta pattern in this paper. Beta pattern is a user-defined pattern in which all input parameters are defined by the user. The repetition spacing and the cycle spacing are recommended to be set at the assumed maximum spot diameter to prevent overlaps. For 96- and 384-well formats, the spot diameters were assumed to be 0.8 mm and 0.5 mm, respectively. The number of cycles per pin is chosen by the user and is dependent on the knowledge of the user to ensure consistent spot diameters without redundant blotting.
The blotting protocol of the Beta program is divided into two parts. The first part is as follows: (1) spotting starts in the y direction (downward), with a repetition spacing between spots until they exceed the distance of PTP spacing; (2) pins are moved in the x direction (to the right) by the cycle spacing and also go back (up) to the initial y position; and (3) Steps 1 and 2 are repeated until the array exceeds the distance of PTP spacing in the x direction. The blotting cycle can finish anytime during steps 1–3 once the number of cycles per pin is met. Then, another cycle continues just below the last spot of the previous cycle, giving a spot-to-spot space of (d max + d min)/2. Once step 3 is finished, an array of spots is created such as shown in Figure 5A assuming a 2 × 2 pin array.
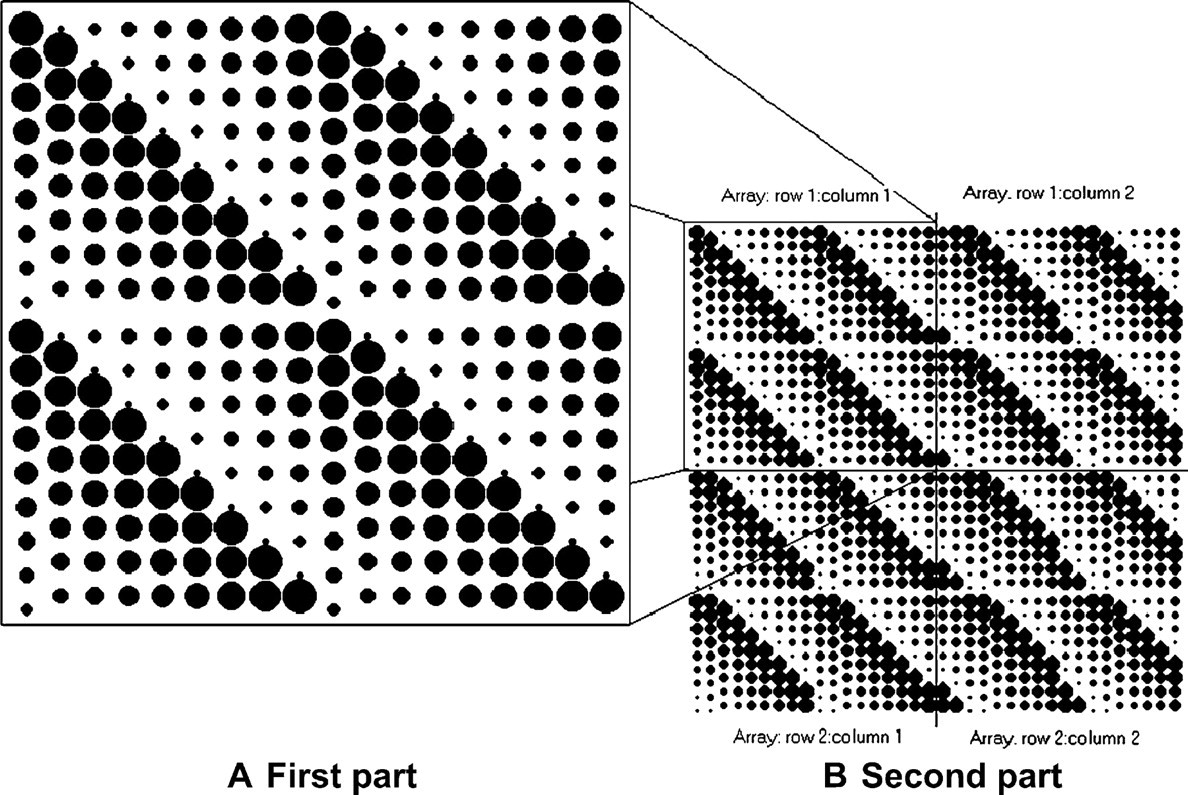
Blotting array and subarrays of the Beta pattern assuming a 2 × 2 pin-array format.
The second part creates an array of the first part, which is now a subarray of blotting spots on the blotting slide as shown in Figure 5B. The procedure of the second part is as follows: (1) once the first subarray (row 1 column 1) is blotted (Figure 5A), a second set (row 2 column 1) is blotted, giving a space of PTP spacing along the y axis between the initial bottom-left pin position of the previous subarray (row 1 column 1) to the initial upper-left pin position of the present subarray (row 2 column 1) as shown in Figure 6; (2) Step 1 in part two is repeated until the array exceeds the y distance of the blotting slide; (3) the pins then proceed to the next column to spot, giving a space of PTP spacing along the x axis between the initial upper-right pin position of the first subarray (row 1 column 1) to the initial upper-left pin position of the present subarray (row 1 column 2) as shown in Figure 6; and (4) Steps 1–3 of part two are repeated until the array exceeds the x distance of the blotting slide. Therefore, the number of subarrays on a blotting slide depends on the size of the blotting slide, pin-array format, and the type of source microtitre plate, which determines PTP spacing.
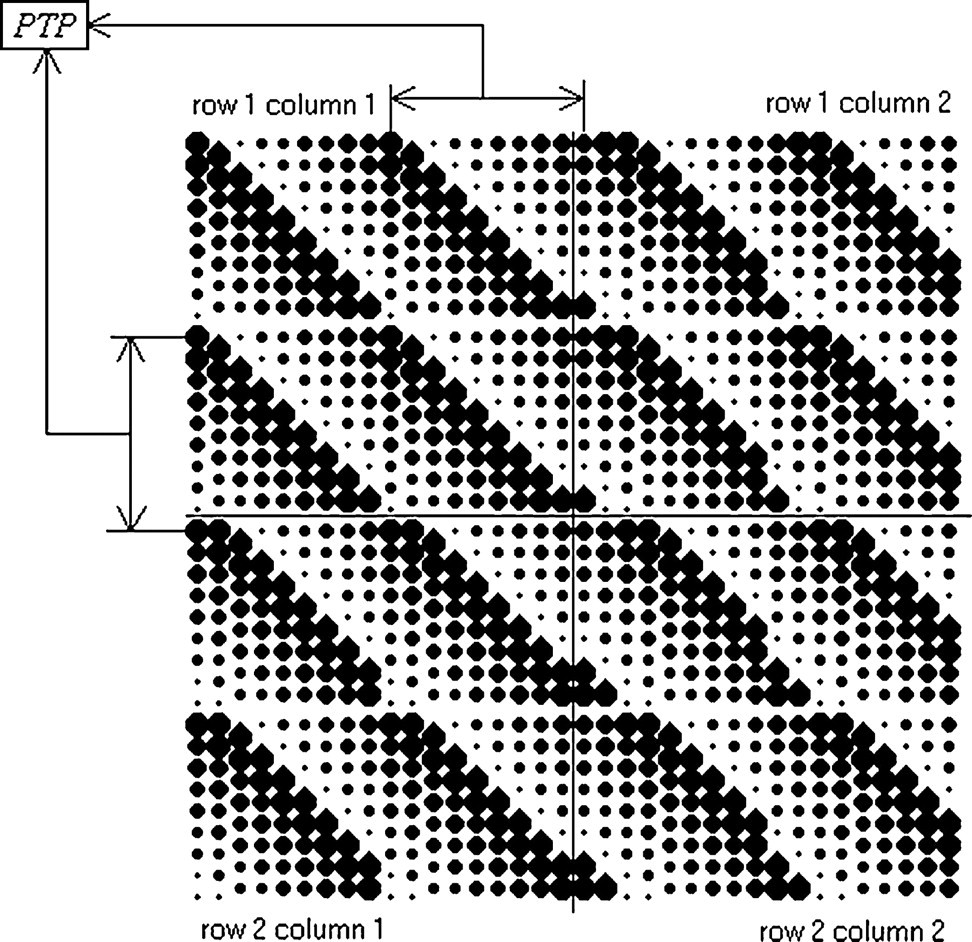
Beta blotting pattern assuming a 2 × 2 pin-array format.
Method of comparison
A summary of all constraints and parameters for the Alpha and Beta patterns is presented in Table 2. The maximum number of cycles per slide indicated in Table 2 represents the number of cycles of microarray spotting process (clean, load, blot, and spot) per blotting slide. This value essentially provides the expected walk-away time for the user.
Summary of the Constraints for Alpha and Beta Patterns
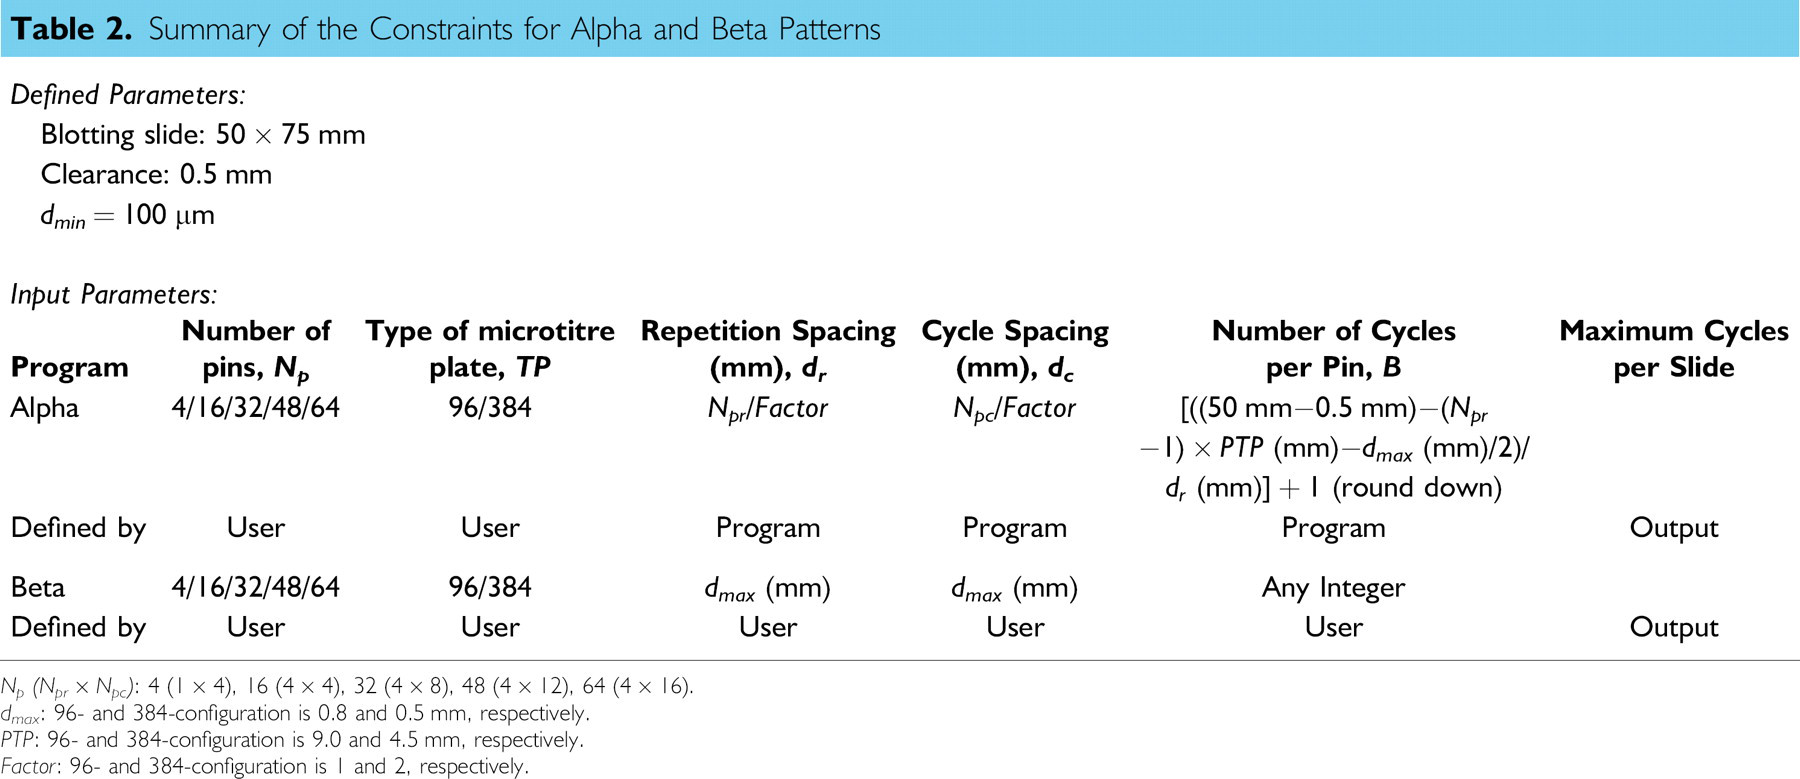
Np (Npr × Npc ): 4(1 × 4), 16 (4 × 4), 32 (4 × 8), 48 (4 × 12), 64 (4 × 16).
dmax : 96- and 384-configuration is 0.8 and 0.5 mm, respectively.
PTP: 96- and 384-configuration is 9.0 and 4.5 mm, respectively.
Factor. 96- and 384-configuration is 1 and 2, respectively.
As mentioned before, the number of cycles per pin in the Alpha pattern is calculated by the program and is restricted to certain numbers. For the purpose of comparison between the Alpha and Beta patterns, the number of cycles per pin calculated for the Alpha pattern based on formulation indicated in Table 2 was used for the Beta pattern as well. Furthermore, every possible combination of number of pins and the type of source microtitre plate were simulated to test the versatility of patterns. The optimum program must have the highest number of cycles per slide as an indication of having the maximum spot density on the slide.
Simulation results
LabVIEW software was used for developing a blotting simulation program for the comparison analysis of the two aforementioned blotting patterns. As an example, the user-interface created with LabVIEW for the Beta pattern to enter required parameters is shown in Figure 7. The user-interface slightly varies between patterns because the input parameters are different.
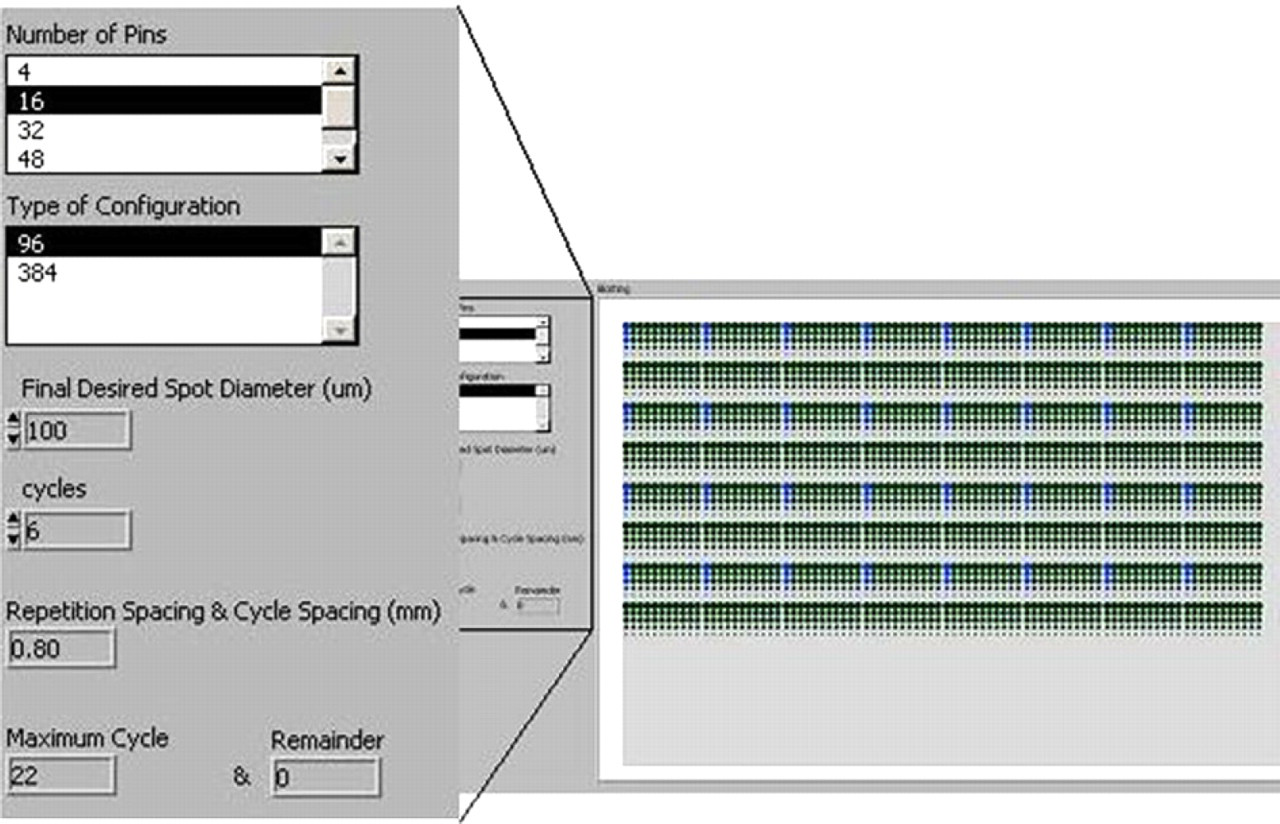
User-interface for the Beta pattern programmed with LabVIEW.
Based on the comparison method described earlier, several simulations were conducted for different types of pin-array formats and source microtitre plates. Tables 3 and 4 show simulation results for 96- and 384-well formats, respectively. In addition to the number of cycles per slide, maximum cycles per 96- or 384-well plate, which indicates the number of plates that can be blotted per blotting slide, is calculated and shown in the last column of tables. A higher value for this parameter indicates longer walk-away time.
Discussion
As indicated in Tables 3 and 4, higher values of maximum cycles per 96- and 384-well plates have been obtained for the Beta pattern in all cases. As the number of pins increases, the Beta pattern shows better performance. For instance, in the case of 96-well format and 32 pins, the Beta pattern showed 11 times increase in density of blotting spots comparing to the Alpha pattern. Therefore, the newly proposed Beta pattern can significantly improve the efficiency of blotting procedure.
Although, program-defined patterns such as Alpha are simple and easy to program, the maximum number of pins in rows and columns of a pinhead becomes limited because of the way the repetition and cycle spacing are calculated. For example, in the case of 384-well plate, more than eight pins in a row or column will eventually produce overlaps in the blotting process as indicated in Table 4, creating a constraint for further expansion of the microarray system. Therefore, program-defined parameters are only suitable for certain pin configurations, and further improvements of the program may be difficult.
However, Beta pattern includes user-defined parameters and as a result the pattern becomes more compact because the user can minimize the repetition and cycle spacing. Also, because the consecutive spots are blotted side-by-side, the speed of the procedure is maximized. Moreover, the user-defined value for the number of cycles per pin provides an advantage in selecting the minimum required number of cycles, which ensures that there is no redundancy in blotting. The user-defined parameters are flexible to accommodate a variety of pin configurations and provide the possibility for further improvements.
Conclusions and future works
Microarrays are widely used for genomic-scale analysis of genes and proteins. Pins are primarily used for the manufacturing of microarrays. However, this manufacturing method involves the time-consuming process of removing the excess solution off the pins, called blotting process. This paper investigated blotting patterns of contact-based microarrays and an optimum pattern for blotting has been proposed. The new pattern is capable of blotting higher density onto one slide, up to 11 times compared to a commercially used and patented pattern. Furthermore, the new pattern has higher flexibility and can provide faster blotting procedure. The new pattern is ready to be implemented and should improve the efficiency of microarray spotting process. For future research, simultaneous usage of multiple blotting slides can be considered which could provide greater efficiency with respect to minimizing the wastage area of blotting slides. Furthermore, variation in spot diameters per cycle can be studied further based on the characteristics of solution and the pin-based spotting phenomenon. This can be used to predict the optimal repetition spacing that would significantly increase the density of blotting.
Simulation Result of 96-Microtitre Plate Format
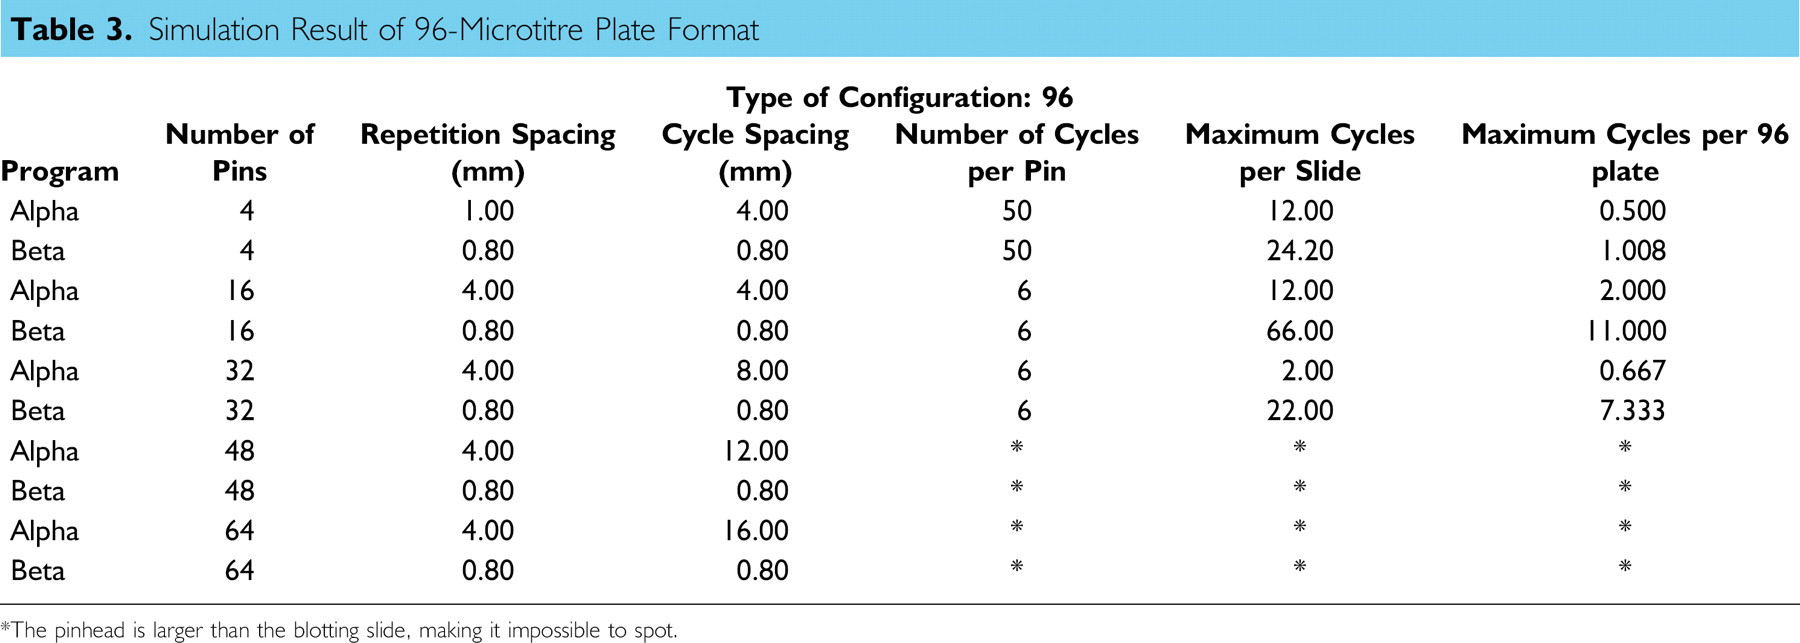
*The pinhead is larger than the blotting slide, making it impossible to spot.
Simulation Result of 384-Microtitre Plate Format
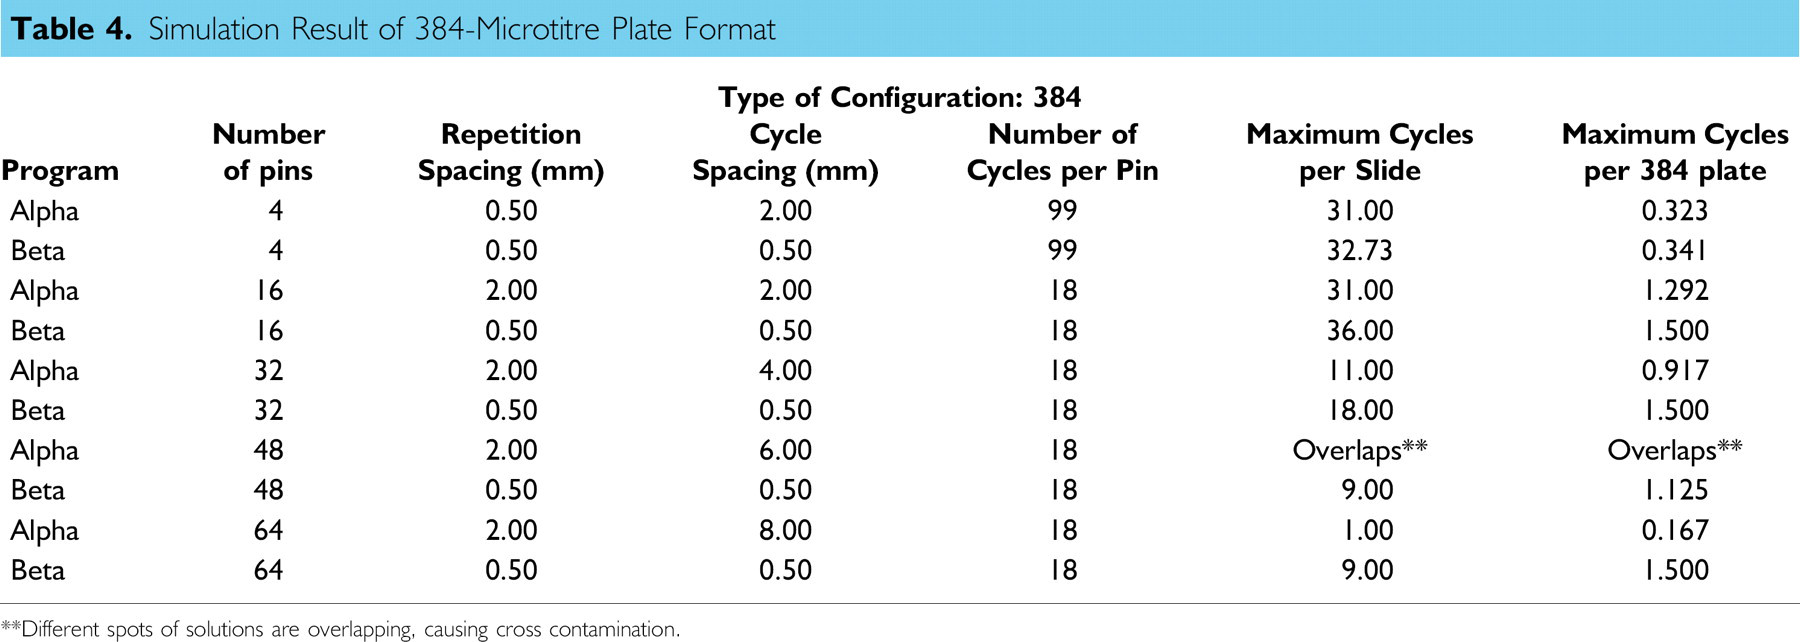
**Different spots of solutions are overlapping, causing cross contamination.