
Abstract

INTRODUCTION
The goal of microarray experiments is quantifying the relative abundance of mRNA species contained within two or more biological samples sharing homologies with cDNA or oligonucleotides spotted (printed) onto a solid surface such as glass slides or nylon membranes. Automating the process has become a critical issue due to the magnitude of different cDNAs or oligonucleotides that can now be positioned on a single array. A single slide may contain up to 10,000 different sequences. Automation becomes even more critical considering that contemporary experiments often involve multi-slide protocols containing replicate samples and multiple controls.
The current state-of-the-art utilizes an approach where each mRNA sample is reverse transcribed in the presence of a different fluorochrome-labeled dNTP and the resulting cDNAs are applied to the microarray slide. The relative binding of the labeled cDNAs is quantified by multiple scans of the slide with a laser set at the appropriate excitation wavelengths and recording an image of the slide in the emitted wavelengths. The scans are typically reported out as images in 16-bit grayscale TIFF file format. With this approach, the intensity of emitted light from an area of the slide containing spotted cDNA or oligonucleotide will be proportional to the amount of bound, fluorochrome-labeled probe over the dynamic range of the system.
Processing of the scanned images of microarray slides consists of four steps: 1) measuring the signal intensity of each of the arrayed spots, 2) assessing the reliability of the data, 3) identifying any signal anomalies which may indicate problems in array fabrication or the performance of the hybridization steps, and 4) quantifying relative transcript abundance based on these intensities. 1 A straightforward software solution for automating the first step would be superimposing a second, virtual image consisting of a grid of circles with both the same geometry as the spacing of the spots on the slide and the same diameter as the spots over the original image, followed by quantifying the pixels falling within and outside the individual circles. The former data would be the spot signals and the latter, background. The software would then package the data in a digital file format appropriate for direct import into other software packages for further analysis and data-basing. Ideally, this last step would include associating the intensity measurements with unique names identifying each of the spotted cDNA sequences.
The need for the second and third step listed above stems from complications, which occur during slide fabrication and the hybridization process. These complications require more robust automation software with the capability to provide data relating to image and spot quality. In terms of potential issues introduced during array fabrication, spot position is often inconsistent due to mechanical constraints in the spotting process. Mechanical constraints may also introduce spots with irregular shapes. Additionally, some drying rates may result in uneven distribution of the spotted sample leading to irregularities on the spot surface producing specular reflections in the image. It is also the case that extraneous signals may arise from splashes and drips of the DNA solutions occurring during printing as well as physical imperfections in glass substrate.
Adding to the problem are environmental artifacts such as dust which may be introduced at any time during fabrication or hybridization and typically appear as very bright images in scanned arrays. These artificially high signals may occur in areas of the slide distinctly separated from arrayed spots as well as directly over true spots. Finally, artifacts in the images can be introduced during the hybridization procedure. The occurrence of spots with signal intensities below that of background is often ascribed to flaws in the hybridization protocol. Given these considerations, a fully functional software package for microarray image analysis would also need to automatically identify contamination and inconsistent spot placement and shape as well as flag spots of poor quality.
IMAGE SEGMENTATION
An image in the context of a microarray is a two dimensional array of pixels corresponding to regions of the scanned microarray slide quantitized to an integer value directly related to signal intensity in that region. Image segmentation is the partitioning of a microarray image into a set of non-overlapping regions conveying some specified meaning and whose union is the entire image. For microarrays, the purpose of segmentation is to decompose a scanned optical image into regions that are meaningful in terms of spot signal versus background. Analyzing microarray images requires not only segmentation based on these definitions but also the ability to identify and exclude from subsequent analysis anomalous and artifactual signals introduced during array fabrication or the hybridization process on the fly (Figure 1), and inspect the results of the entire array once all the individual anomalies have been identified (Figure 2). The ImaGene software product (BioDiscovery, Los Angeles, CA) is a state-of-the-art package based on advanced image processing algorithms, which provides all of these capabilities.
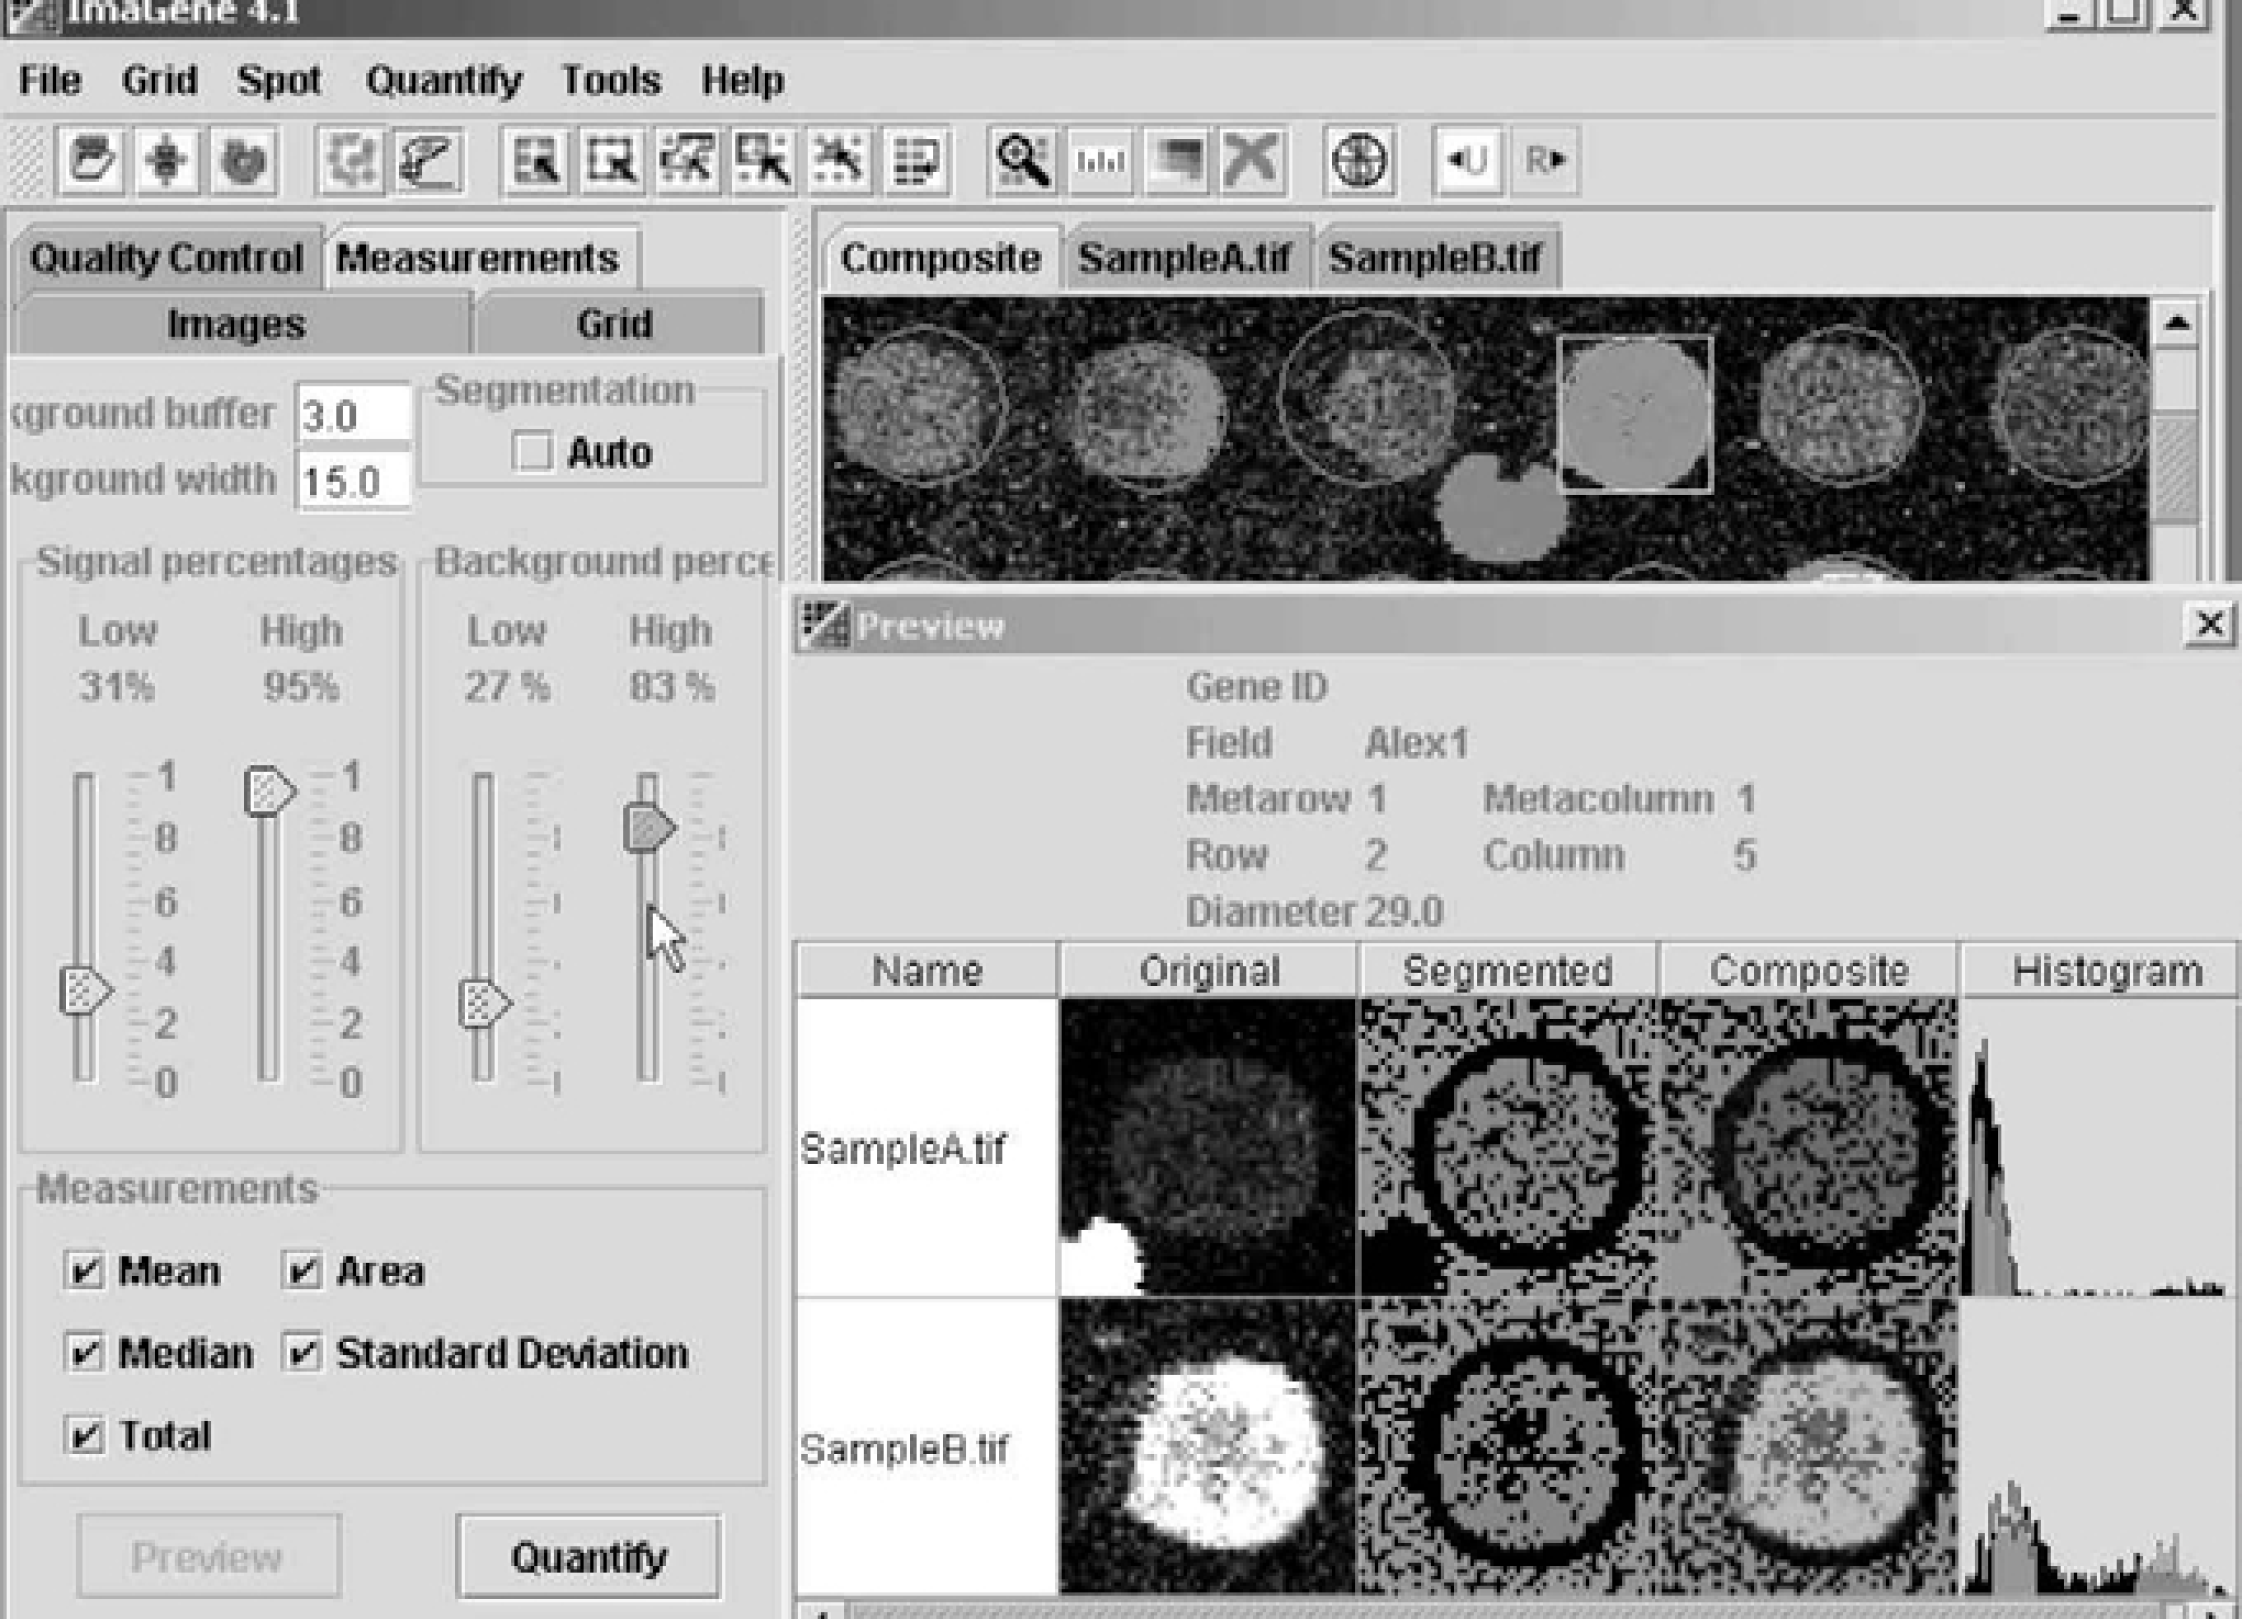
Figure 1. ImaGene's (BioDiscovery, Inc., Los Angeles, CA, USA) on-the-fly spot segmentation indicator allows for dynamic viewing of spot data during optimization. A researcher may “remove” the noise contamination from the image and clean up the data for data mining. The green color denotes pixels considered to be the background; red color denotes pixels considered to be signal. The black pixels reflect the buffer used for smoothing the transition between signal and background. Artifacts with high intensities in the background area are removed.
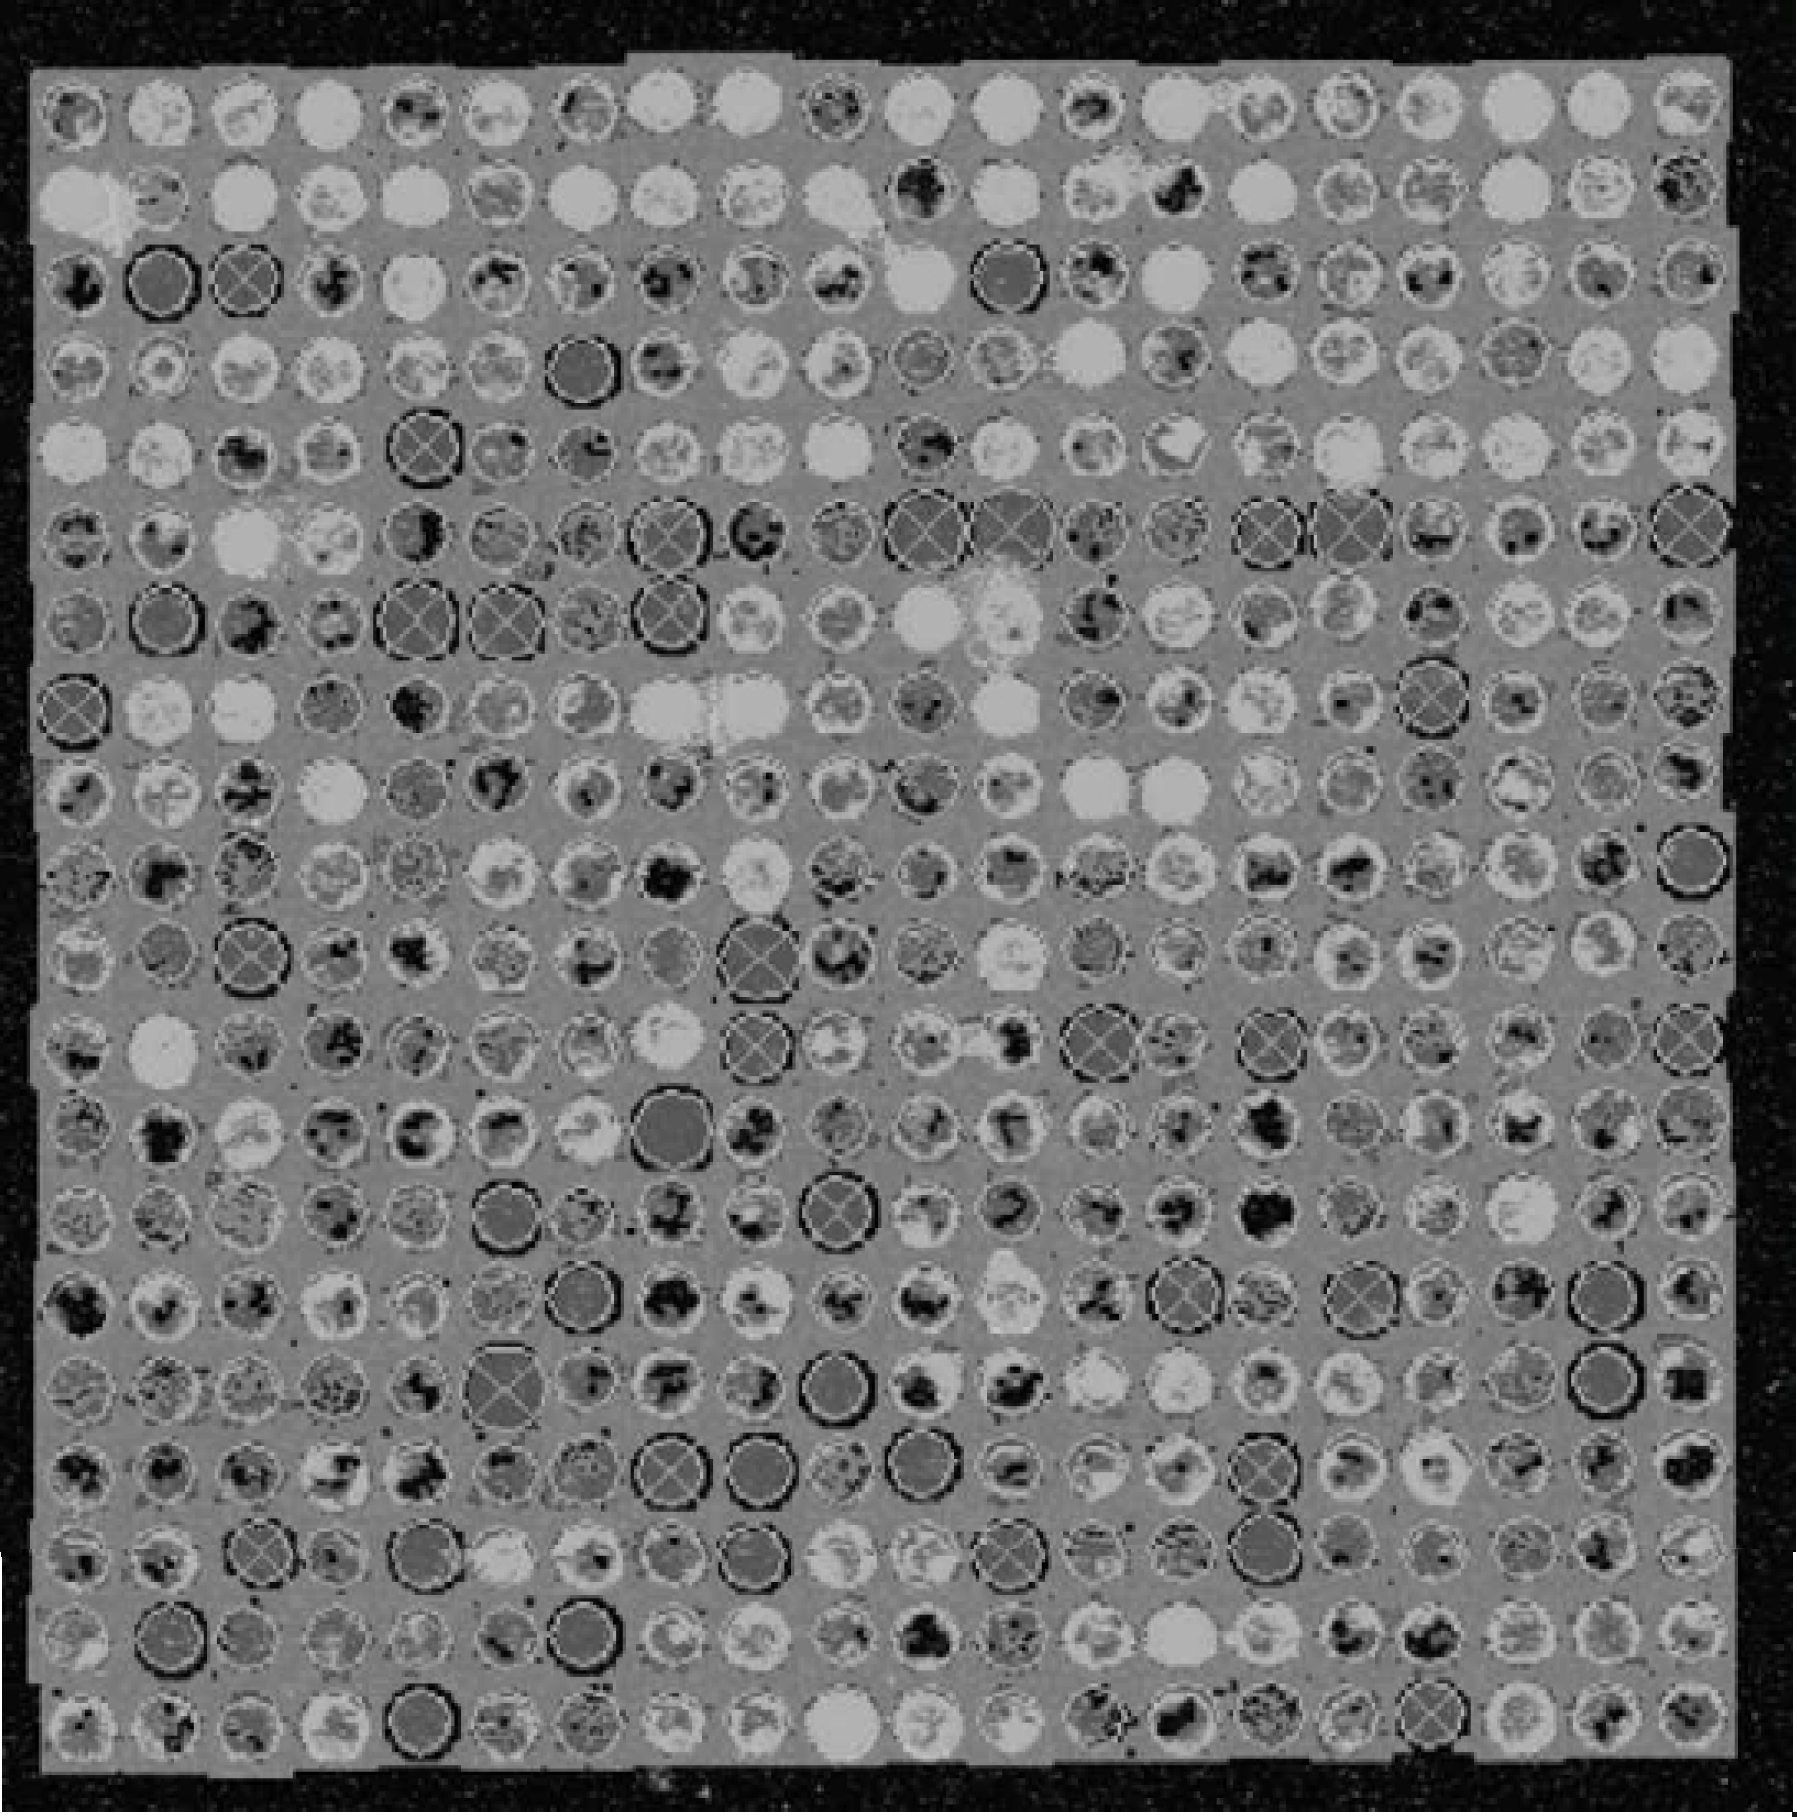
ImaGene offers global segmentation viewing of the array. One can see the segmented image and the flagged spots. The circles surrounding the spots are colored using continuous pattern from red to blue, where red color corresponds to zero confidence number (low quality) and blue corresponds to confidence number equal to one (high quality). Thresholds for both “Empty” and “Poor” spots are set by the user via a slide bar in an interactive manner. The user also has the option to flag “negative” spots, which have an overall intensity lower than that of the background. Flagged spots are crossed and a value for each category of flagging is reported. These values are used during data mining with the microarray data analysis system GeneSight™ (BioDiscovery).
QUALITY MEASURES
In any automated image processing system such as ImaGene, correct segmentation is critical to the accuracy of the signal pixel classification. In addition, correct segmentation permits a variety of quality measurements based on both the geometric properties and signal characteristics of the spots. These quality measurements, some of which are outlined below, are available in ImaGene and can be used by the researcher to use them as weights during the automatic flagging procedure for empty or poor quality spots. Additionally, the values of these quality measurements are reported individually for each spot in columns as part of the ImaGene report. They can be used to inspect performance of the printing tips, difference between arrays, and other quality control assessments. Typical quality measures are:
Spot Signal Area to Spot Area Ratio: Spot area is the sum of the recorded spot signal area and the area occupied by ignored regions caused by contamination or other factors. These ignored regions are directly connected to the signal region as shown in Figure 3. The ratio of spot signal area to spot area is therefore a measure of local contamination. More accurate statistical analyses for spot contamination can be obtained using replicate images. Unacceptable spots can be identified by plotting the data from two sub-grids (pins) against each other and evaluating any outliers.
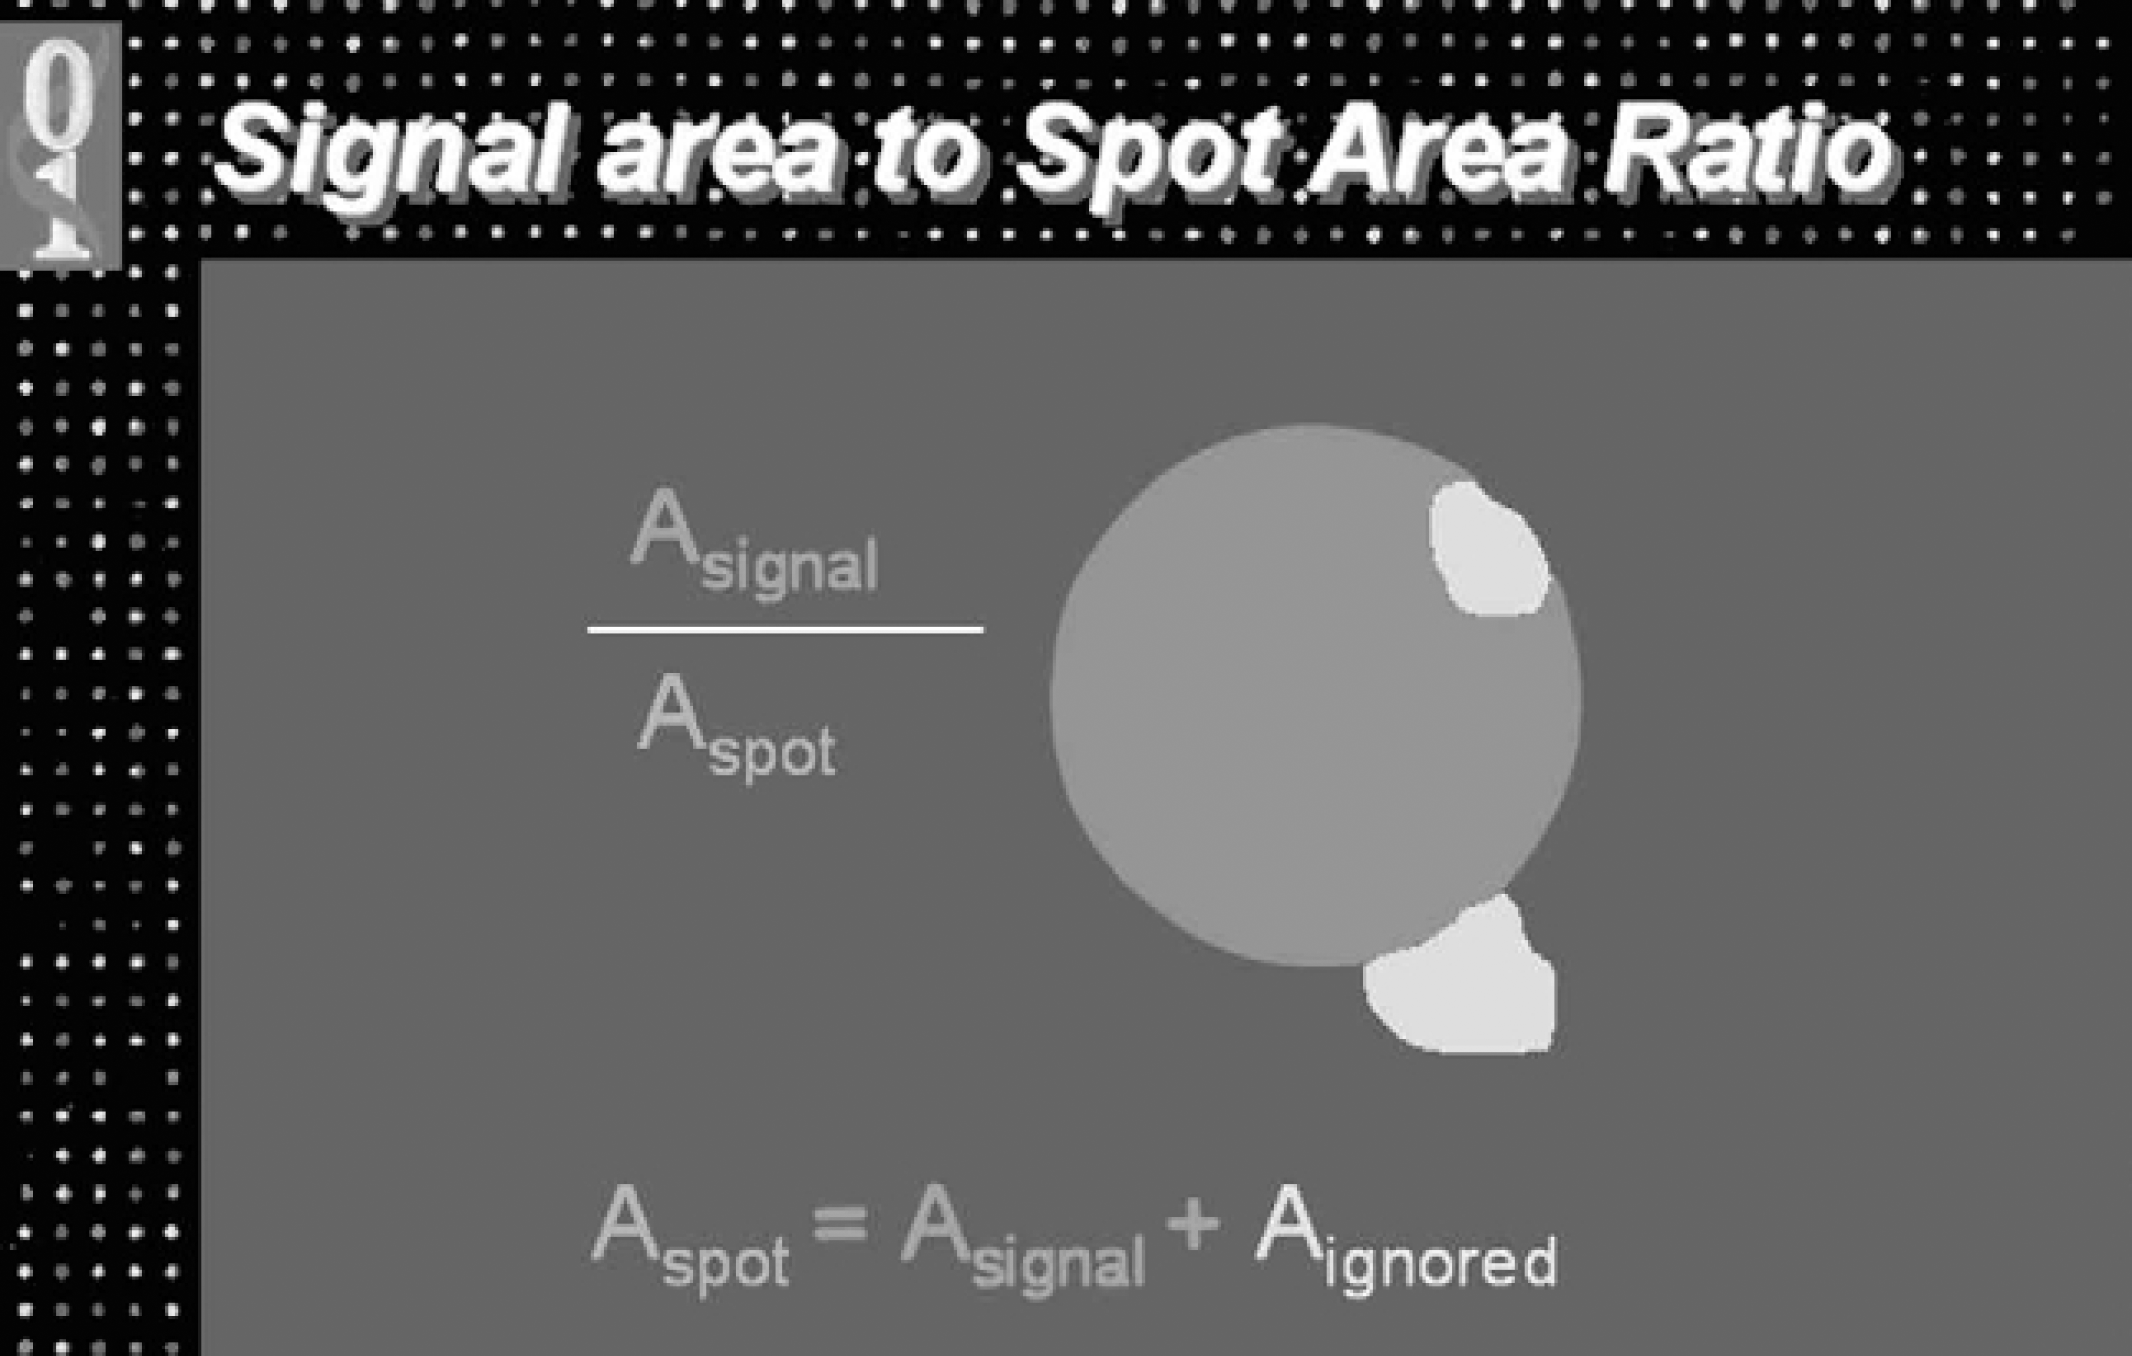
ImaGene calculates the spot area as the sum of the signal area and the ignored area (see text). The ratio of signal area to spot area is used as a quality measure for spot contamination.
Shape Regularity: The ratio of the sum of all the ignored and background pixels that fall within the virtual circle used in the spot-finding method to the area of the entire virtual circle. This ratio is a measure of how much the shape of the actual spot circle deviates from the expected circular shape. The measure will be a perfect unit if none of the background or ignored pixels appear inside the circle. On one hand, this tool can be used to measure the goodness of material placement on the slide; on the other hand it can be used to estimate how well the spot finding algorithm was applied to the grid. If the initial spot finding procedure does not perform well because of irregularities in the grid, this measure provides a clear picture where that happened and in what degree. The further the segmented signal area is from the circle position, the lower the value for this metric.
Spot Area to Perimeter Squared Ratio: The ratio of the spot area to the squared distance of the perimeter of the spot image provides an additional metric, which quantifies spot deviation from a circular shape. The metric is normalized to the interval zero to unity by multiplying the ratio by 4π. With this normalization, values closer to unity indicate an actual shape of the spot closer to a circle and therefore a better quality spot.
1 - (Offset to Grid Distance): “Offset” refers to the linear distance that the center of an actual spot (a circle as seen in Figure 1 in the image behind the Preview segmentation screen) deviates from the expected center of that spot. The expected position is computed using the grid placement algorithm. The measure is normalized to the interval from 0–1 by dividing the distance by half of the snip width (grid distance). To make a numerical value of unity for this measure correspond to a perfect match between the expected and actual position, the ratio is subtracted from one. A better correspondence between the position in which a spot is actually found and its expected position in the grid indicates a higher quality spot. Combining this measure with the Shape Regularity, which estimates the quality of the spot finding result, provides a measure of how well the signal area is positioned on the slide.
1 - (Signal Variance to Mean Ratio): This measure is the ratio of signal standard deviation and signal mean; the value of the ratio is subtracted from one for the reasons discussed in the previous measure. The metric accounts for both large variations in the signal intensity due to poor spot quality and the fact that spots with higher mean signal intensities often have numerically higher variance. The measure varies from zero to one and when using a weighted sum of the measures, gives a unique quality measure from 0 (poor) to 1 (good) as shown in Figure 4. This measure weighed equally with the Spot Area to Perimeter Squared Ratio provides a measure of overall spot quality. This metric represents the uniformity of signal intensity distribution within the spot; the other, shape quality.

Shape regularity is reflected by the ratio of the sum of all the ignored (i) and background (b) pixels that fall within the virtual circle used in the spot-finding method to the area of the entire virtual circle
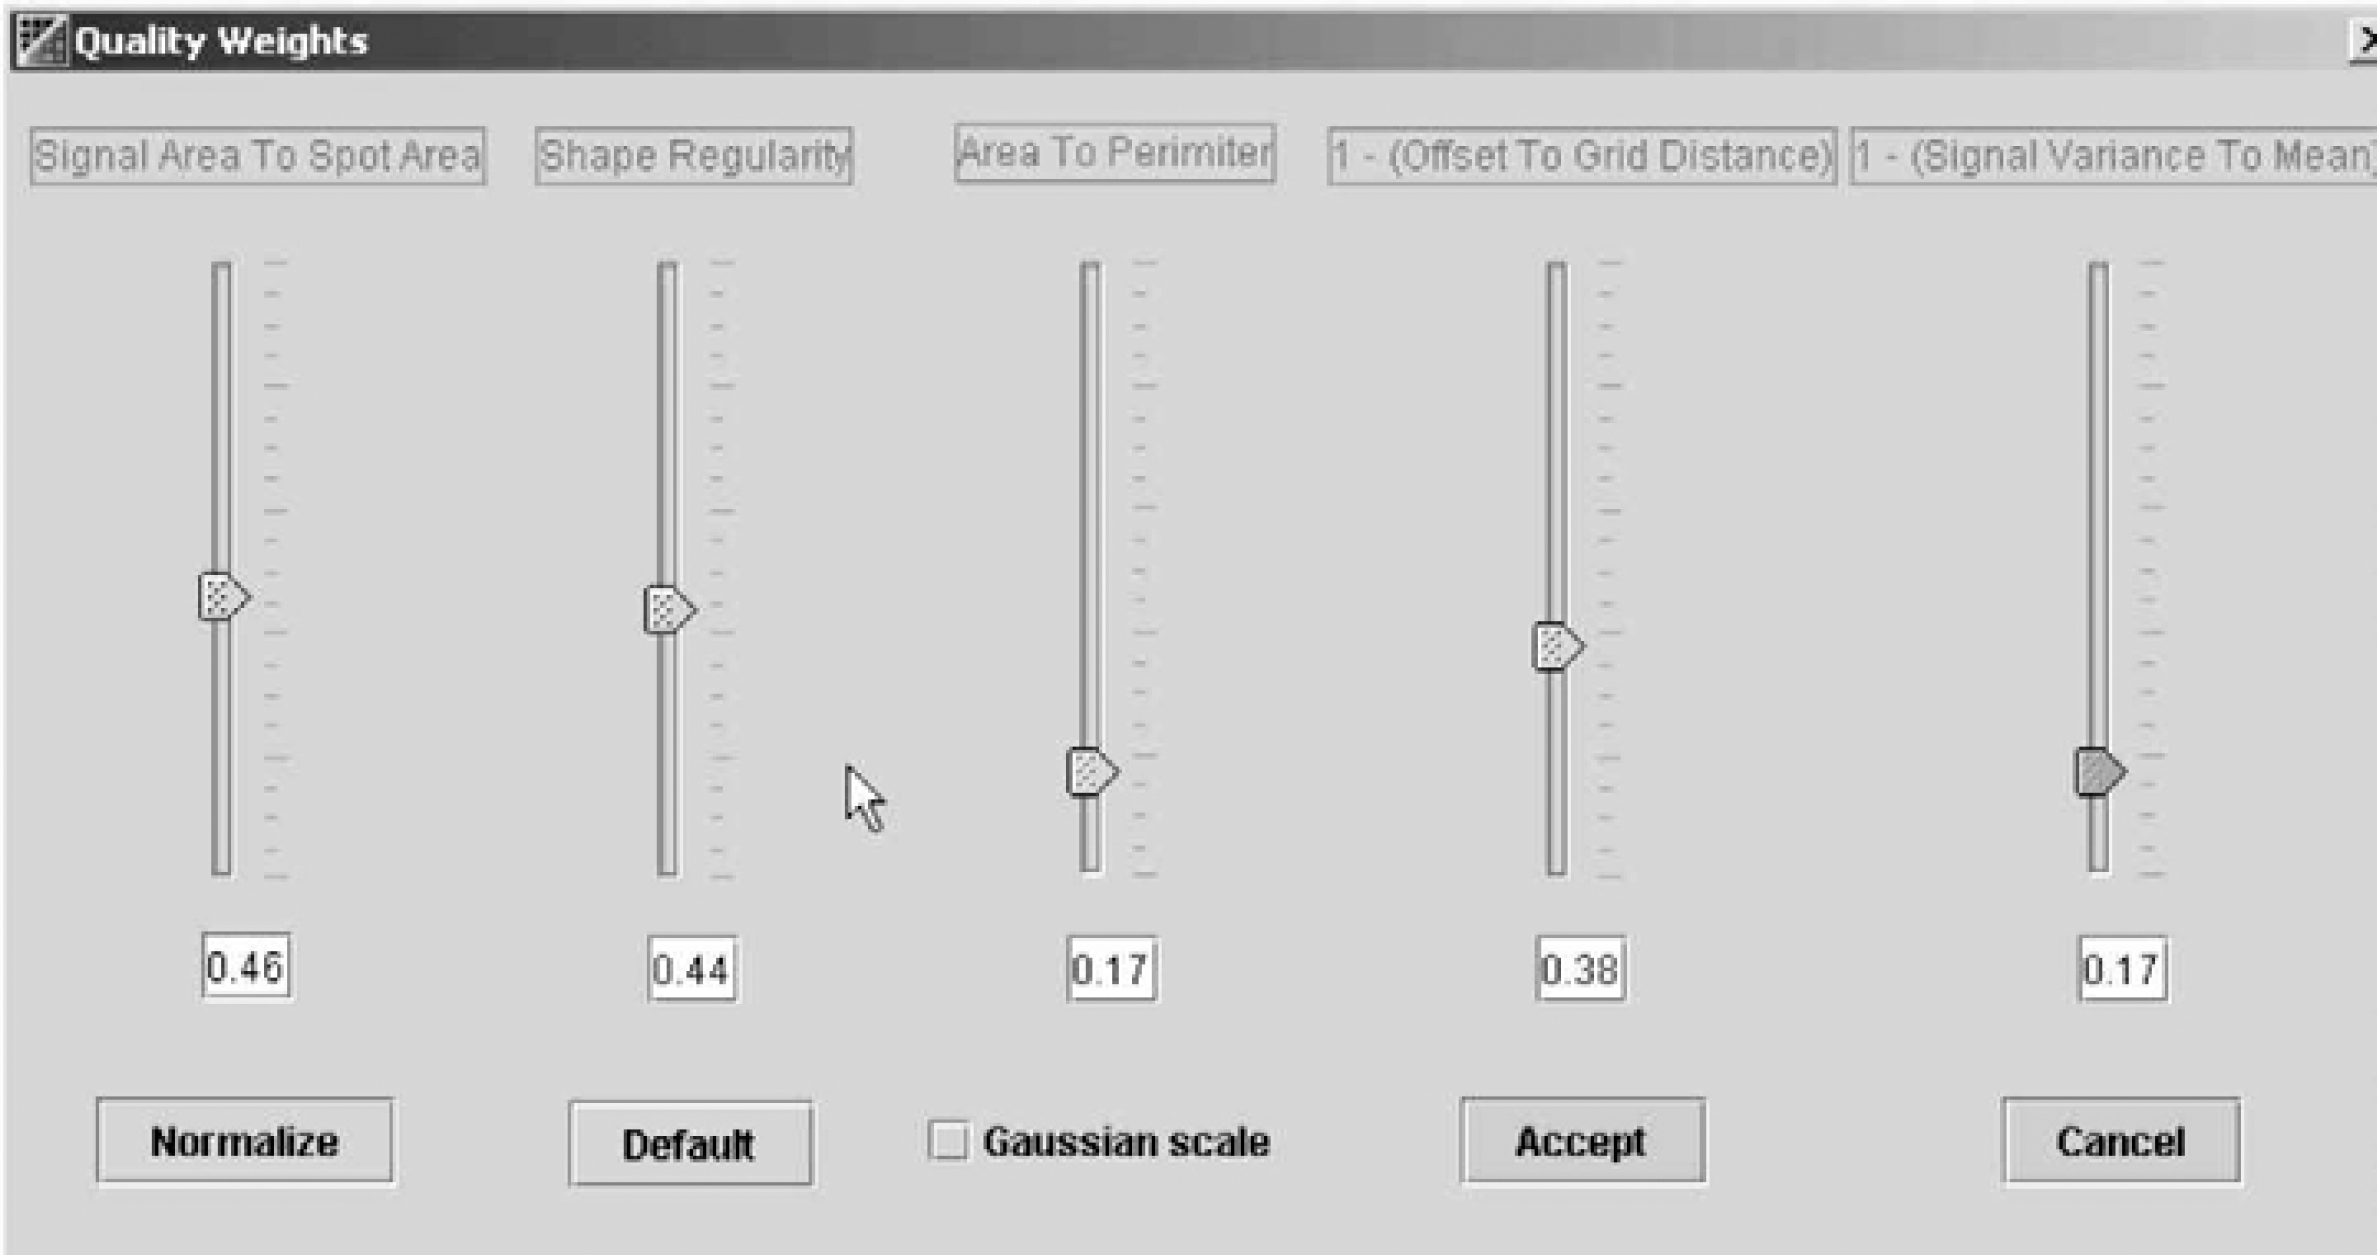
Quality measures in microarray image analysis can be used with adjusted weights during spot flagging. We can cross out those spots with quality measures lower than the threshold via an interactive slide bar. The circles around the spots are colored using a continuous pallet from red (bad) to blue (good).
ANALYSIS OF DATA CONTAINING FLAGGED SPOTS
The purpose of flagging individual spots is to identify those spotted samples the researcher desires to exclude from further analysis based upon the quality parameters relating to the image segmentation pattern of the individual spots described in the preceding sections. These data are contained in a separate column in the output file from ImaGene named “Flag” and are expressed as an ASCI character from 0–7 depending on the result. The character “0” designates spots having acceptable characteristics and the characters 1–7 indicate spots to be excluded due to automatic or manual flagging of empty, poor, and negative spots. As is the case for all the data in an ImaGene file, the data are human readable using a standard text editor.
The BioDiscovery data mining and analysis software system GeneSight™ can directly read the flagged data and automatically exclude the designated spots from subsequent analysis. Moreover, GeneSight gives the researcher control over which category of flags are to be recognized. In GeneSight, the desired settings are entered using the Data Preparation facility, which is a GeneSight window containing drag-and-drop icons representing a variety of manipulations to be applied to the data such as background correction and normalizations. Applying a specific operation to the data is accomplished by creating a transformation sequence using icons for mathematical transformations of data. In the case of flags, selecting the “Omit Flagged Spots” icon and dropping it into the transformation sequence reveals a dialog box in which the analyst enters the ASCI character for the flag to be omitted. If spots flagged with differing ASCI characters are to be excluded, the researcher simply repeats the process dropping additional “Omit Flagged Spots” icons into the transformation sequence and entering the appropriate character in the dialog boxes.
A key feature of GeneSight, which is important in evaluating the analytical consequences of omitting flagged spots, is the ability to visualize the effects of removing the spots on the data set. GeneSight provides a variety of data visualization tools such as scatter plots that can be set to depict the data in one channel as a function of the data in a second channel. Combining this feature with the data preparation feature mentioned above, the investigator could visualize any unusual trends in the flagged data by observing the effect of removing the data from flagged spots when the entire data set is presented as a scatter plot. For example, one would typically expect that the preponderance of spots to be excluded based on quality parameters also have relatively low fluorescence intensity. A deviation from this expected pattern would be easily identified using this approach. Combining the spot flagging capabilities of ImaGene with the visualization tools of GeneSight provides a powerful yet easy approach for including spot quality data in the overall analysis of mircroarray data.
SUMMARY
This article outlines a number of parameters important in analyzing the images produced after the hybridization of microarray slides as well as the features, which would be expected in a software package for automating the process. The ImaGene product provides a variety of metrics useful in assessing the quality of the data contained in the images, which come from microarray experiments for measuring relative mRNA abundance.