
Abstract
This article reports the use of Corning Epic system— a label-free and noninvasive optical system that is centered on resonant waveguide grating biosensors—to profile endogenous G protein-coupled receptors (GPCRs) in living cells under physiologically relevant conditions. The endogenous GPCRs examined were bradykinin B2 receptor in A431 cells and protease-activated receptor subtype 1 (PAR1) in Chinese hamster ovary (CHO) cells. The activation of either receptor led to Gq-mediated signaling in the respective cells, as confirmed by Fluo-3 assays. Stimulation of CHO cells with thrombin, a PAR1 natural agonist, resulted in an optical response relating to dynamic mass redistribution that is similar to that induced by bradykinin in A431 cells. Based on the kinetics of agonist-mediated optical signatures, two time points, one before and another 5 min after the stimulation, were chosen to develop high-throughput (HT) screening assays. Results showed that such endpoint measurements enable not only HT screening of compounds using endogenous GPCRs, but also determining the efficacies of agonists. Those results suggested that the Corning Epic label-free system is an easily scaleable biosensor, amenable as an HTS platform for GPCR drug discovery and deorphanization. (JALA 2006;11:181–7)
Keywords
Introduction
G protein-coupled receptors (GPCRs) are a superfamily of membrane proteins, which are involved in almost all aspects of human physiology ranging from neurotransmission to cardiovascular function.1, 2 The modulation of GPCRs is a major mechanism for modern therapeutic intervention, partly because they are addressable by small molecular medicine, and partly because they are widely implicated in the development and progression of major diseases such as cardiovascular, respiratory, gastrointestinal, neurological, psychiatric, and metabolic disorders.3, 4 GPCRs represent the single largest family of druggable targets in the human genome and have proven to be the most productive area for small molecule drug discovery.5–8 Screening drugs against this class of protein targets is still a major effort in pharmaceutical and biotech industries, driven by the fact that the current GPCR-based drugs only target ~25% of the approximately 200 known GPCRs 5 ; and there are increasing numbers of GPCR targets due to the completion of the human genome project. 9
The primary function of GPCRs is to transduce extracellular information into intracellular signals through activation of heterotrimeric G proteins and dynamic interactions with intracellular proteins. Ligand binding to a GPCR mediates a series of spatial and temporal events that govern the cell responses, leading to an ordered, regulated, and dynamic redistribution of cellular contents.10–13 Monitoring such dynamic redistribution should provide an insight into GPCR signaling and a powerful means for GPCR screens.14–16 Following the studies on signaling mediated through epidermal growth factor receptor, 17 as well as endogenous bradykinin B2 receptor 18 in human epidermoid carcinoma A431 cells, we have developed a noninvasive cell-based assay technology based on the recording of dynamic mass redistribution (DMR) using resonant waveguide grating (RWG) biosensors. The DMR signal measured correlates with stimulation-induced dynamic redistribution of cellular contents within the bottom portion of adherent cells. This technology has been applied to study the kinetics, signaling pathways, and network interactions of B2 receptor in A431 cells. 18 Because the DMR responses induced by B2 agonists proceed for a prolonged period of time (tens of minutes), the suitability of this technology for high-throughput (HT) screening still remains to be demonstrated. In this article, we examine the feasibility of Corning Epic label-free system to profile and screen compounds against endogenous GPCRs in living cells in an HT fashion, and discuss how to adapt this technology for HT screening.
Materials and Methods
Reagents
Thrombin was purchased from Sigma Chemical Co. (St. Louis, MO). Fluo-3 was obtained from Molecular Probes (Eugene, OR). Bradykinin, HOE140, desArg 10 -HOE140, and YFLLRNP were obtained from Bachem (King of Prussia, PA). Corning Epic 384-well biosensor microplates were obtained from Corning Inc (Corning, NY) and cleaned by exposure to high-intensity UV light (UVO-cleaner, Jelight Company Inc., Laguna Hills, CA) for 6 min before use. In the sensor microplate, each well contains an RWG sensor consisting of a thin film of dielectric material on the grating-presenting substrate.
Cell Culture
Both human epidermoid carcinoma A431 cells and Chinese hamster ovary (CHO-K1) cells were obtained from American Type Cell Culture. For culturing, A431 cells were grown in Dulbecco's modified Eagle's medium (DMEM) supplemented with 10% fetal bovine serum (FBS), 4.5 g/L glucose, 2 mM glutamine, and antibiotics. Cells, ~1–2 × 10
4
, at passages 3–5 suspended in 50 μl of the growth medium were placed in each well. After cell seeding, the cells were cultured at 37 °C under air/5% CO2 until ~95% confluency was reached (~2–3 days). For culturing CHO cells were grown in Kaighn's modification of Ham's F12 medium (F-12K) supplemented with 10% FBS, 2 mM
Fluo-3 Ca2+ Mobilization Assay
CHO cells at passages 3–5 were grown in Costar 96-well clear cell culture microplates (Corning Inc, Corning, NY) until ~95% confluency, washed twice with 1× HBSS (1× regular Hank's balanced salt solution, 20 mM HEPES buffer, pH 7.0) in the presence of 2.5 mM probenicid, and labeled in the same buffer containing 4 μM Fluo-3 for 1 h at room temperature. The cells were then washed twice with the HBSS, and maintained with 100 μl HBSS containing 2.5 mM probenicid. The assay was initiated by transferring 100 μl thrombin solution to the cell plate and calcium signal recorded over 6 min with a 6 s interval using HTS7000 Bio-Assay Reader (PerkinElmer Life Science, Boston, MA). The assays were carried out at room temperature to allow direct comparison with optical sensing data.
Corning Epic Label-Free Optical System and DMR Assays
Instead of the angular interrogation system previously used,17–19 the Epic label-free, wavelength interrogation system with transverse magnetic or p-polarized TM0 mode was used in this study. For DMR assays, the cells in each well were maintained in the DMEM medium of 40 μ and pretreated with a compound solution of 10 μl or 1× HBSS until a steady phase (i.e., no obvious mass redistribution) was reached (generally within 1 h), before GPCR agonist solution of 10 μl was introduced. All studies were carried out at room temperature with the lid of the microplate on except for a short period of time (~seconds) when the solution was introduced, to minimize the effect of temperature fluctuation and evaporative cooling.
Results and Discussions
Corning Epic System for HTS
The Epic System is centered on RWG biosensors, which are integrated in standard SBS microtiter plates (primarily 384-well microplates). The surfaces of sensors in microplates are modified readily to enable direct coupling of receptors for affinity-based biochemical assays, or appropriate cell attachment and growth for cell-based assays. The cell culturing and handling is not automated, because of the lack of such capability in-house.
As shown in Figure 1a, this system is a stand-alone system and consists of a temperature-control unit, an optical detection unit, and an onboard liquid-handling unit with robotics. The temperature-control unit is built in to minimize temperature fluctuation if any. Inside this unit, there are two side-by-side stacks for holding both the sensor microplates and compound source plates. Once stable temperature is reached, a sensor microplate is transferred by the robotics into the plate holder right above the detection system, whereas a source plate is moved to an appropriate compartment so that it is readily addressable by the onboard liquid-handling unit.
A label-free system for HT screening compounds against endogenous GPCRs. (a) Corning Epic System. (b) The light path and principle of an RWG biosensor for cell-based assays.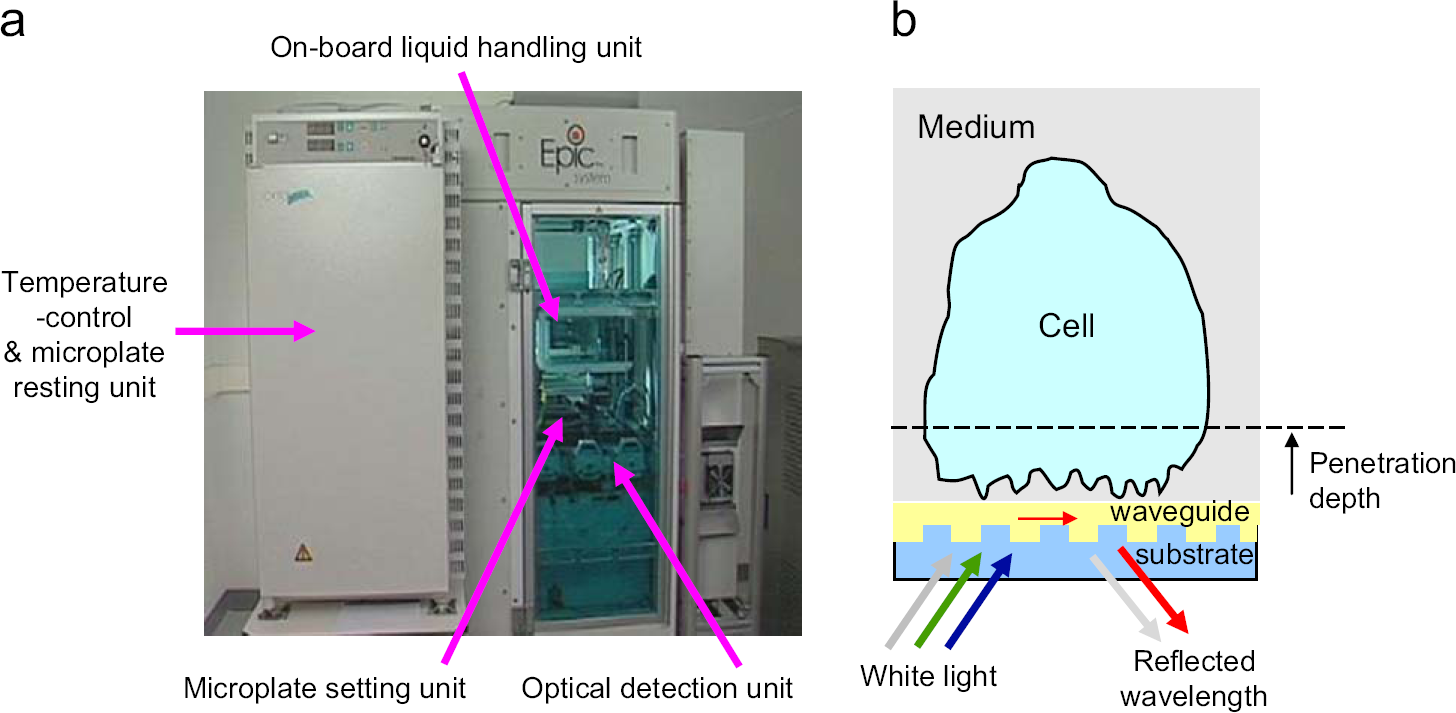
The detection unit is centered on integrated fiber optics to measure the wavelength shift of the resonant lights due to the ligand-induced DMR in living cells. As illustrated in Figure 1b, a broadband white light source, generated through a fiber optic and a collimating lens at nominally normal incidence through the bottom of the microplate, is used to illuminate a small region of the grating surface. A detection fiber for recording the reflected light is bundled with the illumination fiber. A series of illumination/detection heads is arranged in a linear fashion, so that reflection spectra are collected from a subset of wells within the same column of a 384-well microplate at once. The whole plate is scanned by the illumination/detection heads so that each sensor can be addressed multiple times, and each column is addressed in sequence. The scanning could be continuous or discontinuous depending on the assay formats. The wavelengths of the reflected lights are collected and used for analysis.
For kinetic assays, a baseline response is recorded first for a given period of time. Afterward, compound solutions are transferred into the sensor plate using the onboard liquid-handling system, and the cell responses are then recorded for another period of time. The lid of the sensor microplates is on most of the time throughout the assay, except for a short period of time (~2 min) when the compounds are introduced. The plate lid is handled automatically by the robotics. Such kinetic measurement provides useful information for GPCR signaling and its network interactions. 18
For endpoint assays, a baseline reading is obtained by scanning the sensor plates several times (< 1 min). Afterward, the compounds are introduced into the sensor plate through either the onboard system or an offline automated liquid-handling system. A final reading is carried out at an appropriate time after compound addition. The difference in wavelength between the two endpoints is used to examine the effect of compounds on living cells. Alternatively, the cells in each well are pretreated individually with a compound for about 1 h and then stimulated with an agonist for a specific GPCR. Two endpoints, right before and after the agonist stimulation, are measured. The difference in wavelength is used to screen modulators (e.g., GPCR antagonist or pathway modulators) against the agonist-targeted receptor and its signaling cascades. The time to assay a 384-well microplate can be completed within 3–5 min. Because the final commercial system will not have an onboard liquid-handling system, we are particularly interested in whether an offline automated liquid-handling step can be integrated into the assays. If feasible, potential customers can implement their in-house liquid-handling system into HTS applications using the Epic System.
Bradykinin-Induced DMR Signals in A431 Cells
The vasoactive nonapeptide bradykinin has been implicated in the regulation of a wide variety of physiological and pathophysiological responses, including vascular permeability, inflammation, pain, and neurotransmitter release.
20
Two bradykinin receptors, B1 and B2, have been identified so far, and B2 receptor is believed to account for most of the physiological and pathophysiological actions of bradykinin.
21
A431 is known to endogenously express B2, but not B1 receptor.
22
B2 receptor is either mitogenic or antimitogenic, depending on the experimental conditions.
23
Previously, we
18
and others
22
had found that B2 signaling in A431 is dependent on the cellular states and the doses of bradykinin. In proliferating states, low doses (< 100 nM) of bradykinin trigger Gs-mediated signaling, whereas high doses (>100 nM) of bradykinin favor Gq-signaling. On the other hand, bradykinin between 0.5 and about 100 nM mediated both Gs- and Gq-pathways in quiescent A431 cells obtained with 0.1% FBS for about 20 h.
18
Here, we were particularly interested in the optical responses of fully quiescent A431 cells, obtained with the DMEM medium in the absence of any FBS or other growth factors for 20 ± 2 h. Stimulation of such quiescent cells with bradykinin at doses examined led to cellular responses that are dominated by Gq-mediated signaling (data not shown). Figure 2a showed classical Gq-mediated signaling through a GPCR. As expected, stimulation of the fully quiescent cells with bradykinin led to a typical Gq-type optical signature (Fig. 2a), which consists of a phase of rapid increase (P-DMR), and a subsequent phase of decrease (N-DMR) (as indicated in Fig. 2c). The amplitudes of the P-DMR event were saturable to bradykinin at concentrations up to ~64 nM, resulting in an EC50 of 9.2 ± 1.7 nM ( The Gq-signaling pathway and its optical signature. (a) Typical Gq-mediated signaling through Gq-coupled receptors (e.g., B2 and PAR1) starts with agonist binding, followed by activation of the receptor, its coupled G protein, and its downstream target phospholipase C (PLC) to hydrolyze the membrane lipid phosphatidylinositol bisphosphate (PIP2), producing inositol triphosphate (IP3) and diacylglycerol (DAG). Water-soluble IP3 diffuses through the cytoplasm to the ER, where it binds to and opens a calcium channel, releasing calcium stores from inside the ER into the cytoplasm. Calcium alters many cellular processes, in part by binding to regulatory proteins such as calmodulin. The interaction of both DAG and calcium with PKC activates its kinase activity, which, in turn, phosphorylates many different protein targets. (b, c) The DMR responses of quiescent A431 cells induced by bradykinin at low doses and at 100 nM, respectively. The solid arrows indicate the time when the bradykinin solution is introduced. The points A and B in (c) indicate the two time points that are chosen for endpoint measurements.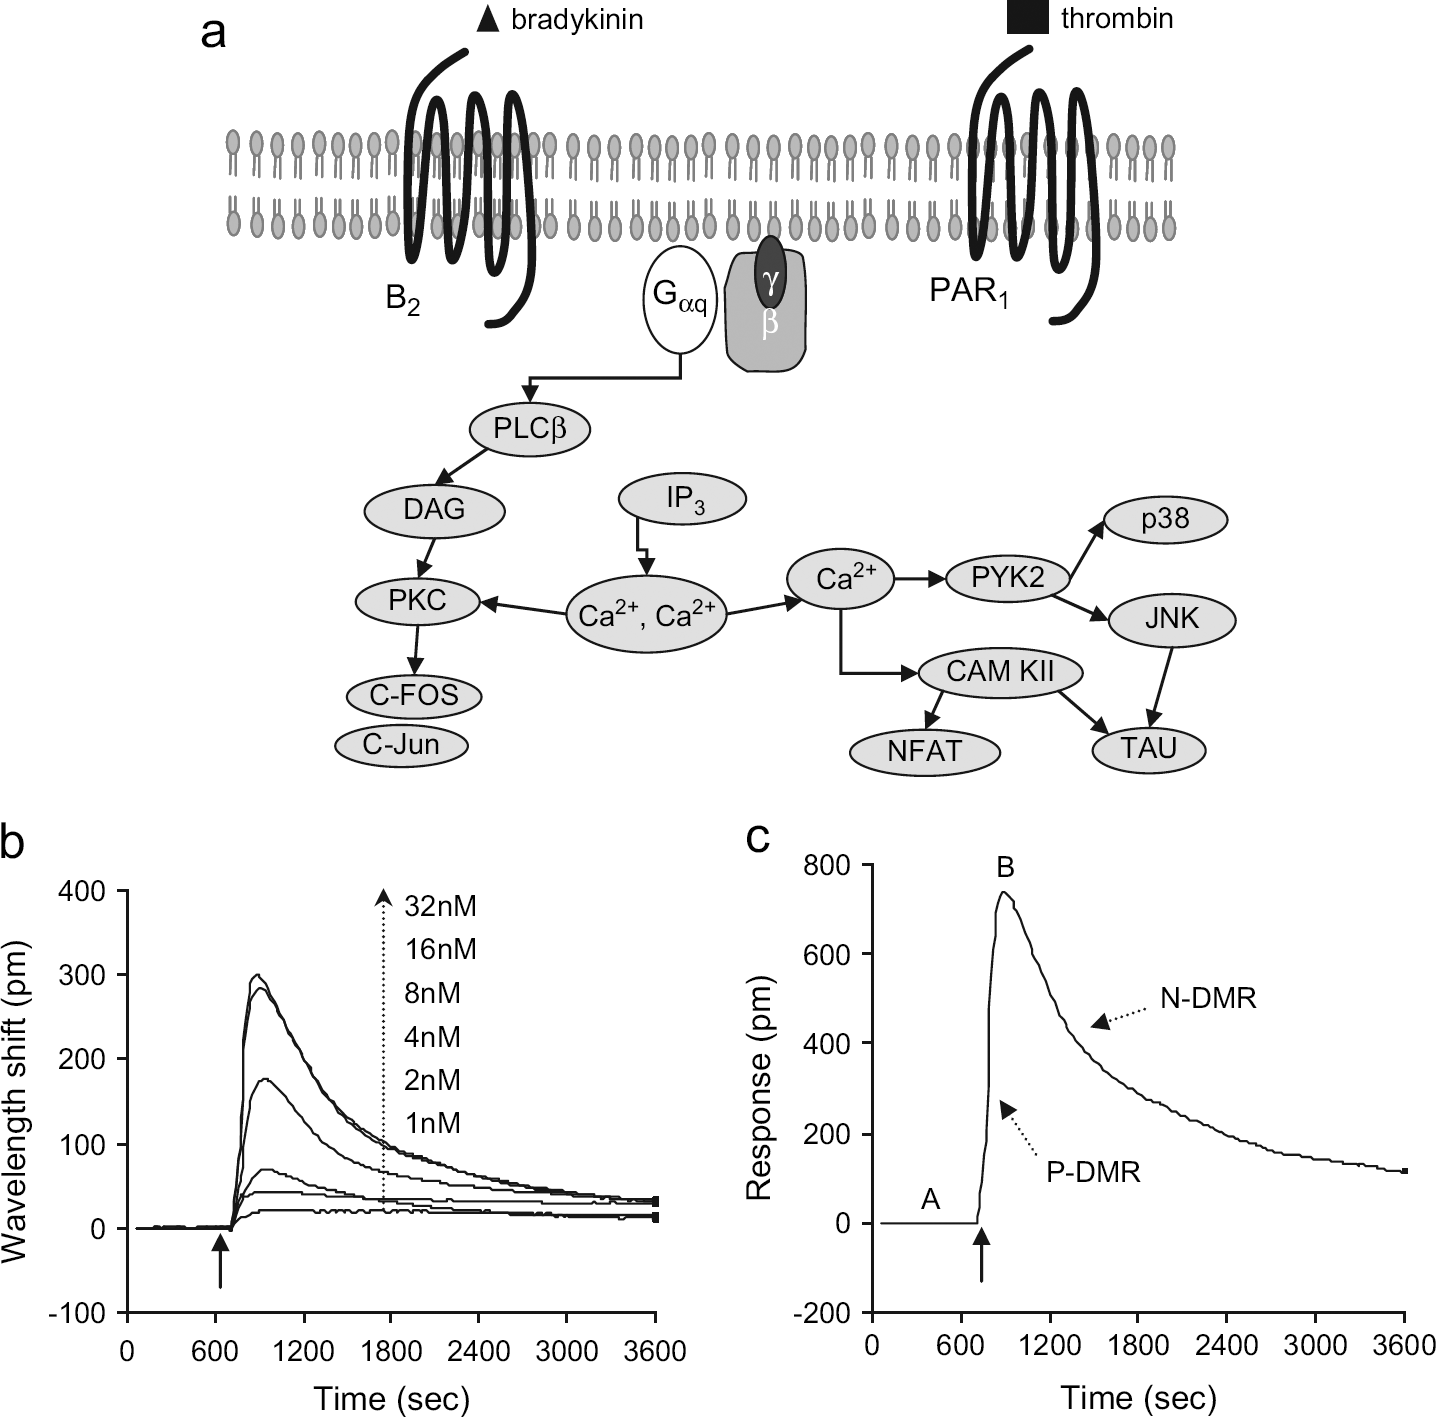
Thrombin-Induced DMR Signals in CHO Cells
Thrombin is a serine protease that can site-specifically cleave protease-activated receptor subtype 1 (PAR1) within its extracellular N-terminal exodomain. The cleavage unmasks a new N-terminus, which, in turn, acts as a tethered ligand sequence. The tethered ligand domain binds intramolecularly to and activates the receptor, thus initiating the signaling.
25
PAR1 is known to be endogenously expressed in CHO cells.
26
Stimulation of CHO cells with thrombin resulted in an elevation of intracellular Ca2+ level, as being measured with Fluo-3 assays (Fig. 3a). The EC50 was found to be 12.3 ± 2.0 unit/mL ( The comparison of thrombin efficacy. (a) The increase in intracellular Ca2+ level, manifested by the change in fluorescence intensity of Fluo-3, as a function of thrombin concentration. (b) The DMR responses of CHO-K1 cells induced by thrombin. (c) The amplitude of the P-DMR events as a function of thrombin concentration. The solid arrow indicates the time when the thrombin solution is introduced.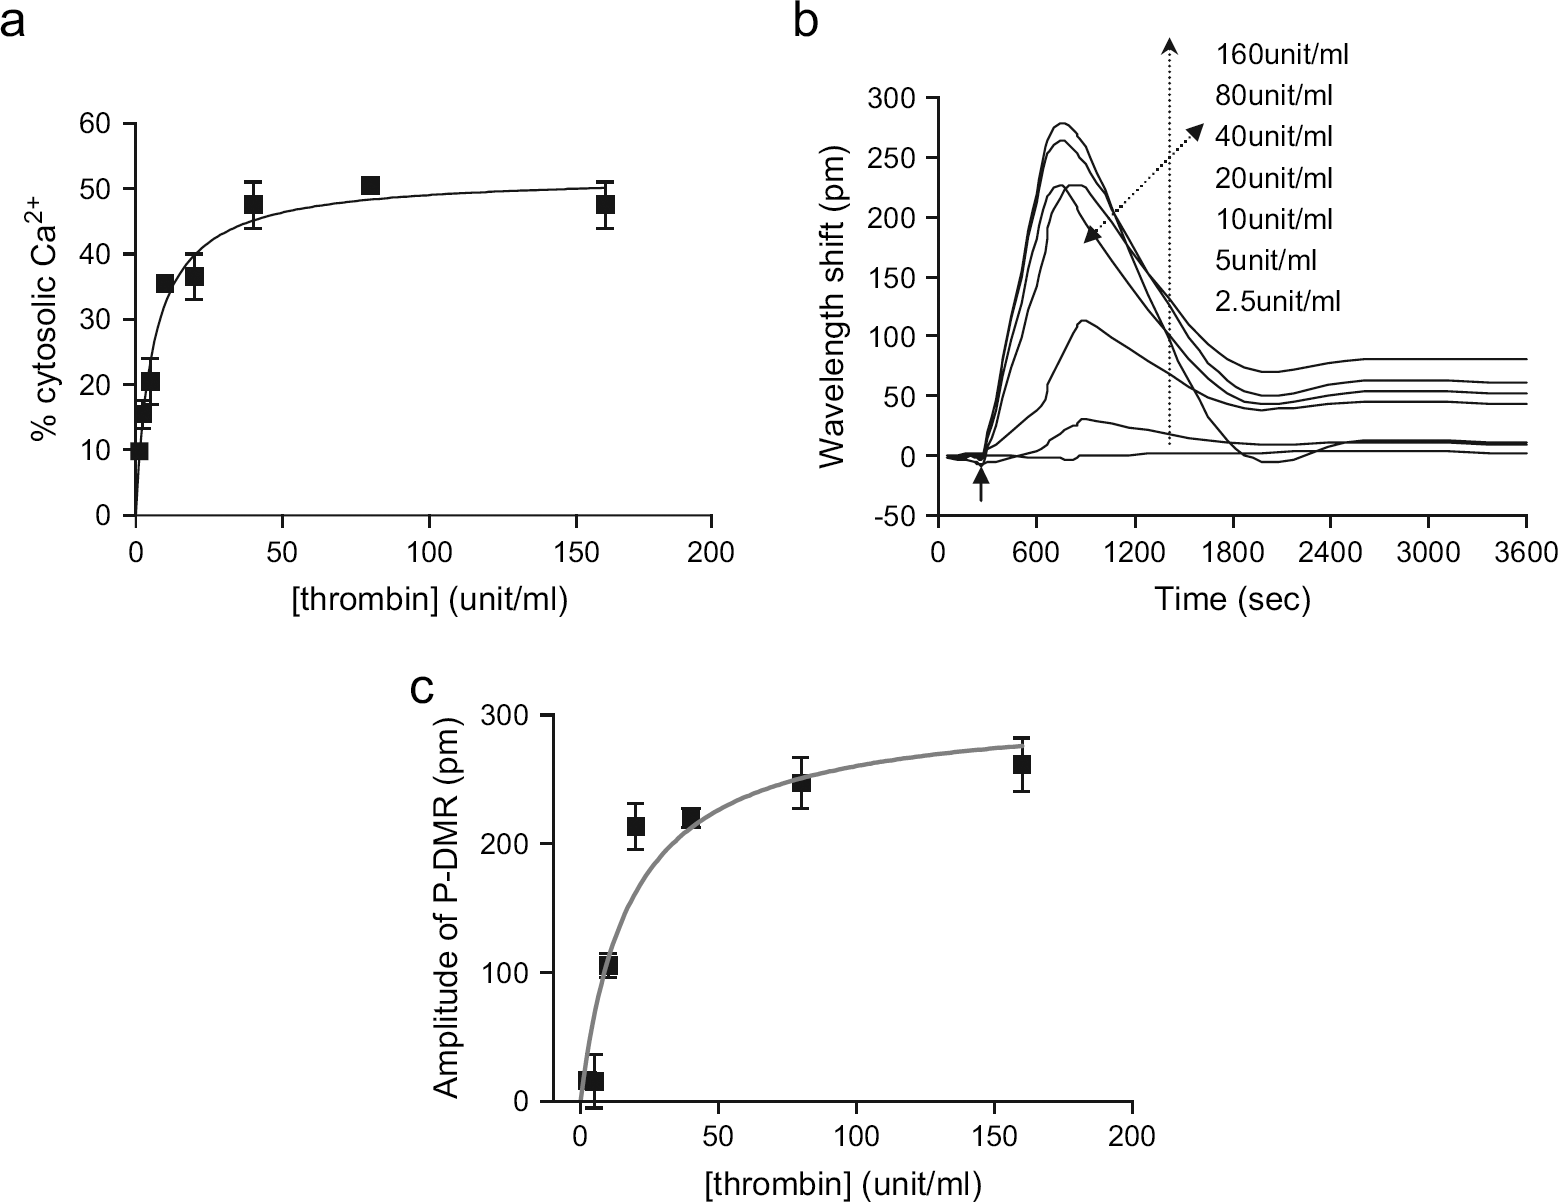
As expected, thrombin triggered a DMR signal in a dose-dependent manner in CHO cells (Fig. 3b). The overall dynamics of the thrombin-induced DMR signals in CHO cells is similar to that of the bradykinin-induced responses in A431 cells, suggesting that the Gq-type optical signature initially observed in A431 cells is universal, at least in both cell lines. The nonlinear regression analysis suggested that the optical responses are saturable to thrombin; its saturation curves fit well with one-site binding model (Fig. 3c). The EC50 value obtained was found to be 17.5 ± 2.2 unit/mL, consistent with that obtained with Fluo-3 assays. Furthermore, the pretreatment of CHO cells with 243 μM YFLLRNP, a low-affinity PAR1-specific partial agonist, 27 almost completely blocked the DMR responses induced by 40 unit/mL thrombin (data not shown), suggesting that the thrombin-induced responses are specific to the activation of PAR1.
Endpoint Measurements Enable HTS
Because the optical responses induced by both GPCR agonists progress for quite a long time (~tens of minutes), kinetic measurements appear not amenable for HTS applications. Next, we examined the feasibility of endpoint measurements for HTS applications. Based on the overall dynamics and characteristic kinetics of both P-DMR and N-DMR events induced by either of GPCR agonists, as well as the saturability of the P-DMR amplitude to the agonist concentration, we chose two time points—one before and another 5 min after the addition of the agonist solution. The difference in wavelength between the two endpoints was used as a readout for the agonist-induced responses. An offline-automated liquid-handling step was used to introduce the compound solutions.
For quiescent A431 cells, half of the wells in a 384-well microplate were treated with 100 nM bradykinin, whereas another half of the wells were treated with the HBSS buffer only. The differences in wavelength between the two endpoints were plotted as a function of the well (Fig. 4). Results showed that excluding a well containing a bad sensor, the average wavelength shift induced by bradykinin was found to be 785 ± 46 pm ( The bradykinin-induced wavelength shift in reflected light of each sensor having quiescent A431 cells in comparison with the vehicle (i.e., HBSS)-induced wavelength shift (negative control). The broken graycircle indicates a bad sensor.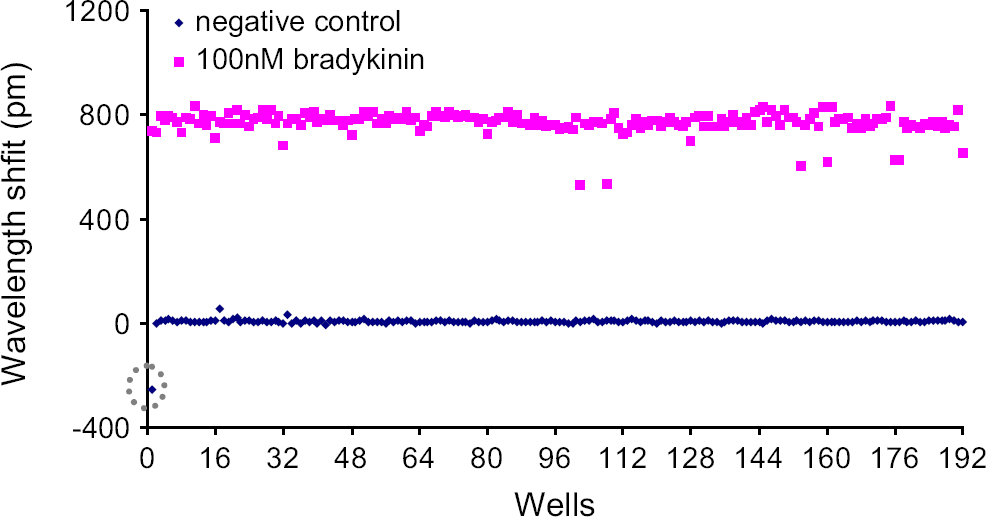
Similarly, for CHO cells, except for the two columns of a 384-well microplate that were treated with thrombin at different doses, half of the rest of the wells were treated with 40 unit/mL thrombin and another half with the HBSS. As shown in Figure 5, the average wavelength shift induced by thrombin was found to be 269 ± 19 pm ( The thrombin-induced wavelength shift in reflected light of each sensor having CHO-K1 cells in comparison with the vehicle (i.e., HBSS)-induced wavelength shift (negative control). The broken gray circle indicates a bad response, probably due to variability in liquid handling.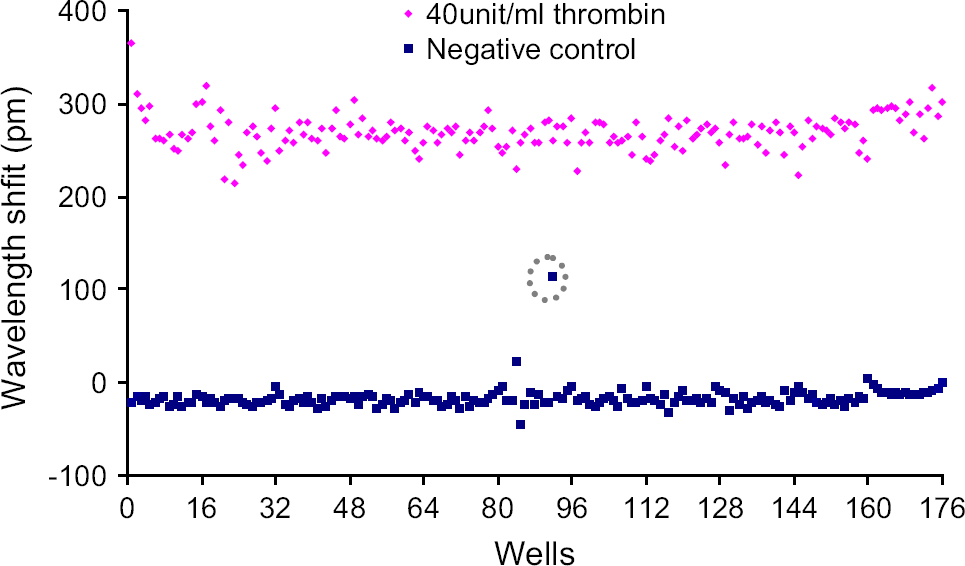
Interestingly, the endpoint measurements also enable the determination of thrombin efficacy. Again, the difference in wavelength between two time points—one before and another 5 min after the addition of the agonist solution—is used to quantify the cell response induced by thrombin at different doses. As shown in Figure 6, thrombin dose dependently increased the wavelength shift until it reaches a steady elevated value, leading to a typical saturation curve with an EC50 of 12.5 ± 5.1 unit/mL. The EC50 values obtained were consistent with those obtained using the kinetic measurement (Fig. 3c), as well as Fluo-3 assays (Fig. 3a). These data also suggested that the offline liquid-handling step can be applied for such endpoint measurements, opening the door for customers to combine their own liquid-handling systems with the Epic System for HTS applications.
The wavelength shift in reflected light of each sensor having CHO-K1 cells as a function of thrombin concentration.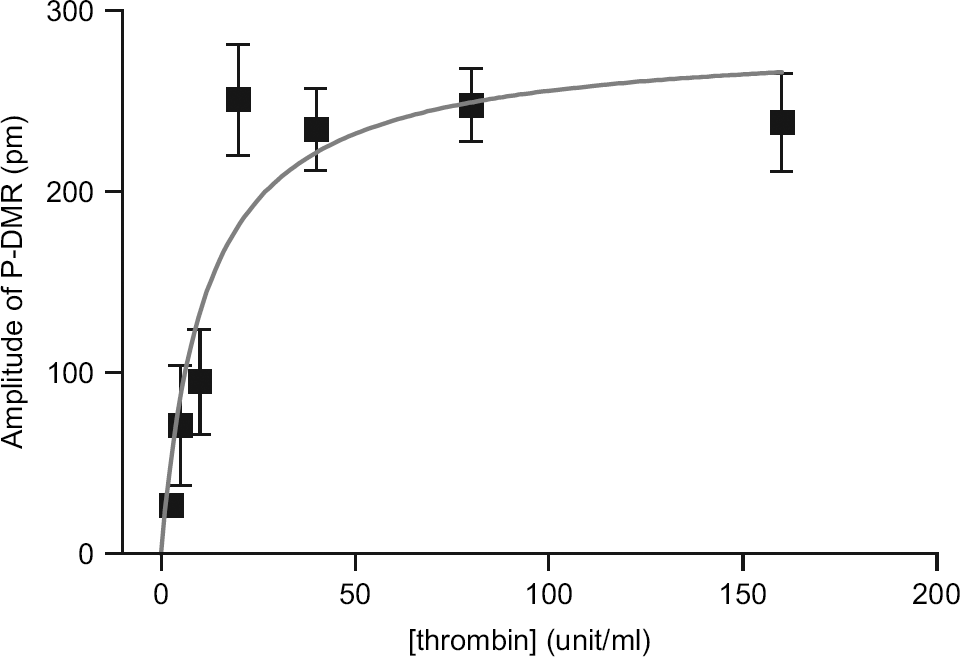
Conclusion Remarks
We report here that the Corning Epic label-free screening system allows both kinetic and endpoint measurements of the activation of endogenous GPCRs. Two endogenous GPCRs, bradykinin B2 receptor in A431 cells and PAR1 in CHO-K1 cells, were used as examples. The stimulation of A431 cells with bradykinin or CHO cells with thrombin led to similar optical responses relating to DMR. The DMR signals were saturable to either agonist, and were able to be completely blocked by their respective antagonists, suggesting that the optical responses observed were receptor specific. The endpoint measurement not only allows highly reproducible measurement of agonist-induced cell responses, but also enables the determination of agonist efficacies. The offline liquid handling and 5-min endpoint measurement per microplate of 384 wells suggested that the Corning Epic label-free optical system is suitable for HTS applications, particularly for screening GPCR modulators against endogenous receptors under physiologically relevant conditions. Because the DMR signal mediated through a particular target is an integrated response,17,18,29 this noninvasive and label-free technology allows mapping the signaling pathways and network interactions of GPCRs and is thus well suited for deorphanization.30, 31