
Abstract
Recent development in automated patch-clamp platforms has transformed the preclinical drug development landscape by incorporating electrophysiological assays at early stages of drug screening. PatchXpress 7000A, an automated 16-channel parallel patch-clamp platform, has a higher throughput than the conventional whole cell patch clamp. We developed and optimized assay conditions for the human ether-a-go-go channel (hERG) on an automated patch-clamp system such as PatchXpress 7000A. We applied nonlinear mixed models to quantify the consistency of the assay from cell to cell and to provide an accurate measure of drug potency over the population of the same cell type. The well-known hERG blocker quinidine was used in the experiments. The results of this novel statistical approach are the estimate of the average potency for the population of the cells with high degree of accuracy and the estimate of the potency variability from cell to cell. This method revealed no significant difference in the potency estimates for our assay and for conventional patch-clamp platform. We suggest that the novel data analysis can accurately predict compound potency when the assay protocols may have a small number of test concentrations and repeated measurements. (JALA 2006;11:195–202)
Introduction
Heart ion channel assays play an important role in assessing cardiac liabilities and in providing critical information on structure–activity relation at various stages of the drug discovery process. The human ether-a-go-go channel (hERG) is a potassium channel that contributes to the repolarization of the cardiac myocyte action potential. Drugs1–4 that interfere with this channel activity have been shown to cause fatal arrhythmia known as “Torsade de pointes”. Tremendous effort has been devoted to analyze hERG liability for all new drugs. Regulatory authorities and the pharmaceutical industry consider the ability of a compound to block the hERG channel in electrophysiological assays as a good predictor for potentially lethal cardiac side effects. 5 A number of assays have been developed to screen for potential hERG activities. These assays include rubidium efflux measurements, voltage sensitive fluorescent dyes, and whole cell patch-clamp recordings from hERG-transfected cells. Conventional patch-clamp experiments do not have the throughput capabilities for early stage drug screening. Recent introduction of automated whole cell patch-clamp systems, such as the PatchXpress 7000A (Molecular Devices), has significantly changed the landscape for electrophysiology-based assays by enhancing screening capacity. The present challenge resides in our ability to analyze efficiently and reliably the results generated by the automated whole cell patch-clamp recording platform. In this paper, we incorporate a novel statistical approach that takes both biological variability across the cells and consistency from numerous test occasions into consideration. We estimate accurately the potency despite a small number of test concentrations.
This novel statistical analysis is based on nonlinear mixed-effects models. Such models have gained broad acceptance as a suitable framework for data analysis of repeated measurements on an individual.6, 7 In our data analysis, each cell is considered as an individual and it is important to recognize explicitly two sources of variability: random variation among measurements within a given cell (intraindividual variability) and random variation among individuals (interindividual variability). In any application with repeated measurements, proper characterization of inter and intraindividual variations is crucial to ensure a sound inference. The nonlinear mixed models’ framework explicitly acknowledges the existence of these two kinds of variation and allows their estimation. We recommend both the introductory presentation 8 and the tutorial. 9 The introductory presentation requires minimal knowledge of statistics, and the tutorial discusses not only the nonlinear mixed models and their basis for the inference but the algorithms as well. See references 7 and 10 for the recent developments in this area of modern statistics.
Experimental Details
Cell Culture
Recombinant CHO-K1 cells were used to express hERG channels. A stable cell line expressing hERG channels was licensed from DiscoveRx. Cells were maintained in Ham's F12K (GIBCO/Invitrogen, Carlsbad, CA) media adjusted to contain 2 mM
Cell Preparation
Cells were harvested following 24–48 h in culture for PatchXpress experiments. Cells were briefly washed twice with PBS containing 0 Ca2+ and 0 Mg2+ followed by addition of 0.025% trypsin–EDTA in 3 ml of PBS (0 Ca2+, 0 Mg2+) for 2 min at room temperature and then 2 min at 37 °C. Trypsin reaction was terminated by 7 ml of culture media. The entire volume was triturated several times before transferring to 50 ml Falcon tube. Cells were centrifuged and suspended in 4 ml of culture media. Cell suspension was incubated for at least 20–30 min at 37 °C to allow recovery from the dissociation procedure before loading into recording chambers.
Electrophysiology Recording by PatchXpress 7000A
Whole cell recordings were performed by PatchXpress 7000A (Molecular Devices) with AVIVA's SealChip technology. DiscoveRx CHO-hERG cells were transferred from recovery media to recording chambers containing external solution. This solution contained (in mM) NaCl (135), KCl (5), CaCl2 (1.8), HEPES (10), and glucose (5). pH was adjusted to 7.4 with NaOH, and the final osmolarity was set at 300 mOsm. The intracellular recording solution (IS) contained (in mM) K-gluconate (90), KF (20), NaCl (10), MgCl2 (1), HEPES (10), EGTA (10), and K ATP (5). pH was adjusted to 7.4 with KOH, and the final osmolarity was set at 270 mOsm. Cells were voltage clamped at −80 mV holding potential, and hERG current was activated by a depolarizing step first to −50 mV for 500 ms to serve as a reference point for the tail current, then to +20 mV for 2 s to activate the channels. The final voltage step back to −50 mV for 2 s removed the inactivation to produce an outward tail current. The peak amplitude of the outward tail current was measured in the presence or absence of drug.
Drug Preparations
The test compound (10 mM stock) was sonicated for 15 min before making dilutions in DMSO, and it was kept in glass vials after that. Serial dilutions of each test compound were subsequently transferred into 1 ml glass vials in a 96-well compound plate. All compounds were added twice in short succession to minimize the loss caused by nonspecific binding.
PatchXpress Procedure
A standard procedure was designed to determine the potency of hERG blockers. In these studies, concentration response (CR) relationship and the potency were estimated from six incremental concentrations of the compound (e.g., 0.1, 0.3, 1, 3, 10, and 30 μM). In all studies, baseline hERG current amplitudes were established for 4 min before drug addition. There was a 3 min wait period between each drug addition for concentrations less than 1 μM and a 2 min wait period between each drug addition for concentrations greater than 3 μM. These wait periods were designed to observe steady state block of the hERG current. All compounds were added twice in short succession during a single drug addition step to minimize any potential loss due to adsorption. We present a typical example of hERG currents recorded in the presence of increasing drug concentrations in Figure 1.
Example of hERG current amplitudes before and during increasing drug concentration over time.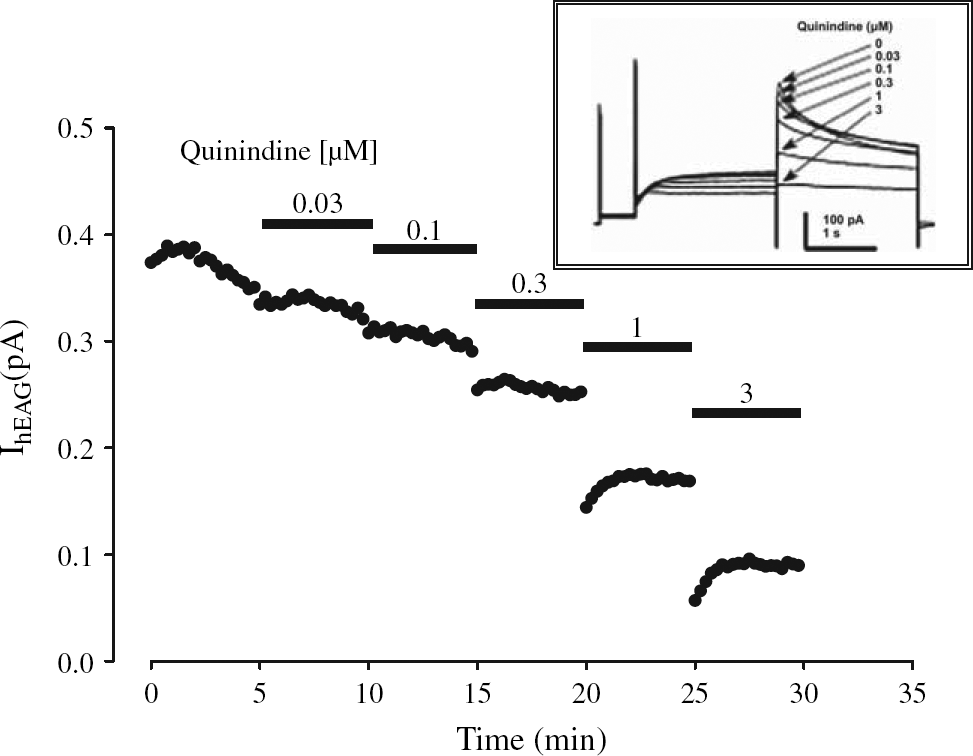
Computational Methods
S Language
S is a language and environment for data analysis originally developed at Bell Laboratories (of AT&T and now Lucent Technologies).
11
We use the implementation of S called S-PLUS, a commercial system from the Insightful Corporation. There is an Open Source system called R, which can be used for the proposed data analysis as well. We present the outputs of S-PLUS programs in this paper and use S-PLUS array notations such as log10
for some matrix M = (Mij), vector
Dataset
We describe the proposed statistical analysis in detail for the dataset collected from 11 cells expressing hERG channels. The data analysis for other experiments using different hERG channel blockers with the described protocol gave similar results and showed the robustness of this approach. The result of the experiment is a (6 × 11) recording matrix Rij, i = 1,…,6, j = 1,…,11. The vector of six incremental concentrations at which the measurements were made is

where
Here j is fixed and j = 1,…,11.
It is useful to consider log scale when CR relationship is analyzed and we introduce

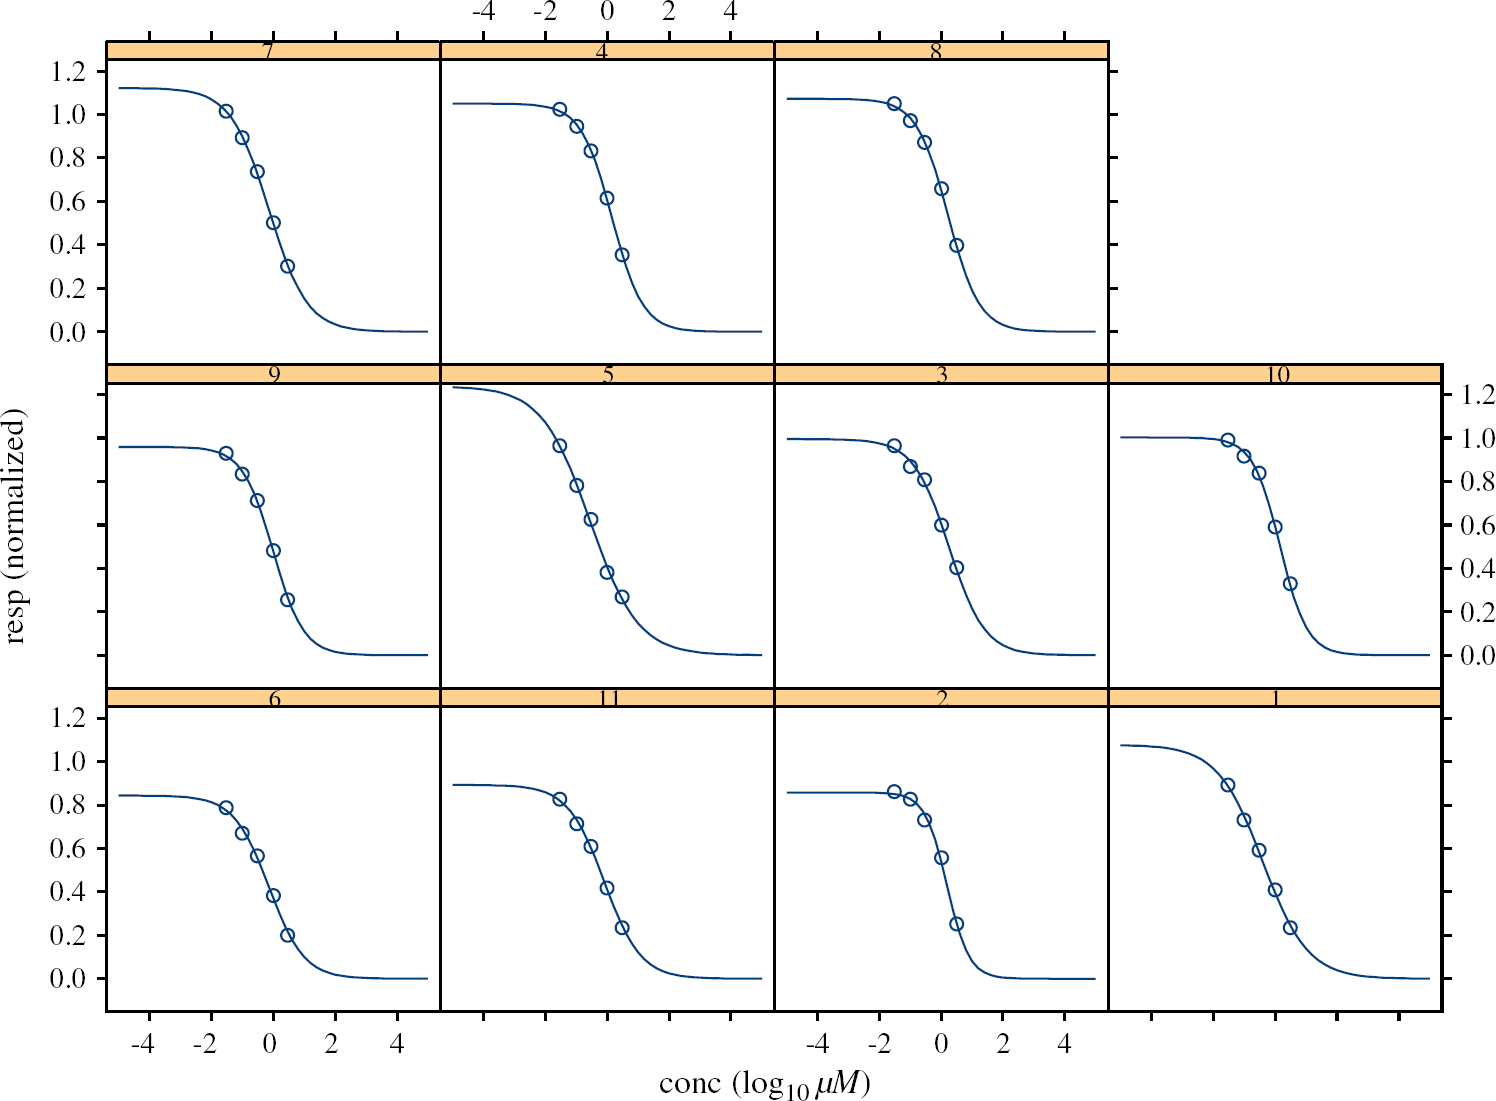
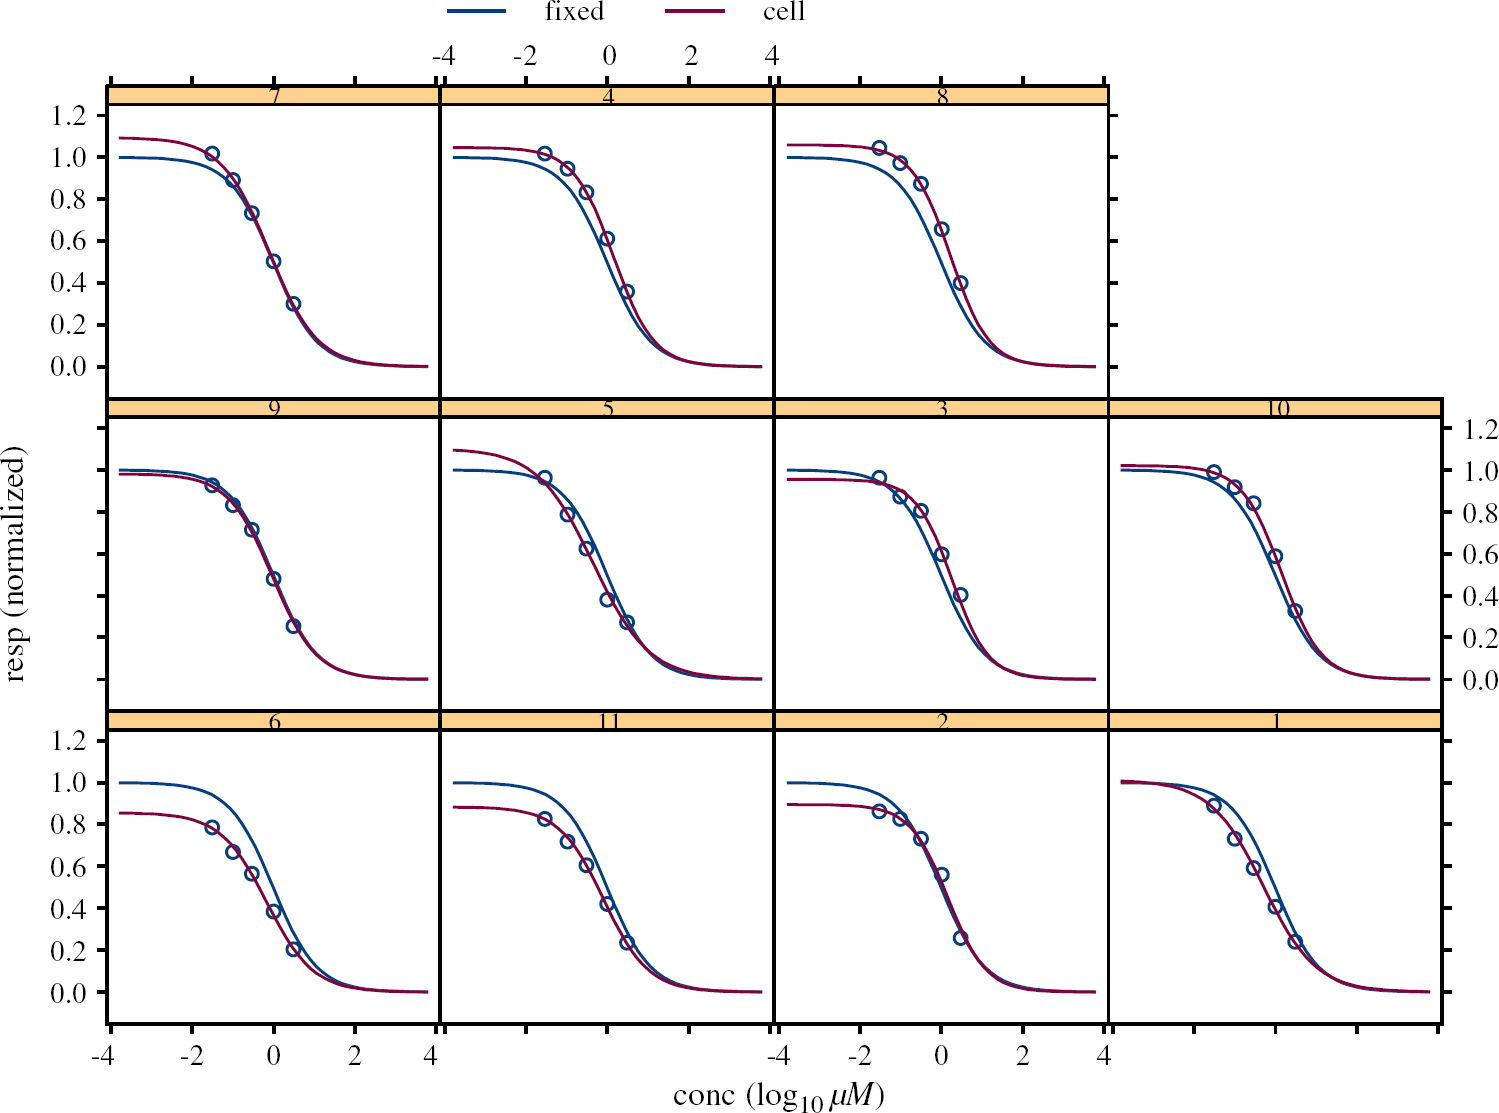
In Figures 2–7, the X-axis is labeled as conc and has physical units log10 μM and the Y-axis is the response normalized with respect to control.
The QBD set graphs for all 11 cells. The typical shape of CR curve. The average curve and the QB dataset. The average curve and all 11 nonlinear fits. Separate nonlinear fits for each cell. The result of the nonlinear mixed model analysis.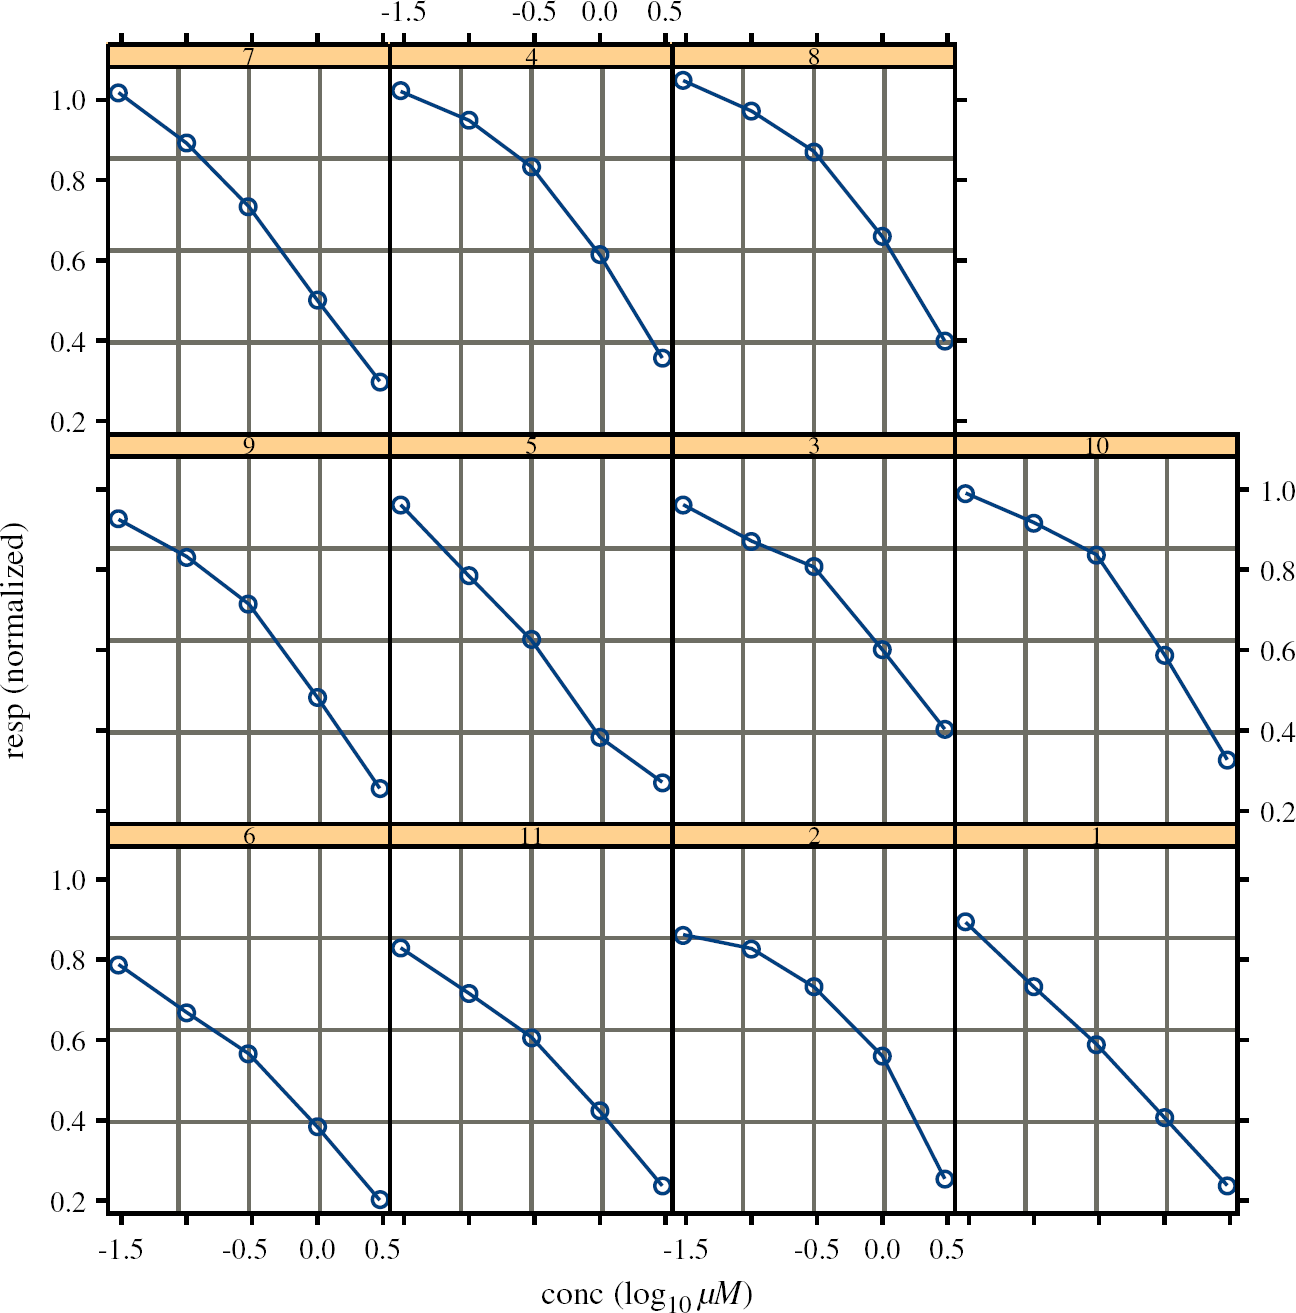
The Quinidine Blocker Data (QBD) set obtained in the experiment is presented as S-PLUS Grouped Data type below.
We present the dataset in Figure 2.
Logistic Model
We expect the CR relationship to have a sigmoidal shape.
The most commonly used model for the sigmoidal shape is the four-parameter logistic (4PL):
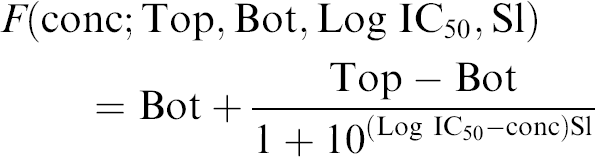
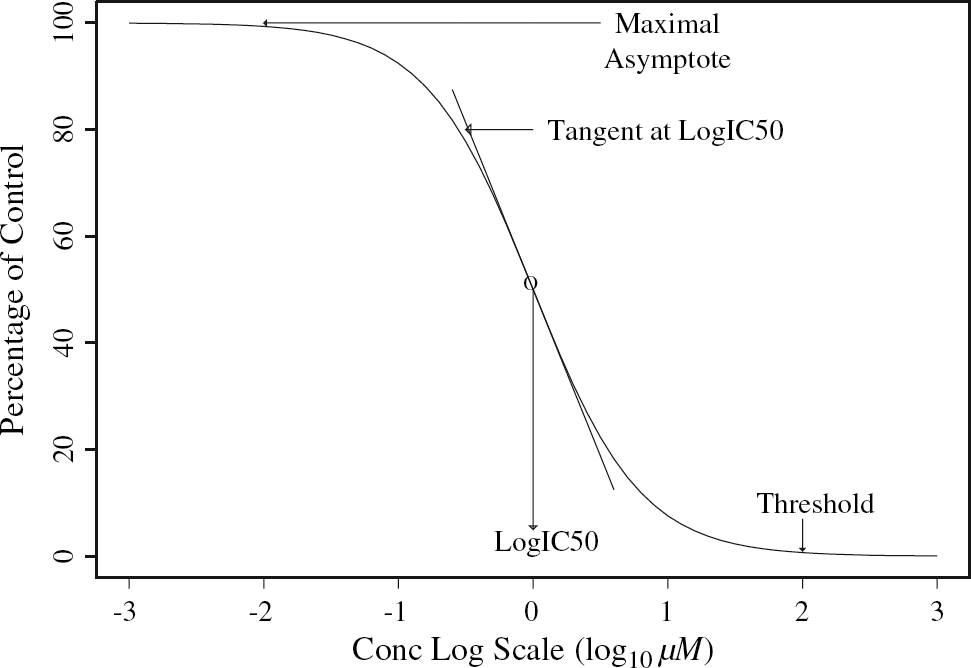
Operational models in pharmacology12, 13 provide some theoretical support for the formula and give meaning to the parameters. Probably the most important parameter reported during a campaign is the IC50: the concentration of drug that is required for 50% inhibition in an assay. A geometrical description of the parameters Bot, Top, Log IC50, and Sl is given in Figure 3; Top is the maximal response, Bot, the minimal response, and the parameter Sl corresponds to the slope of the tangent to the curve when the concentration is IC50 (the log10 of concentration is Log IC50).
Because the response in the experiment should vary from 1 to 0, we assume that Bot = 0 and Top is close to 1. We do not fix the value of Top to 1 because there are error measurements for the records at concentration 0. Our final model for the analyzed assay is

Exploratory Data Analysis
The main purpose of HTS nonlinear regression models probably is to make inferences based upon interpretation of the estimates of parameters such as IC50. The problem considered here is to build a model which finds parameters Top, Sl, and Log IC50 that make the curve come as close as possible to the measured data. Such a model should have the following important properties: interpretability, parsimony, and validity beyond the observed range of the data.
The following two approaches for the estimation of parameters are the standard nonlinear regression methods:
M1. Use a single CR curve for all cells of the same type.
M2. Fit each cell's dataset with its own CR curve individually.
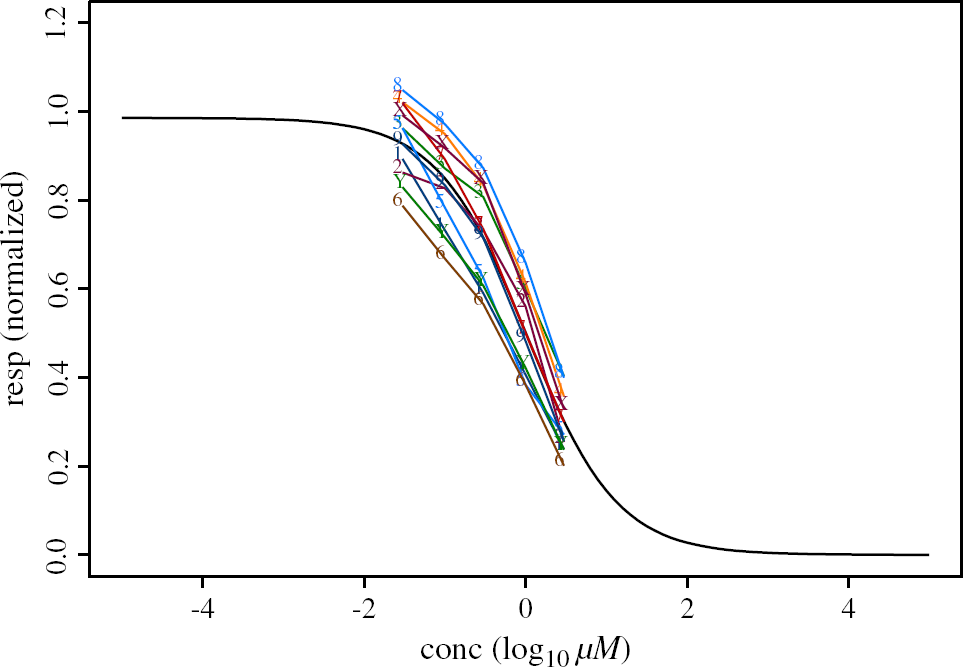
The first approach is rigid and provides an “averaged” estimate of the vector of the parameters for the whole population

The additional information of the variability of the responses from cell to cell is lost. The Quinidine Blocker Data set with all data points together and the “averaged” curve in black are displayed in Figure 4.
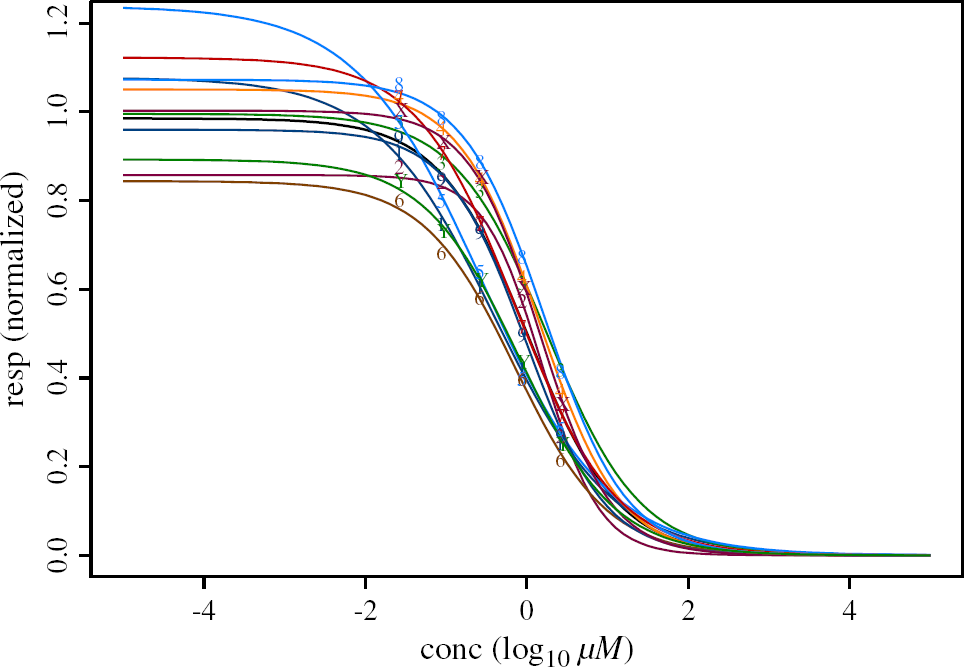
The second approach gives the overparameterized model. The estimates of the parameters are obtained separately for each cell. It lacks parsimony, and the interpretation of the parameters (e.g., IC50) for the whole population of the cells of the same type is not feasible. Figure 5 presents the individual nonlinear fits for each cell together with the “average” curve in the case when Top and Bot parameters are fixed as 1 and 0, respectively. In Figure 6 the individual nonlinear fits are displayed as separate plots for better visualization of the variability across the cells.
Random Effects Model
The nonlinear mixed-effects model's approach 6 offers a compromise between the rigid model M1 and the overparameterized model M2. Such a model has so-called random and fixed effects. It accommodates cells’ variations through the random effects, but ties the different cells of the same type through the fixed effects and correlation properties of the random effects.
We consider the model with two sources of random variation, one for parameters and another for noise. Such models are called hierarchical or multilevel models. 6 Let us describe the nonlinear mixed-effect model for the problem under consideration as the following two-stage hierarchy:
Stage 1: Cell-level model. For each jth cell the CR is described as

Here the function F(conc;
The interpretation of Eq. (3) is that some parameter vector
Stage 2: Population of the cells of the same type model. We assume that the vector parameter in Eq. (2) is

where
Eq. (4) describes the behavior of the parameter
In particular

One possible interpretation is that Log IC50random is some random addition, which varies from cell to cell with the realization Log IC50,jrandom for cell j. Inferential objectives for the models (3)–(4) are to understand the values of fixed effects (e.g., Log IC50fixed), variations of random effects across the cells in the population, and whether some of these variations are associated with individual biological properties of the cell. The confidence intervals on such estimates are also of significant interest.
Statistical Distribution in Random Effects Model
The usual assumption for nonlinear mixed models is that both the random effects and the errors follow Gaussian distributions and are independent random vector variables. The Gaussian distribution is not always realistic for the random effects and a problem with numerical stability arises. For the models (3)–(4) we found that the Gaussian distribution for the parameter Sl was not adequate. For example, this parameter should always be positive and it is reasonable to expect so-called peaked distribution, which has a peak even more distinct than Gaussian distribution.
14
Our assumption for the models (3)–(4) is that vectors
It follows from our assumptions that the parameter Sl has a lognormal distribution that is popular in many bioscience models. 18
nlme Library in S
There are many special computational techniques for nonlinear mixed models and different software implementations. We found the S-PLUS library nlme very useful in the process of model building and the parameter estimation for the model. A detailed description of this library with the examples can be found in the book “Mixed-Effects Models in S and S-PLUS”.
6
The main function of
Results
As a result of nlme run, the nlme object rem was obtained for the model. The output of S-PLUS session for the confidence intervals of the parameters is presented. We use the parameter exp Sl = exp (Sl) instead of Sl for the model parameterization.
The estimated standard deviation of the distribution of the random effect for Log IC50 is 0.2. It is interesting to compare the 95% confidence interval [–0.137 0.118] for Log IC50fixed = 0.01 with the 95% confidence interval [–0.164 0.2] of Log IC50 = 0.02 for the model M1 (the corresponding S-PLUS object is m1). The former interval is smaller because some variability of the data is due to the random effects in the model rem.
In Figure 7 the blue curve corresponding to fixed effects, which is the population prediction or prediction for all cells of this type, is compared with the data points and individual predictions for each cell.
Models Comparison and Hypothesis Testing
One can ask if there is a need for the complex random effects model and why we are not satisfied with the simple model M1 as an alternative for our inference.
The nested models approach 17 lets us answer such questions. The method ANOVA in the nlme library gives the results of a likelihood ration test, Akaike Information Criterion (AIC), and the Bayesian Information Criterion (BIC) for the random effects model rem and the simple model m1. 11
Because p < 0.001 and the model rem has lowest the AIC and BIC, we can conclude that the random effects model rem is preferable in comparison with the model m1.
Discussion
Because of the nature of conventional electrophysiologybased experiments, the throughput is extremely low when compared to fluorescence-based high-throughput screening assays. However, these electrophysiology-based experiments are considered as the “Gold Standard” for ion channel research. We have developed a standard operating procedure for hERG profiling that enables us to maximize our throughput capability on an automated patch-clamp instrument, namely PatchXpress 7000A from Molecular Devices. This procedure has a small number of test concentrations per cell and it may affect the estimation accuracy. To estimate IC50 values in these experiments from repeated measurements of the same population of cells, we have implemented a novel statistical approach that takes both biological variability across the cells and consistency from numerous test occasions into consideration. Using the nonlinear mixed-effects models we were able to give the estimate of IC50 = 1.0 μM for Quinidine Safe blocker. This estimate is in agreement with the “Gold Standard”. Many other in vitro electrophysiological assays can be tested and analyzed based on the proposed method.
Footnotes
Acknowledgments
We gratefully thank James Gill at Bristol-Myers Squibb Company, Philip Tagari, Flora Tang, Mike Boedigheimer, Rick Stanton, and Systems Informatics Group at Amgen for the useful discussions. We would also like to thank Janet Kingsley at Amgen for her help in the preparation of this paper. We are grateful to two anonymous reviewers for their interest.