
Abstract
Process improvement has been a dominant movement in many manufacturing industries in the last two decades. In recent years, many service- and transactional-based companies are successfully implementing Six Sigma to improve business success. Most of the pharmaceutical and biopharmaceutical companies have not broadly recognized integration of breakthrough process improvement methods with clinical research practices. Although this phenomenon is interdisciplinary, its internal structure and the nature of its interactions with other disciplines in clinical development organizations have not been studied in depth. This article will discuss the author's comparative analysis of the Six Sigma and other quality management methodology. A case study is also presented to demonstrate breakthrough reduction of cycle time in Clinical Report Form entry process with near zero defect level of quality.
Introduction
Pharmaceutical management today faces traditional financial, operational, and marketing challenges, as well as business issues that cut across several functional areas. In terms of global clinical trials, a multidisciplinary, cross-functional approach to organizational economics has become critically important in recent years. Given a lack of theoretical or empirical evidence on breakthrough improvement of business processes in the pharmaceutical industry, this paper examines relevant research on process improvement that is recognized by other sectors and which may accelerate clinical trials. This case study applies the Six Sigma quality improvement methodology to data entry of a specific clinical study.
Both academic researchers and practitioners have proposed many methodologies for applying quality improvement measures, but to truly understand business process improvement, we must learn from the world of organizational management. As more organizations undertake quality and process improvement, more issues in implementing such activities become major concerns.
Business Process Improvement
Since the early 1990s, or even earlier, there has been an organizational race to implement business process improvement, to reduce wasted time and resources, and the quantity and significance of defects.
Process improvement can be characterized as the implementation of deliberate changes in the way of doing business to achieve improvements in operational excellence, quality of output, and business performance. The broad organizational focus and deliberate nature of process improvement suggest a planned change in which a successful project requires preparation and deliberate action, commitment from senior management, technical competence, and mitigation of resistance to the change. Through process improvement, this planned change may yield to a more emergent perspective involving complex indeterminate interactions among people and technology, and the need for change can involve elements of both planned and emergent modifications fueled by environmental fluctuations.
The degree of change implemented in any aspect of a process can range from subtle to fundamental (often referred to as business process reengineering), and intended performance improvement can range from small and incremental to significant breakthroughs. Often, but not always, the link between these is proportional, that is, a series of subtle changes often leads to many small incremental improvements in performance, whereas a fundamental change often leads to a breakthrough and higher levels of overall performance.
Improvement of workflow or business process is a step-by-step method for increasing an organization's efficiency by analyzing how information flows and how decisions are made. Two approaches that are useful in viewing the improvement procedure include one based on process (how people work) and one based on information (how information moves). The two methods, however, should produce equivalent results because they both measure the ways organizations work.
Some of the best-known process improvement methodologies are International Organization for Standardization (ISO) 9000, total quality management (TQM), Six Sigma, and Baldridge Criteria, 2,3 and their fundamental principles are very similar. For example, McCormick 1 recommends defining workflow, and then examining functional decomposition, processes, input, and output to determine gaps or redundancies within an existing organizational structure. The increasing use of such formalized business process is changing the way in which statistics are applied in business research and quality management in the manufacturing industry. Many researchers of process improvement methodology believe that the ramifications of Six Sigma should not be limited to manufacturing because it can be effectively applied to many other enterprises, such as banking, healthcare, academia, and government. Many people have heard of ISO 9000 or ISO 9001, and the phrase “total quality management” 2 is also widely used in general business literature. The Six Sigma 3 improvement initiative was developed more recently than some of the other approaches. It is a highly disciplined and statistically based approach for removing defects from products and redundancies from processes and transactions. It is known for having a major impact on the culture, operation, and profitability of several of the largest companies in the United States, including General Electric, AlliedSignal, Lockheed–Martin, and Motorola, but Six Sigma has not yet been widely applied in the pharmaceutical and medical device industries as a whole, let alone in their clinical research operations.
Six Sigma Methodology
Harry 4 describes Six Sigma as “a program aimed at the near elimination of defects from every product, process and transaction”. This concept was introduced and popularized by Motorola in its quest to reduce defects in the electronics products it manufactures. When used as a metric of quality in any process, product, or service, the goal of Six Sigma is to have no more than 3.4 defects per million opportunities. A statistician may note that this goal corresponds to precision within 4.5 standard deviation (SD) of the mean rather than within the 6 SD one would assume; the remaining 1.5 SD are used as a buffer to deal with the tendency of processes to drift slightly with time.
Panda et al. 5 indicate that TQM's major pitfall is a “lack of integration.” For many organizations, “quality often was a sidebar activity separated from the key issues of business strategy and performance.” In many Six Sigma cases, the project is managed by a core management team with direct links to the bottom line of the business. A company's operating managers are included in the problem-solving process and have decision-making authority with official control. Organizations implementing Six Sigma put process management, improvement, and measurement into action as part of their daily responsibilities. Incentives reinforce that Six Sigma is a part of their job.
Leadership commitment makes Six Sigma synonymous with constant reinvention of the business: senior management must accept that change is essential for continued success. Frequent reorganization is not the solution to fundamental business problems, but simply a managerial response to fix superficial issues. Often, senior management's skepticism or unwillingness to drive a project undermines implementation of process improvement. The use and adaptation of an assortment of results-oriented tools and approaches differentiates Six Sigma from other business improvement methodologies.
Cross-functional process management lies at the core of Six Sigma's success in eliminating rework created by disconnects and miscommunication. One of the most attractive facets of Six Sigma is to begin fresh when redesigning a process, and recognize that both small improvements and major changes are essential parts of business success. Six Sigma works not only in manufacturing but also in sales and marketing, services, transactional activities, and other strategically critical areas, some of which offer even more opportunities for improvement of business performance.
Case Study: Optimizing Data Entry Process
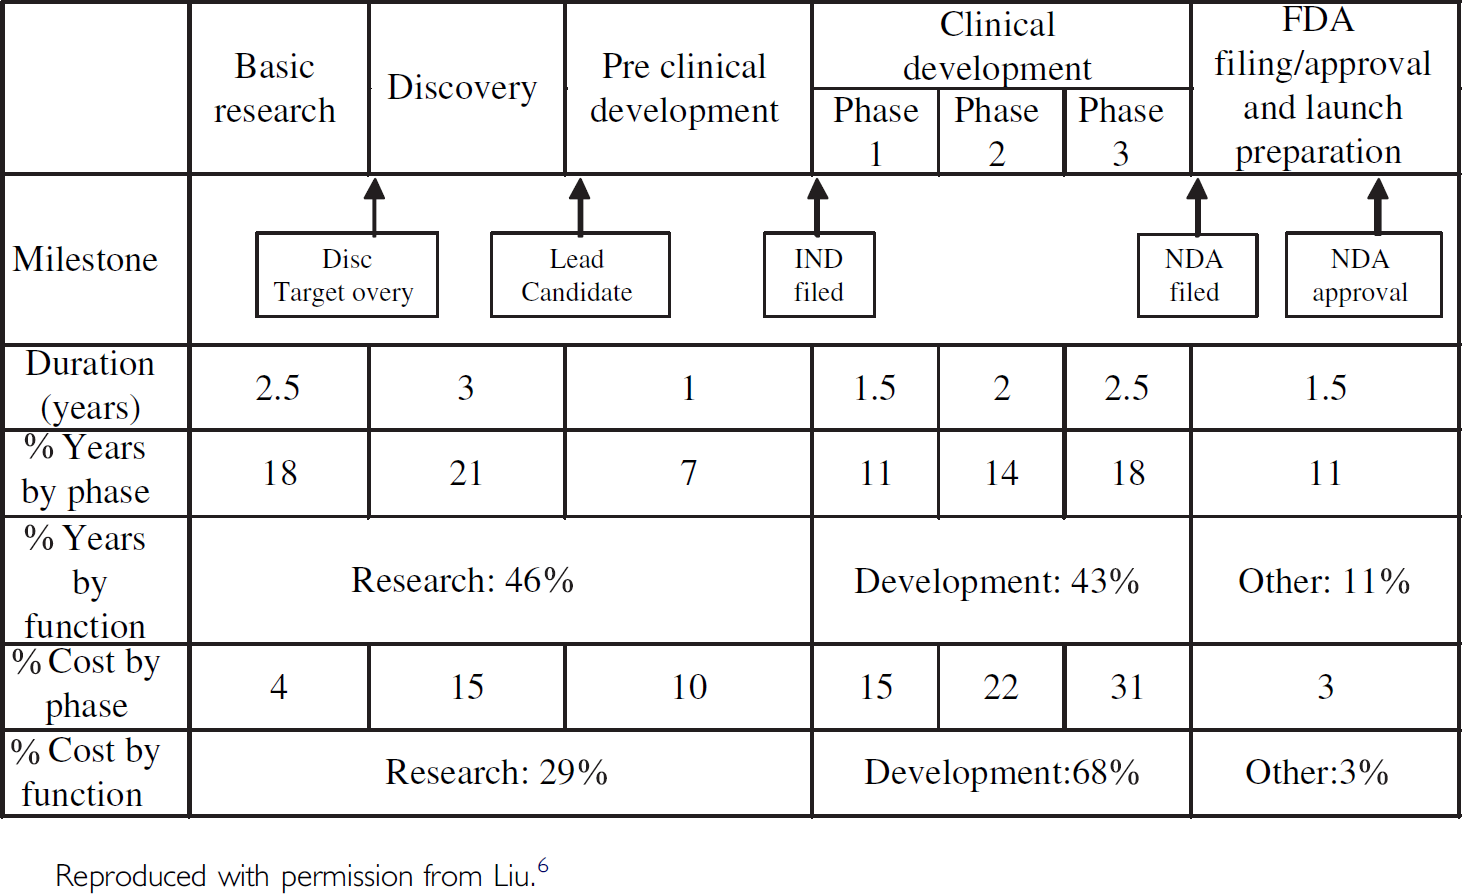
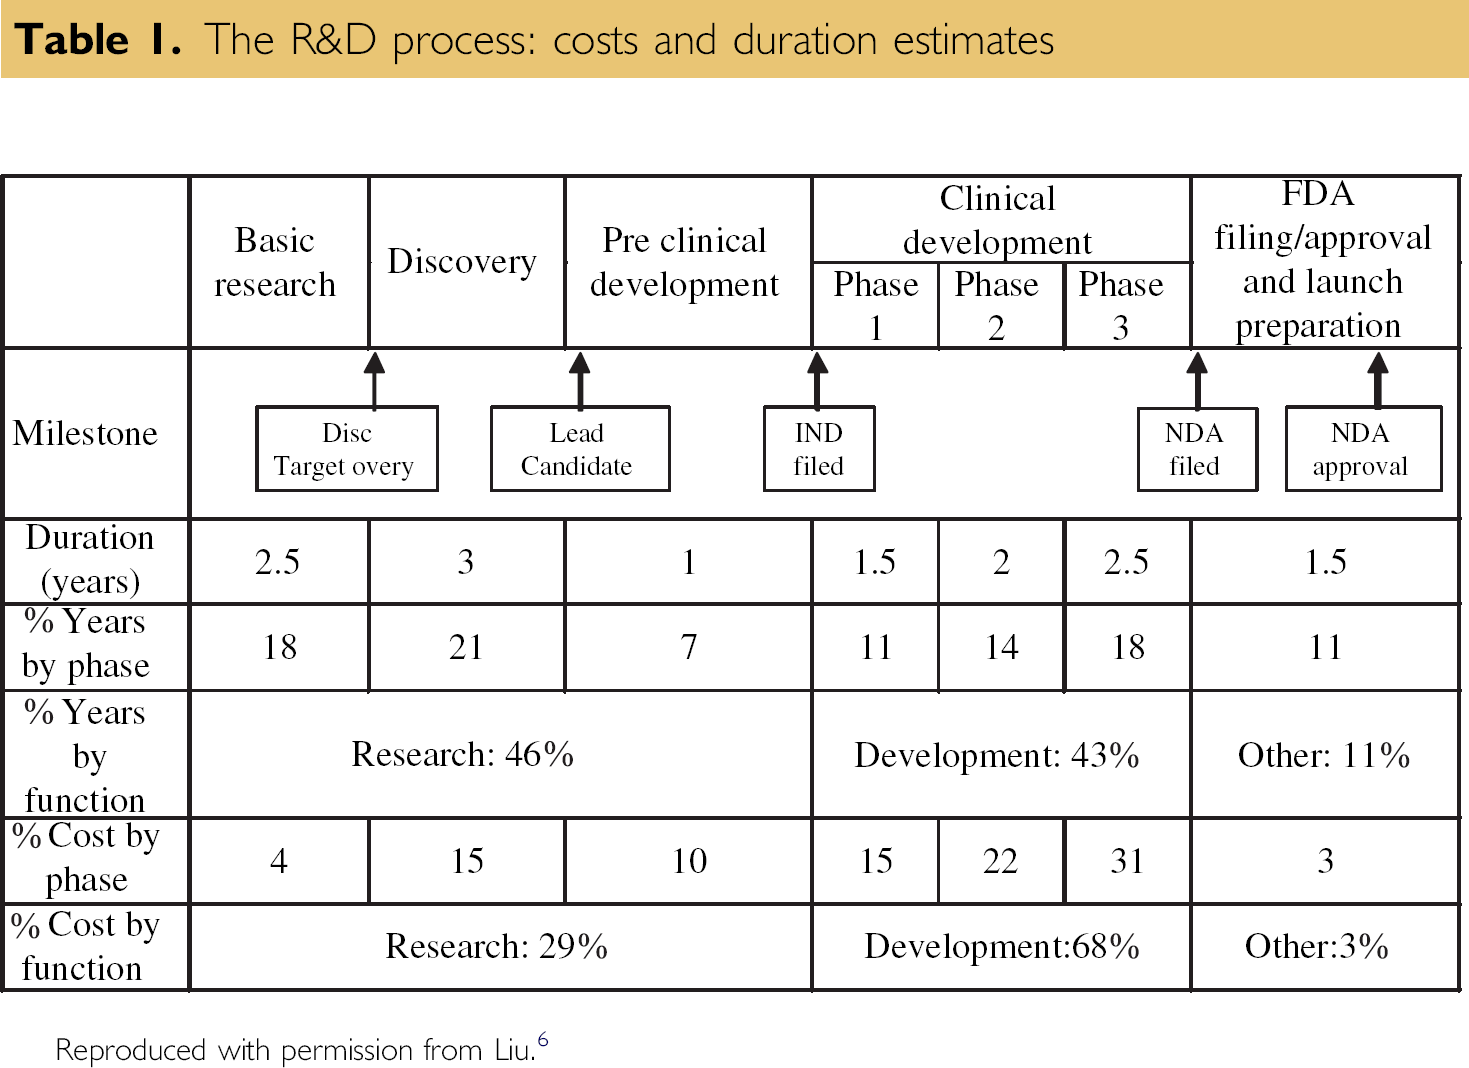
New drug discovery and development requires, on average, 14 years to complete. 6 The process can be considered in five phases: basic research, discovery, preclinical development, clinical development, and Food and Drug Administration (FDA) approval. The clinical development phase involves a number of clinical trials that are performed when a new drug substance is tested on human patients.
As depicted in Table 1, the clinical development phase accounts for 68% of the total cost of getting a new drug to market. Phases II and III of the clinical development phase account for 53% of the total cost and require 4.5 years or 32% of the total duration to produce test results that are appropriate for a New Drug Application (NDA) submission. An NDA is the official application to the FDA for a government-approved license to market a new drug in the United States.
The R&D process: costs and duration estimates
During the last 20 years, the average number of trials per NDA has increased from 30 to more than 70, and the number of patients in a typical submission between 1980 and 2000 has also increased from 1576 to more than 4200. 7
Although the FDA's decision to approve a new pharmaceutical for marketing is based largely on the results of clinical studies, the agency will not allow an entirely unknown and uncharacterized compound to be administered to human subjects. Before clinical work can begin, the FDA requires reports on the drug's administration to laboratory animals. The FDA uses data from these studies to decide if the drug is sufficiently safe for initial administration to humans. When a pharmaceutical company is confident it has sufficient data to demonstrate that a new drug is adequately safe for the market, the company assembles and submits an NDA to the FDA for thorough review and examination. As required by the Code of Federal Regulation, a pharmaceutical company can begin to market a new drug only after filing and obtaining approval from the FDA.
Pharmaceutical business needs cannot override scientific intent or the ethical obligation to patients involved in clinical trials. Any mitigating circumstances or compromises in patient well-being to accelerate clinical trials should never be considered. Clinical and scientific collaborators need to discover and test new drugs, and their disappointments are not only about scientific altruism. The social and ethical responsibilities of an organization involve more than conformity with legal system and law. They address the issues of duty and the principles upon which this duty rests.
As detailed in Table 1, the Investigational New Drug Review Process (FDA, 1997) presents the systematic processes that a pharmaceutical company must go through to obtain permission from the FDA to secure an exemption from the statutory requirement that prohibits unapproved drugs from being shipped in interstate commerce. The application includes a compilation of all known information on the compound, a description of the clinical research plan, and the specific protocol for Phase I study (i.e., testing the new drug on healthy human volunteers). In conducting clinical trials, pharmaceutical companies traditionally use special three-part Case Record Forms (CRFs) to enable physicians at investigator sites to record protocol-specified clinical data about patient vital signs and medical indication of the drug efficacy during the multiyear trial. For every large clinical trial, tens of thousands of CRFs must be collected from hundreds of clinical trial sites, and their reliability is in direct proportion to the reliability of the instruments used to collect the data.
The most crucial part of the clinical trial process involves source data, the original records of clinical findings, observations, or other activities in a clinical trial necessary for the reconstruction of that trial. Their reliability is in direct proportion to the reliability of the instruments used to collect the data. Original clinical findings, observations, and other medical indications are increasingly being captured into a persistent electronic form (i.e., electronic data capture (EDC)). This optimizes the clinical trial process by eliminating transcription errors and ultimately, shortening the duration of the trial.
Considering the significance of the time and costs of clinical development, this case study examines the data entry process for CRFs in a conventional Phase III study. The purpose of this case study is to seek a breakthrough reduction of greater than 70% in cycle time and errors when entering CRF pages into a data management database in a traditional clinical trial. The existing CRF handling procedures and optical scanning workflow are redesigned.
After demonstrating statistically that this improved process meets the goals of breakthrough reductions in cycle time and error rate, the final step of the Six Sigma methodology is to implement the changes using a defined control plan to ensure that the newly designed process can sustain long-term performance gain. In this case, the control plan is defined as follows:
Streamline the workflow of CRF transport process in the data entry department by minimizing stop and go work patterns, and shortening interactions between work areas. Implement an optical mark technique to convert study data (where feasible) into optically recognizable binary characters for processing data directly into data management systems without human intervention. Continue monitoring via control charts to ensure that the elimination of verification processes does, in practice, maintain the error rate requirement without quality control (QC) validation.
The Six Sigma methodology is often referred to by the initials of its five basic steps: define, measure, analyze, improve, and control (DMAIC). Each step is designed to ensure that companies apply the technique in a methodical and disciplined way, that projects are correctly defined and executed, and that results of these projects are incorporated into day-to-day business operations.
The Define phase is critical in ensuring the success of a Six Sigma project. Purpose and scope are defined, and include detailed information about the process and customer specifications. A project charter is created with a statement of the problem, desired performance goals, constraints, assumptions, and a project plan. A high-level process map is depicted in Figure 1 with a list of important process steps critical to the quality of clinical trial data.
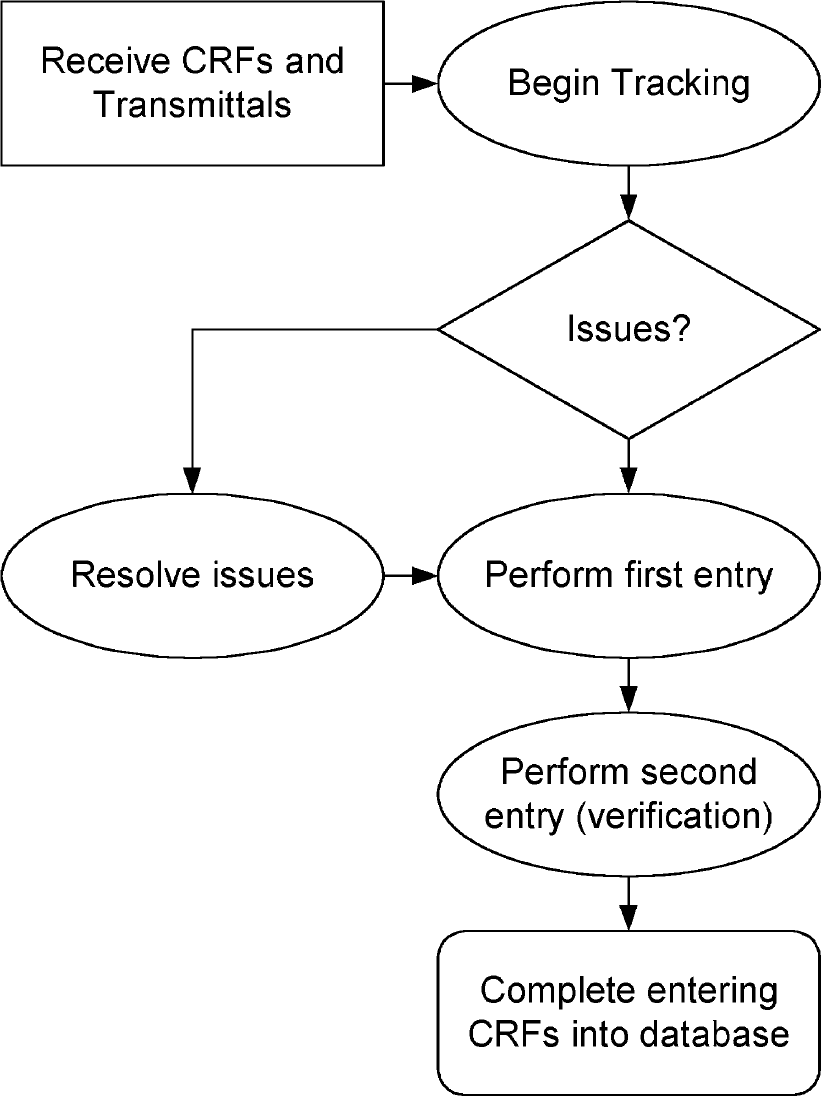
Data Entry Process Flow of Clinical Report Forms.
The Measure phase serves to validate the problem and search for root causes. Baseline measurement of process capability is determined. Following the Measure phase, the Analyze phase applies statistical methods to identify and confirm the causes of defects or cycle times that exceed specification limits. In-depth analysis of the business process ensures thorough understanding of how work is being performed, and how inconsistencies cause problems to occur. Based on the outcome of a new process, a control plan is instituted to ensure that operations are monitored and executed consistently over time.
The name of the company involved must remain anonymous; the clinical trial selected for this project involves 32 sampling patients and 21-page CRFs for each patient. The project team began by mapping out the first and second data entry processes, and isolated time-consuming steps that can affect cycle times and error rates. When the CRFs were entered into the database, the data were reviewed against the codebook, and the appropriate investigator sites were queried about any invalid data points. The responses from study sites were then reentered and revalidated.
Managing this labor-intensive workflow was cumbersome, time-consuming, and error prone. In-house data entry personnel perform interpretation investigator handwriting, double data entry, manual examination of clinical data, multiple cycles of QC review, and mailing outstanding data related issues back and forth between parties. The time spent managing CRFs in a typical Phase II or Phase III clinical study is not measured in days, but in weeks.
Instead of investing capital funding in a possible technology solution (EDC), this project focused on redesigning the CRF data entry process by adopting Six Sigma DMAIC methodology and Lean Sigma (Six Sigma with Lean Production elements) 8,9 for waste reduction. The intention was to eliminate wasteful procedural steps involved with handling CRF pages, and transferring them between work areas in the data entry department.
A dedicated project team, including the process owner, worked for 4 months on this project, holding weekly cross-functional reviews of outcomes derived from Six Sigma tools at each stage of the methodology. The output from the first data entry process had to be close to error free, within the acceptable margin of 0.2% as mandated by standard operating procedure. A second data entry step was then performed by senior level staff to verify the accuracy of data. Finally, when the data entered were in accordance with the original CRFs, they were securely locked in the database for biostatistical analysis.
Based on the 2003 data entry statistics, 2.87 min per page on average was recorded to establish baseline performance. The objective was then to demonstrate that a redesigned process could drastically reduce cycle time for tracking, verification, and scanning operations to less than 1 min per page. An experimental run of the process was then designed to test the throughput and measure possible defects. Running the process enabled the cycle time per page and number of errors produced to be determined. The amounts of variation in the processing times for data entry, scanning, and data verification were calculated from observed variations in operator efficiency and scanner throughput.
Transport of CRFs around the workplace and the format of CRF pages were each streamlined to simulate the entire process in an experimental workflow. The Lean Sigma method was deployed by examining the floor plan, including measurement of traffic, distance, and movement time from individual operator work area to and from the scanner locations. Relocation of scanning operations from individual work areas to one redesigned central scanner location was instituted to minimize movement time. Subsequently, instead of having each operator scan one set of each patient's CRFs at a time from presorting, scanning, to complete verification of database entry, the redesigned and centralized scanning procedure restructured the workflow by paralleling tasks. As a result, when a first patient's CRFs were scanned, a second patient's CRFs were presorted and inserted into the scanner hopper.
In addition, statistical design of experiments as applied to the Six Sigma methodology 10 was used for a pilot test of randomly selected samples to test for a 95% confidence level. Thirty-two patients' CRFs were calculated to create sufficient statistical power to test the new process against cycle time and error reduction. The second operator performed a similar experiment to verify the entered data. The collected accuracy and cycle time data were tested for accuracy of the resulting clinical information by comparing rates of human-caused and technology-caused errors.
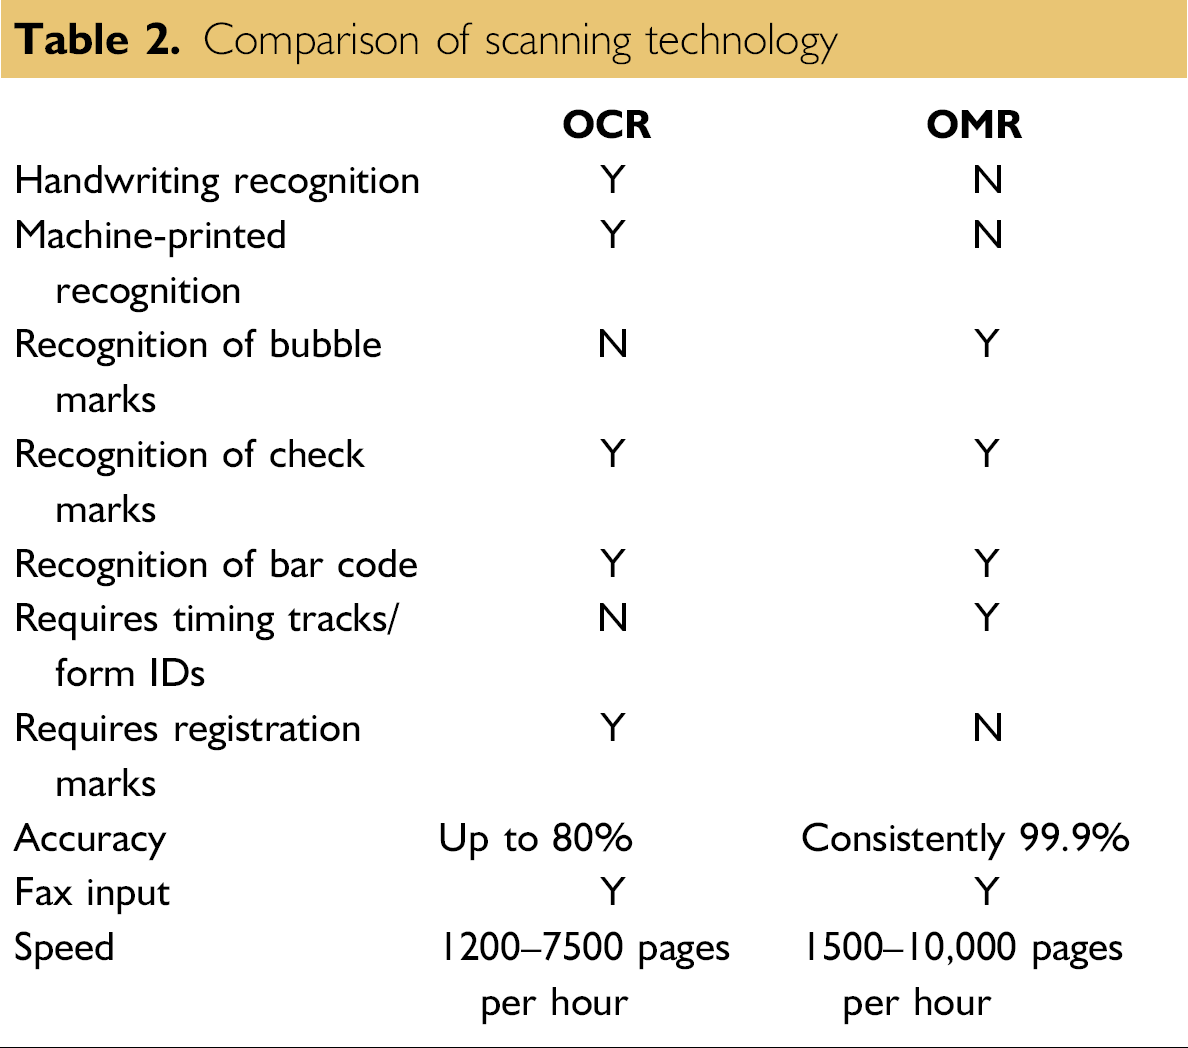
Comparison of Scanning Technology
Optical Character Recognition (OCR) and Optical Mark Recognition (OMR) apply optical scanning technology to data entry in standardized paper form processing. OCR technology gives scanning and imaging systems the ability to turn images of machine-printed characters into machine-readable characters. Images of machine-printed or handwritten characters are extracted from a bitmap of the scanned image. Forms then can be scanned through an imaging scanner, faxed, or computer generated to produce a bitmap.
OMR technology detects the absence or presence of a mark, but not the shape of a mark, in binary codes that are recognizable by computer. Scanning software such as Cardiff Teleform (Vista, CA), which was used in this project, interprets output from the scanner and translates it into the desired American Standard Code for Information Interchange (ASCII) output. Forms are scanned through an OMR scanner. The forms contain small circles, referred to as “bubbles”, that are filled in by the respondent. OMR cannot recognize hand-printed or machine-printed characters. The OMR scanning method does not create an image of the form.
An imaging scanner can process 1200-7500 forms per hour. It is not, however, the scanning speed that determines the throughput of a form. Other factors such as number of characters per page, number of different document types, and legibility of handwriting affect the throughput. An imaging scanner is significantly more expensive than an OMR only scanner. As the scanning volume increases, multiple workstations and servers are required to process the required forms. An application is rarely limited by the speed of the scanner. Rather, the most significant limitation is more often the processing power of the servers and the network that connects them.
An OMR only scanner can maintain a throughput of 2000-10,000 forms per hour as shown in Table 2. This activity can be controlled and processed by a single workstation, which can handle the high volume that an OMR scanner can generate. Increasing the throughput simply requires upgrading the scanner. OCR software cannot be used with an OMR scanner. On the contrary, OMR-based forms can be processed through OCR scanners.
With a quality printed document, OMR technology can consistently provide 99.9% accuracy. OCR technologies can provide up to 80% accuracy if the system is calibrated properly, the forms are well designed, the characters received are clean and neat, and contextual editing is used. This is approximately the same accuracy achieved by manual data entry.
Comparison of scanning technology
Analysis of Experimental Results
Considering that the historical SD was unknown, the one- sample t test was chosen for selecting sample size and subsequent descriptive statistics and testing.
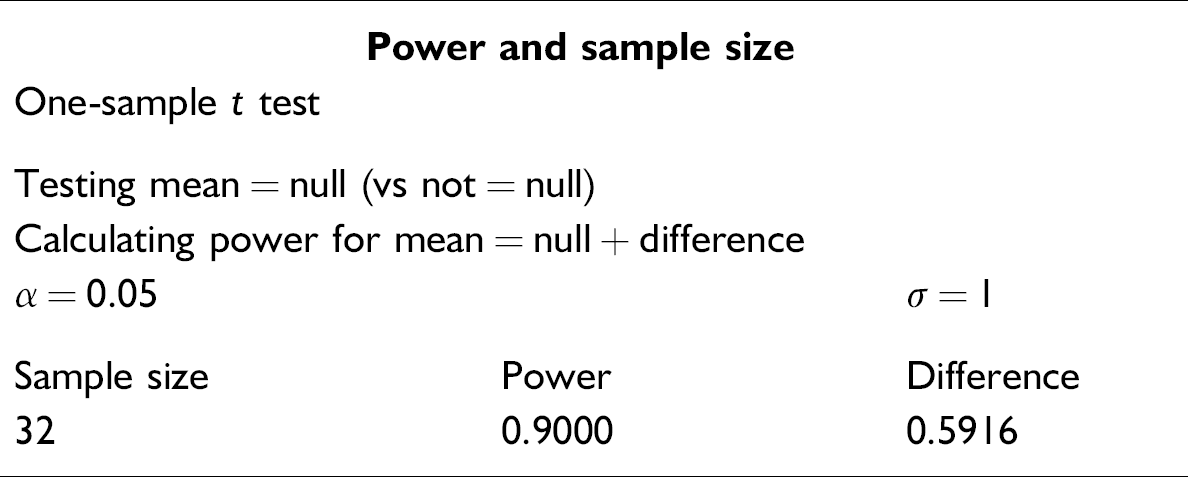
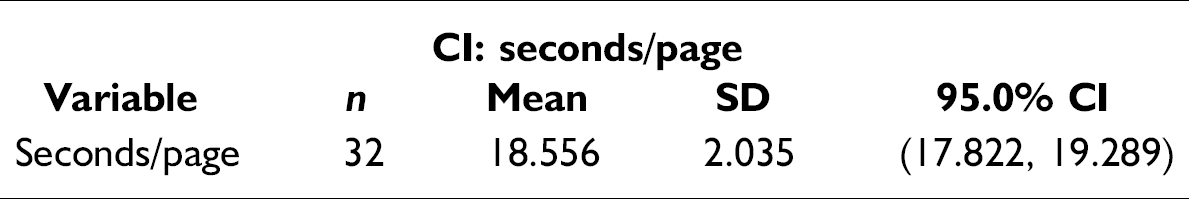
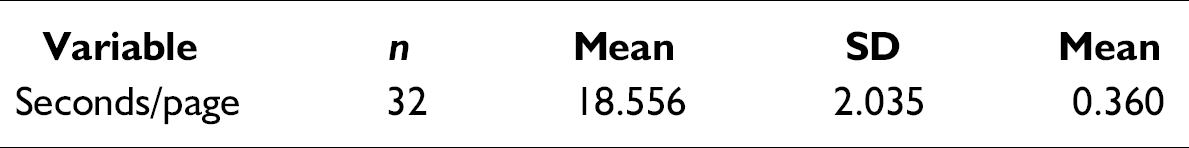
It is at a 95% likelihood that the selection of 32 as a sample size, for one-sample t test based on a beta of 0.10, would sufficiently represent population characteristics. Based on the experiment designed for this project, descriptive statistics are shown in the following graphical summaries. The mean for the experiment was indicated as 18.55 s per page (CI: second/page table below), processed from the first data entry through the second, and verified with a SD of 2.0349.
Further analysis was conducted to examine factors that influenced the output of this experimental process. The box plot in the figure 2 reveals that operator 3 is apparently the most efficient operator, but his or her outcomes have the greatest variations compared to the other operators. Operator 4 is the slowest. Operator performance as a factor is further examined through inferential statistical analysis.
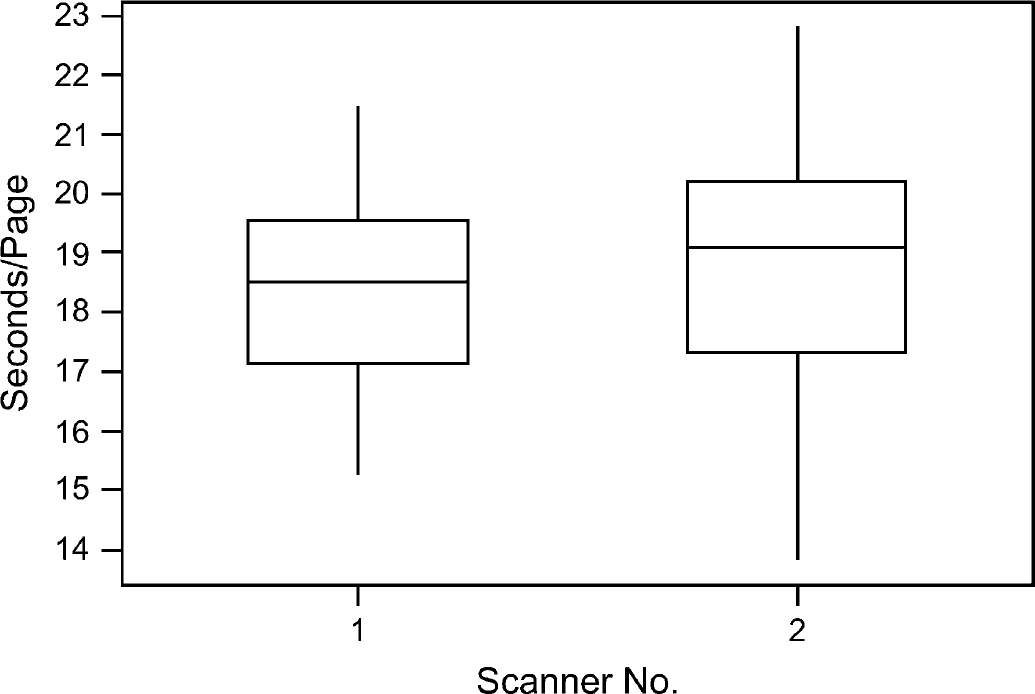
Box plot of performance comparison of scanners.
Comparison of scanner throughput for the experiment was also analyzed as shown in Figure 2. There is apparent variation between two identical name brand scanners. Scanner 1 demonstrates better throughput than scanner 2. It is possible that the configuration setting of each scanner may differ from each other. Figure 3 shows the results of a normality test that was executed to see if the time of scanning per CRF page was normally distributed. For the p-value of 0.889, the distribution was apparently normal. A confidence interval (CI) and associated histogram (Fig. 4) were computed to show the estimated population mean, which falls between 17.822 and 19.289 s per page of CRFs using this new OMR-based CRFs process.
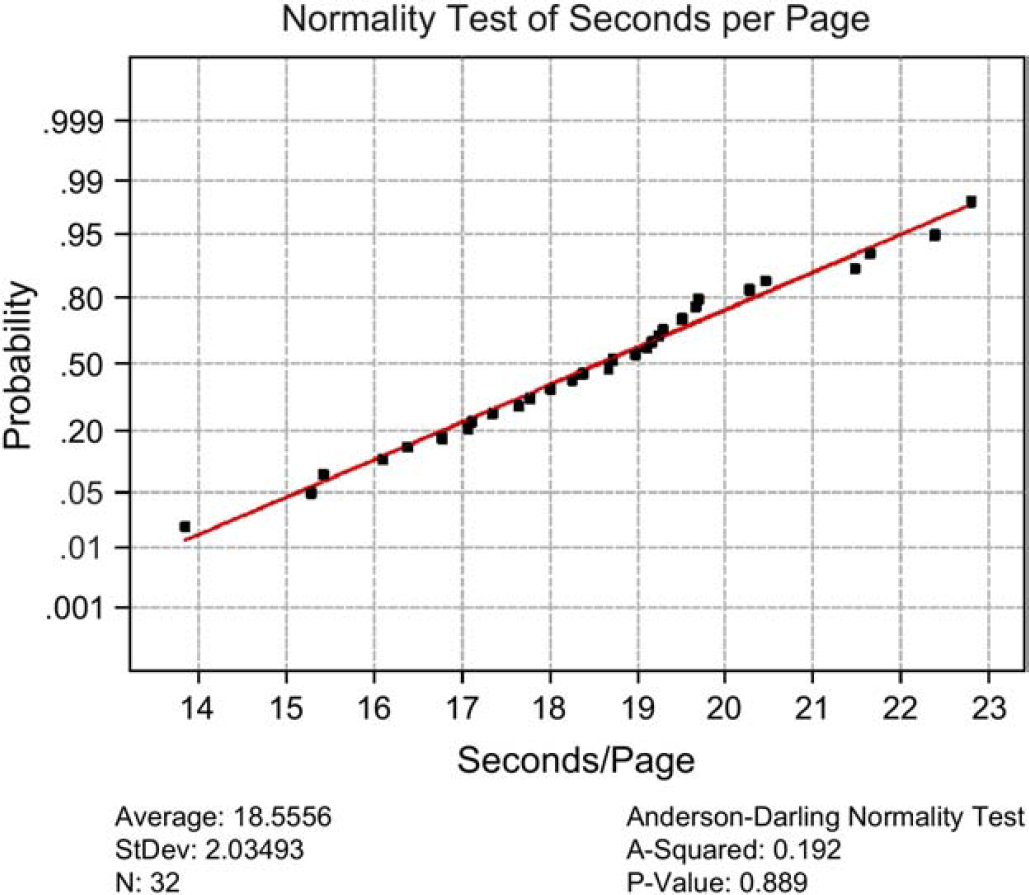
Normality test of cycle time data.
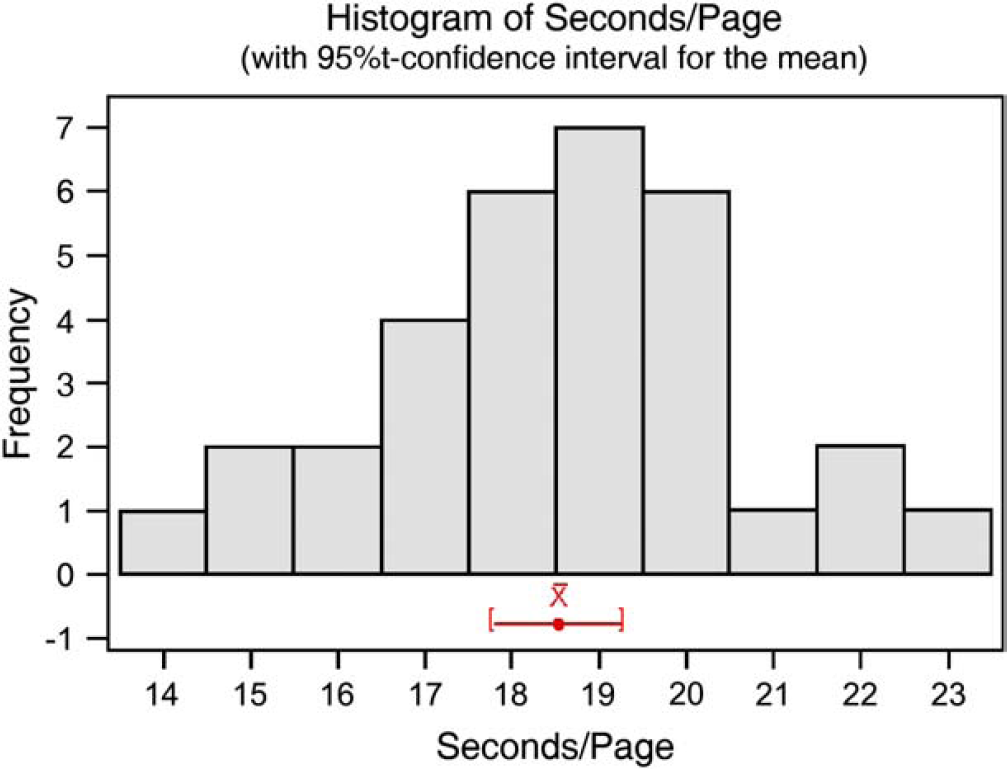
Histogram of CI of cycle time.
Multi-Vari chart was computed (Fig. 5) to examine the interaction between operator and scanner in relation to the throughput performance in terms of cycle time. Early indications were that operator 3 performed with shorter cycle times when using scanner 2 instead of scanner 1, which was opposite to the cycle time pattern of the other three operator and scanner combinations.
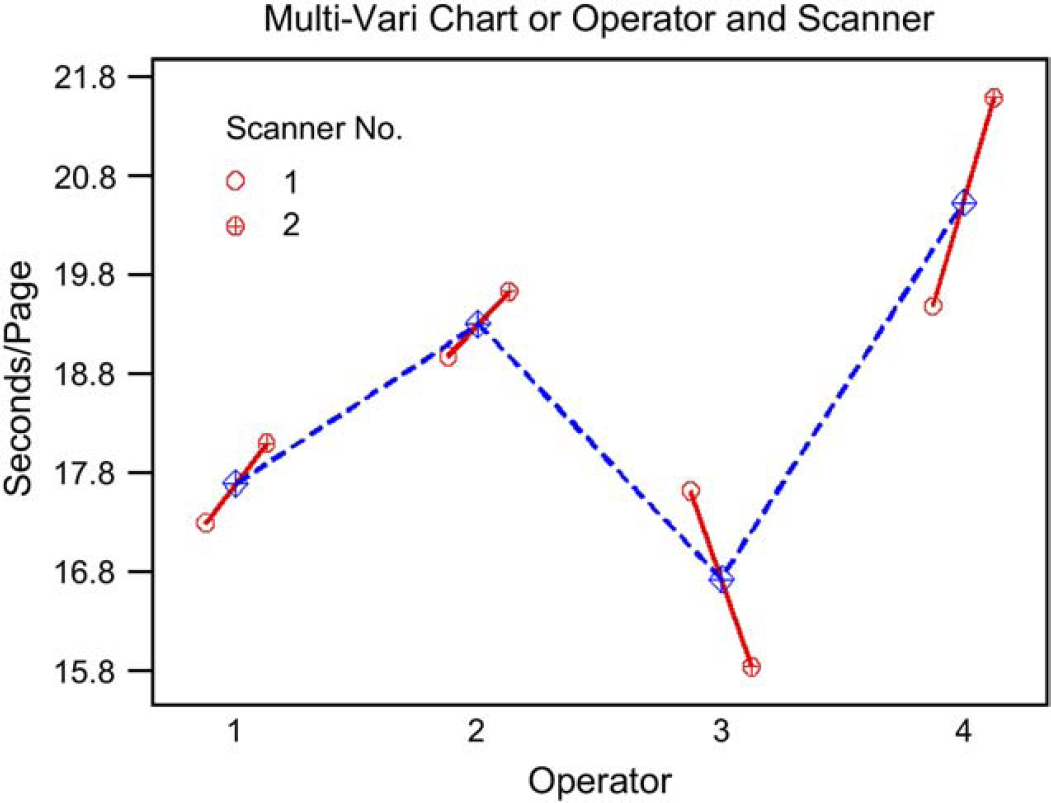
Interaction between operator and scanner performance.
Hypothesis Testing of Mean Time
Given the target process specification for time per page of μTarget = 1 min, n = 32 patients, and population s unknown, a one-sample t-test is chosen (α = 0.05):
The practical problem: Does the new OMR-based data entry process, including first, second, and verification, meet the target specification of 1 min per page? Is the process centered? The null hypothesis H0: μSample = μTarget
The alternate hypothesis Ha: μSample < μTarget
Test assumptions: normality of the data
P-value = 0.889, therefore, data are normal The appropriate test statistic One-sample t-test statistic: seconds/page Test of μ = 60 versus μ < 60 The critical value from a and the appropriate distribution:
p-value = 0.000 < 0.05 The calculated statistic meets the decision rule criteria or if p-value < α, then reject H0
The statistical conclusion into a practical solution: For this one-tailed test, the new OMR-based CRF design and process time required to enter CRF pages as currently performed for first and second entries, and verification, is significantly different from the target specification. The process is centered.
Thirty percent of free form text was still needed to be entered, but all other data were captured via OMR at less than 1 min per page. Figure 6 compares cycle time reduction by each process step before and after the process change implementation. The total savings generated from this process improvement amounted to 42,239 h or 76.6%.
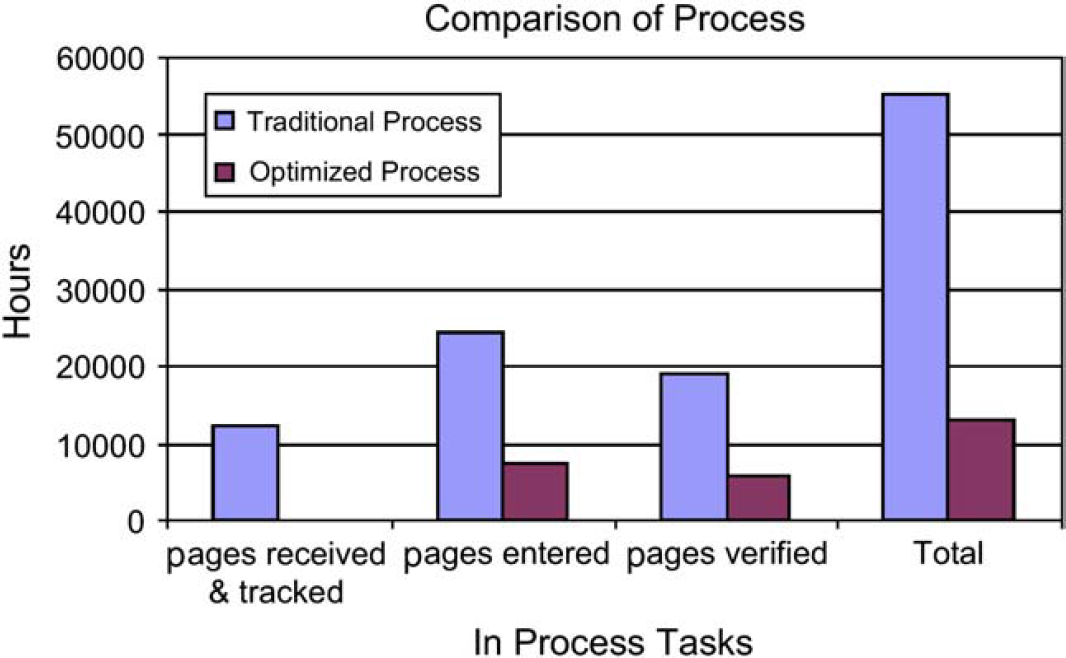
Cycle time comparison before and after process improvement.
Hypothesis Testing of Errors
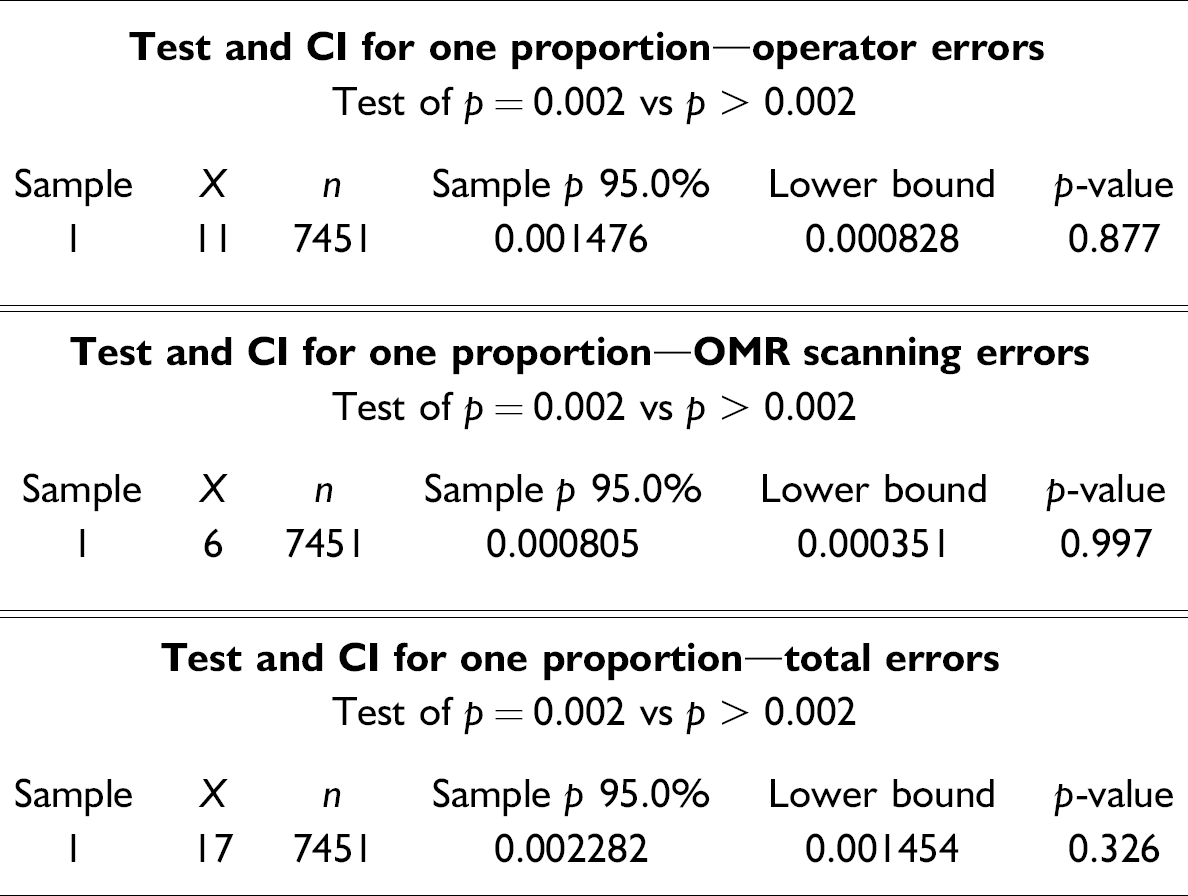
The worldwide standard operating procedure (WSOP) requires that the error rate during QC of a clinical study, for critical and noncritical items, must be below 0.2%. During the experimental test, 11 operator errors and 6 image errors were found from a sample size of data points containing errors, n = 7451; a one-proportion test is therefore chosen (α = 0.05):
The practical problem: Can the OMR-based CRF design and process comply with WSOP, which requires an error rate of 0.2% of critical and noncritical items resulting from QC? The null hypothesis H0: P
Population = P
Target = 0.002 The alternate hypothesis Ha: P
Population > P
Target (history) = 0.002 Test assumptions: normality of the data n × p = 7451 × 0.002 = 14.9 ≥ 5 The data can be approximated by normal distribution. However, for the purpose of minimizing statistical error for this hypothesis test binomial distribution with one proportion is assumed. If the calculated statistic meets the decision rule criteria, then reject H0. Decision rule criteria: Z
Calc > Zα
For each type of error (operator or OMR scanning, and total errors), the decision rule is applied as follows:
p = 0.326 > 0.05, therefore, fail to reject H0
The statistical conclusion as a practical solution: At a 95% likelihood, this test indicates that the error rate generated using the OMR-based CRF process is within the WSOP required 0.2% level for all noncritical items.
Based on the hypothesis test results, descriptive and inferential statistical procedures were exercised at a 95% CI to show that the sample mean for the new process was 18.56 s per page, through the first and second data entry. It was concluded that, with a probability of 95%, CRF pages can be entered in less than 1 min per page using the new process. In addition, at a 95% likelihood, the error rate generated would be 0.08%, which is well below the upper limit of 0.2% specified by the WSOP.
Conclusion
In the highly regulated pharmaceutical industry, if defects and inefficiency exist from the inheritance of traditional methods, thousands of pieces of documented evidence would continue to carry defects and inefficiency. Consumers and shareholders inevitably would see continuous escalation of clinical trial costs and development times, along with high risks of defects in the newly marketed drugs, making patient safety the final casualty.
Technology is not the only solution to cure business performance problems. Traditional workflow must be examined closely and redesigned with breakthrough improvement as the ultimate goal. By eliminating waste and duplication, efficient processes can be accelerated by applying proven methodologies to change the way clinical trials are conducted. Success comes down to the human element, and how well that element is integrated into the clinical trial workflow and processes.
These changes cannot be made overnight, and a long-term commitment from senior management is critical. It could be argued that technological solutions will not be optimal if the underlying business processes are not themselves also streamlined and optimized to take advantage of the speed and robustness of what technology can offer.