
Abstract
We describe a system for collecting usage metrics from widely distributed automation systems. An application that records and stores usage data centrally, calculates run times, and charts the data was developed. Data were collected over 20 months from at least 28 workstations. The application was used to plot bar charts of date versus run time for individual workstations, the automation in a specific laboratory, or automation of a specified type. The height of one bar represented the length of one run, and its position on the x-axis indicated the date the run started. Graphs were visually inspected and few bars on the graph(s) indicated infrequent use. Quantitative data were obtained by running custom SQL queries. Analyses showed that 90% of the automation was used frequently (>8 runs per week). Where usage was less, or limited to part of the day, the causes were investigated by interviewing users. We show that revised user training, redeployment of equipment, and running complimentary processes on one workstation can increase the average number of runs by up to 20-fold and run times by up to 450%. Active monitoring of usage leads to more effective use of automation. Usage data#could be used to determine whether purchasing particular automation was a good investment. (JALA 2006; 11: 16-22)
Introduction
Purchasing laboratory automation is a significant investment for many companies. The costs incurred include the initial purchase price, time, and resources required to install and validate the automation. Companies need methods of evaluating whether the investment has been worthwhile. This article describes a system for collecting usage metrics from a range of laboratory automation systems and shows how the metrics can be used to determine whether laboratory automation is being used effectively.
Cambridge Antibody Technology (CAT) is a bio-pharmaceutical company whose drug discovery process is similar to that of many other pharmaceutical companies. Large libraries of human antibodies are generated using molecular biology techniques, 1 and display technologies are used to isolate library subsets of antibodies that bind to drug targets. 2 These library subsets are screened in functional assays, and the hits are progressed through a characterization cascade to identify potential drug candidates. 3 Many drug discovery projects are run in parallel.
Companies need flexible, scalable laboratory automation that can be applied to a variety of processes and drug targets and adapted to the changing needs of the discovery projects. To achieve this, CAT has purchased a mixture of workstations (independent systems which perform a single specialized function, e.g., colony picking, plate replication) and integrated robotic systems (systems using at least one central robotic arm to move plates between several workstations, e.g., screening systems). These are located in 14 laboratories in two buildings. This makes it difficult to monitor how often each workstation or robotic system is used and whether it is being used effectively. To overcome this problem, a centralized automation monitoring system has been implemented. A client software application is installed on each piece of equipment. It records when the automation is used and the length of the run, and these data are sent to a central database. By interrogating the database, the frequency of usage and the duration of each use can be determined for each workstation and robotic system.
Analysis of the usage metrics data showed that most automation was used very frequently but some was used intermittently. Where automation was not being used, the scientists were consulted to determine the cause of underuse and steps were taken to address these issues. This article uses real examples from CAT to show that additional user training, redeployment of laboratory automation, and re-evaluation of working practices have increased automation usage and given tangible benefits to the organization.
Description of Metrics Analysis System
The metrics system was designed as a generic solution for tracking the usage patterns of the laboratory automation. Due to implementation differences between different automation vendors, there is no single approach that can be used to detect whether a workstation or robotic system is in use at any given time, therefore several approaches were devised. All these approaches record the same information – the start and stop times of the workstation or robotic system. This information is stored in an Oracle database for subsequent analysis.
Where the software controlling the automation can be scripted to invoke an external program at both the beginning and end of a protocol, the software was configured to invoke a simple Java client that sends messages to a remotely running Java servlet, which stored the information in the database. The client sends the ‘start’ message and time at the start of the protocol and the ‘stop’ message and time at the end of the protocol.
For cases where external programs cannot be run within the protocol, an indirect method of detecting use was used. In most cases, the automation creates or modifies a log or results file when it carries out an operation. The change or the creation of a new file was used as an indicator of the beginning of the protocol. The end of a protocol was inferred by the new results file handle being closed or a notification of the completion of the protocol being written to the log or results file. To implement this approach, a permanently running Java client was written, which was configured to poll for these various modifications. When the client was installed it was configured depending upon the precise method required for that piece of automation.
An application for graphically representing the usage patterns of the automation was developed in Java, and the open-source charting package JFreeChart 4 was used for plotting graphs. The Graphical User Interface (GUI) allowed the user to select individual workstations or robotic systems (left hand scroll pane, Fig. 1), all of the workstations or robotic systems in a given laboratory (middle scroll pane, Fig. 1), or all of the workstations of a particular type (right hand scroll pane, Fig. 1). The data could also be filtered by date so that results for a specified time period were displayed (“Start Date” text fields, Fig. 1) or filtered based on the duration of the run (“Run time” text fields, Fig. 1). The filters were enabled by clicking the buttons at the bottom of the GUI and removed by clicking the “Clear Filter” buttons (Fig. 1). A graph of the filtered data was produced by clicking on the “Redraw Graph” button at the top right hand side of the screen (Fig. 1). For the laboratory automation that had been selected, the software calculated the length of each run by subtracting the time the run started from the time the run finished. The software allowed run time data to be binned according to various periods (“Bin Periods” buttons, right hand side, Fig. 1). This allowed the user to bin runs that occur in a given time period, for example, if “Day” were selected, all of the runs occurring on that day were binned together, and a total run time for that day (“Run time sum”) was calculated. In practice the default binning period “Second” was used for all routine analyses. The run times were measured to the nearest second, and when the default binning period was used each run was represented as a distinct event when the data were plotted. The application plotted “Run time (Sum)” in hours on the y-axis against “Start Date” on the x-axis (Fig. 1). Where “Second” was used as the binning period, each vertical line represented one use of the selected laboratory automation, the height of the line represented the length of the run, and the position of the line on the x-axis indicated the date that run started (Fig. 1). Where multiple workstations or robotic systems were plotted, each one was represented by a different color (Fig. 1).
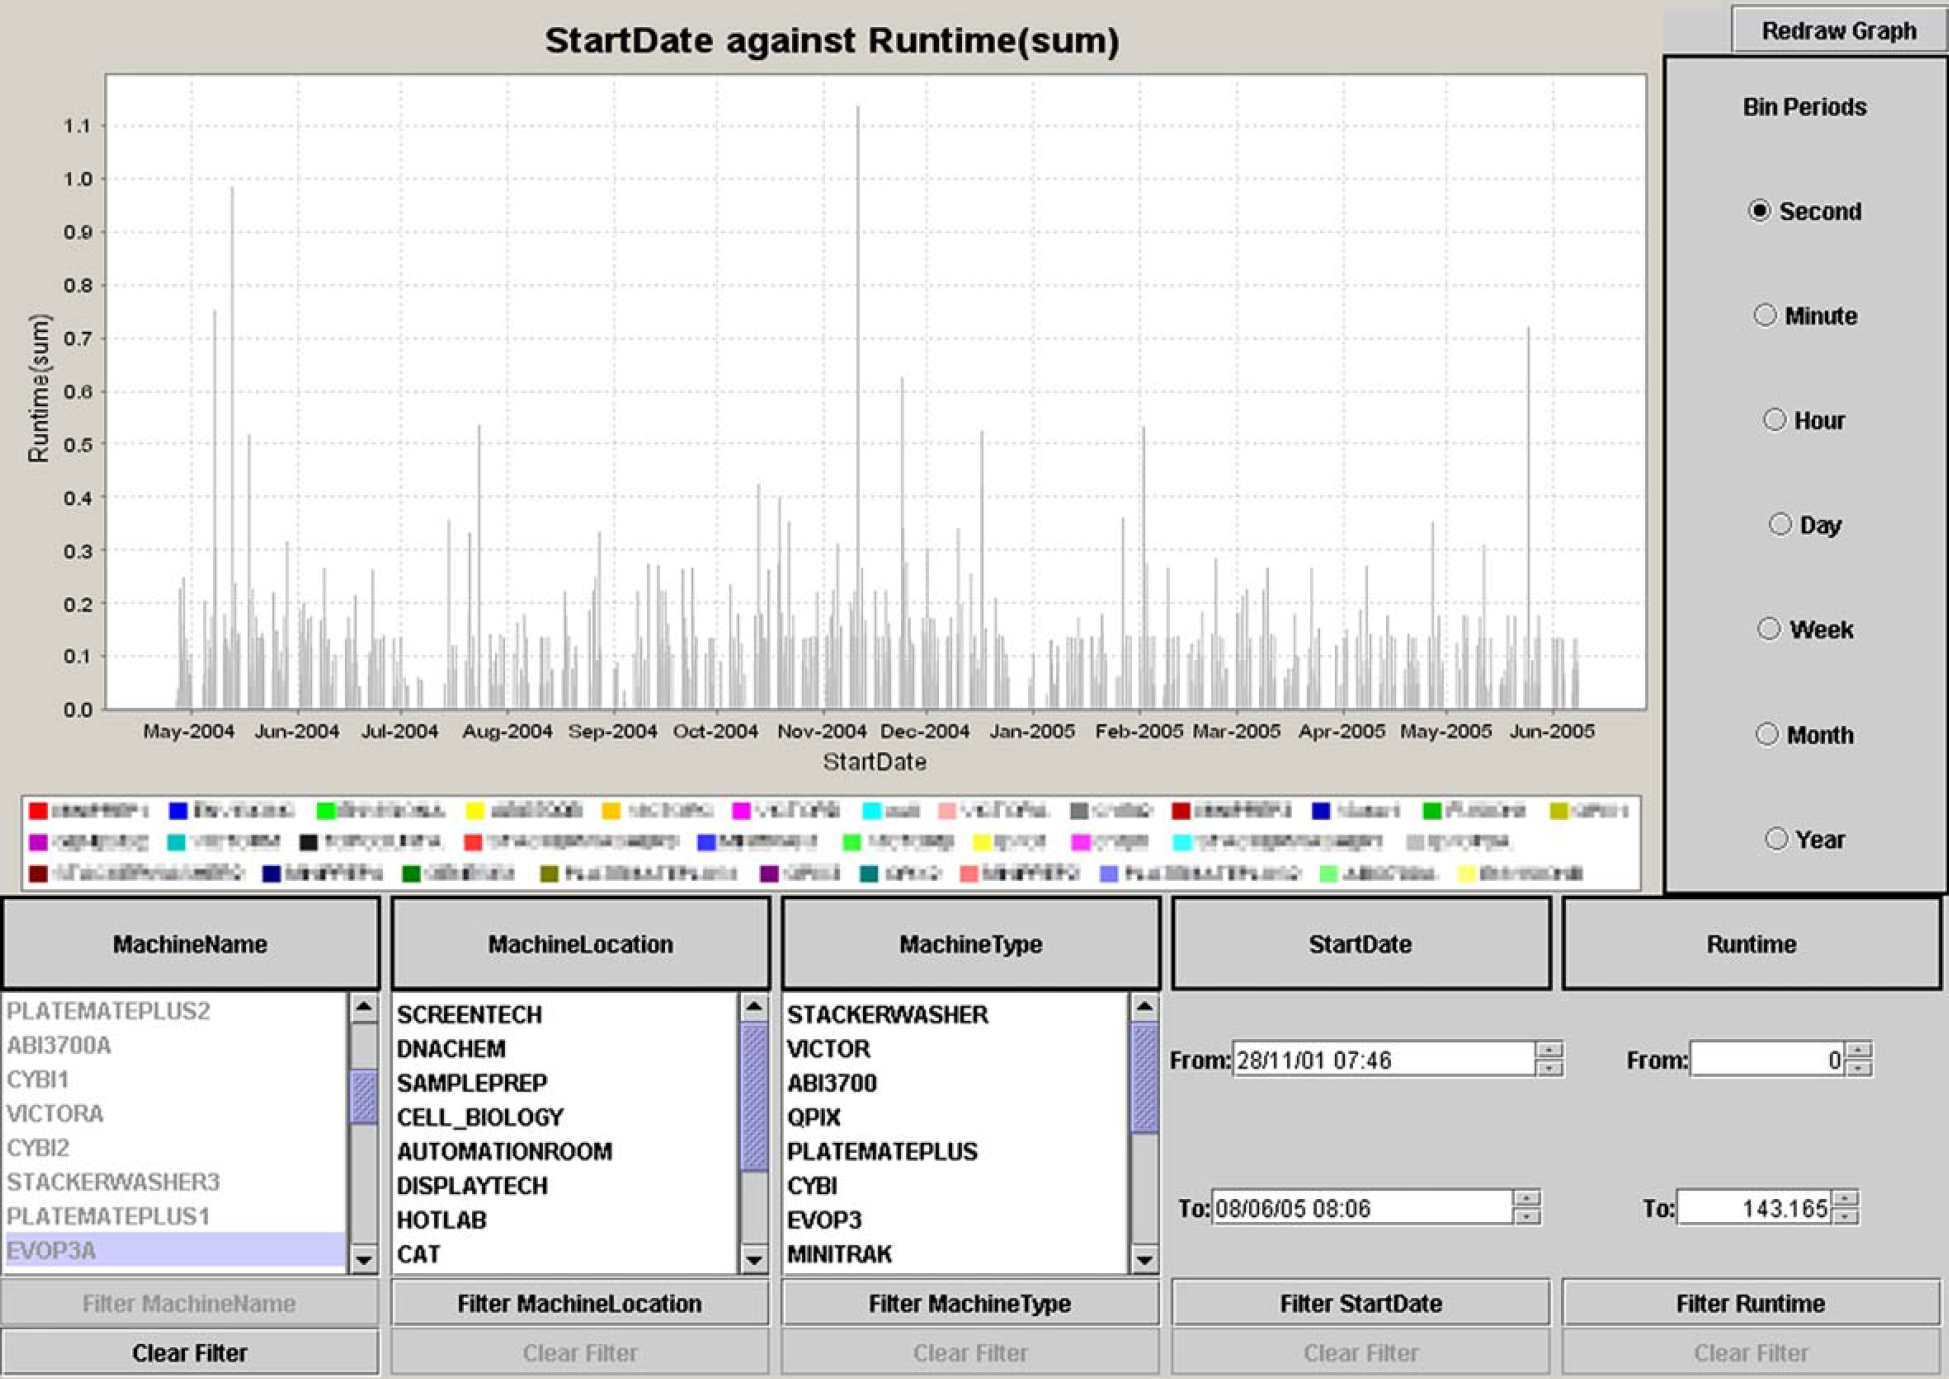
User interface of the automation usage metrics application. It allows individual workstations, all of the workstations in a given laboratory, or all of the workstations of a particular type to be selected. The data can be filtered by date so that results for a specified time period are displayed. A graph of the filtered data is produced by clicking on the “Redraw Graph” button. The graph shows “Run time” in hours on the y-axis against “Start Date” on the x-axis. Each vertical line represents one use of the selected laboratory automation, the height of the line represents the length of the run, and the position of the line on the x-axis indicates the date that run started. Where multiple workstations are plotted, each one is represented by a different color.
The metrics gathering system was implemented in August 2003 and collected data from 28 workstations and robotic systems. As new automation was purchased it was added to the metrics gathering system, and in May 2005 data were being collected from 32 workstations and robotic systems.
Analyses of the metrics data concentrated on identifying equipment that was not used regularly. This was defined as equipment that had less than eight runs per week. CAT's discovery process allowed high-throughput screens to be conducted on 4 days each week. Because screen sizes were smaller than small molecule screens and several projects were run simultaneously, more than one screen was conducted each day. The definition assumed that the automation for picking colonies, supplying screening samples, and conducting the screening should be used at least twice a day, 4 days a week. This definition suited the initial use of the metrics data at CAT. Other organizations may prefer to use other definitions or different criteria for each workstation or robotic system.
The metrics data were examined every 1-3 months; the time interval depended on the workloads of the automation specialists. The data for the time period since the last analysis were filtered by “Machine Location” and plotted or filtered by “Machine Type” and plotted. The resulting graphs were visually inspected, and with a small amount of experience it was relatively easy to identify workstations or robotic systems that appeared not to be used regularly. To confirm the initial conclusions, the data were filtered by “Machine Name” to produce graphs for the individual workstations or robotic systems. Infrequent use was usually easily identified because there were few bars on the graphs. Where quantitative data were required on usage, custom SQL queries were written, and the exact number of runs in a given period, their start dates, and the exact length of each run were obtained from the Oracle database. Where appropriate, these data were exported to Excel for further analyses (e.g., to confirm the results of visual inspection or to produce quantitative data for this communication). This procedure identified automation that was used for less than eight runs a week. Subsequently, automation scientists consulted with the potential users of the relevant automation to determine why it was being used infrequently.
Results from Metrics Analysis
Analysis of the metrics data showed that 29 of the 32 workstations or robotic systems were used more than eight times per week. For example, a new plate replication system was installed in the screening laboratory for use as a homogeneous assay platform. Following initial testing and validation the replication system was used for at least eight runs a week within 1 month of routine use and its use increased over time (Fig. 2). In the first 6 months after installation, the replication system averaged 16 runs per week (Table 1). The metrics data also showed periods of downtime caused by servicing, breakdowns, or a lack of project demand for the task the automation performed. The plate replication system was rarely used in October 2004 because the pipetting head developed a fault, and a new head had to be ordered and installed. The metrics data showed the decreased use (Fig. 2).
Examples of automation use
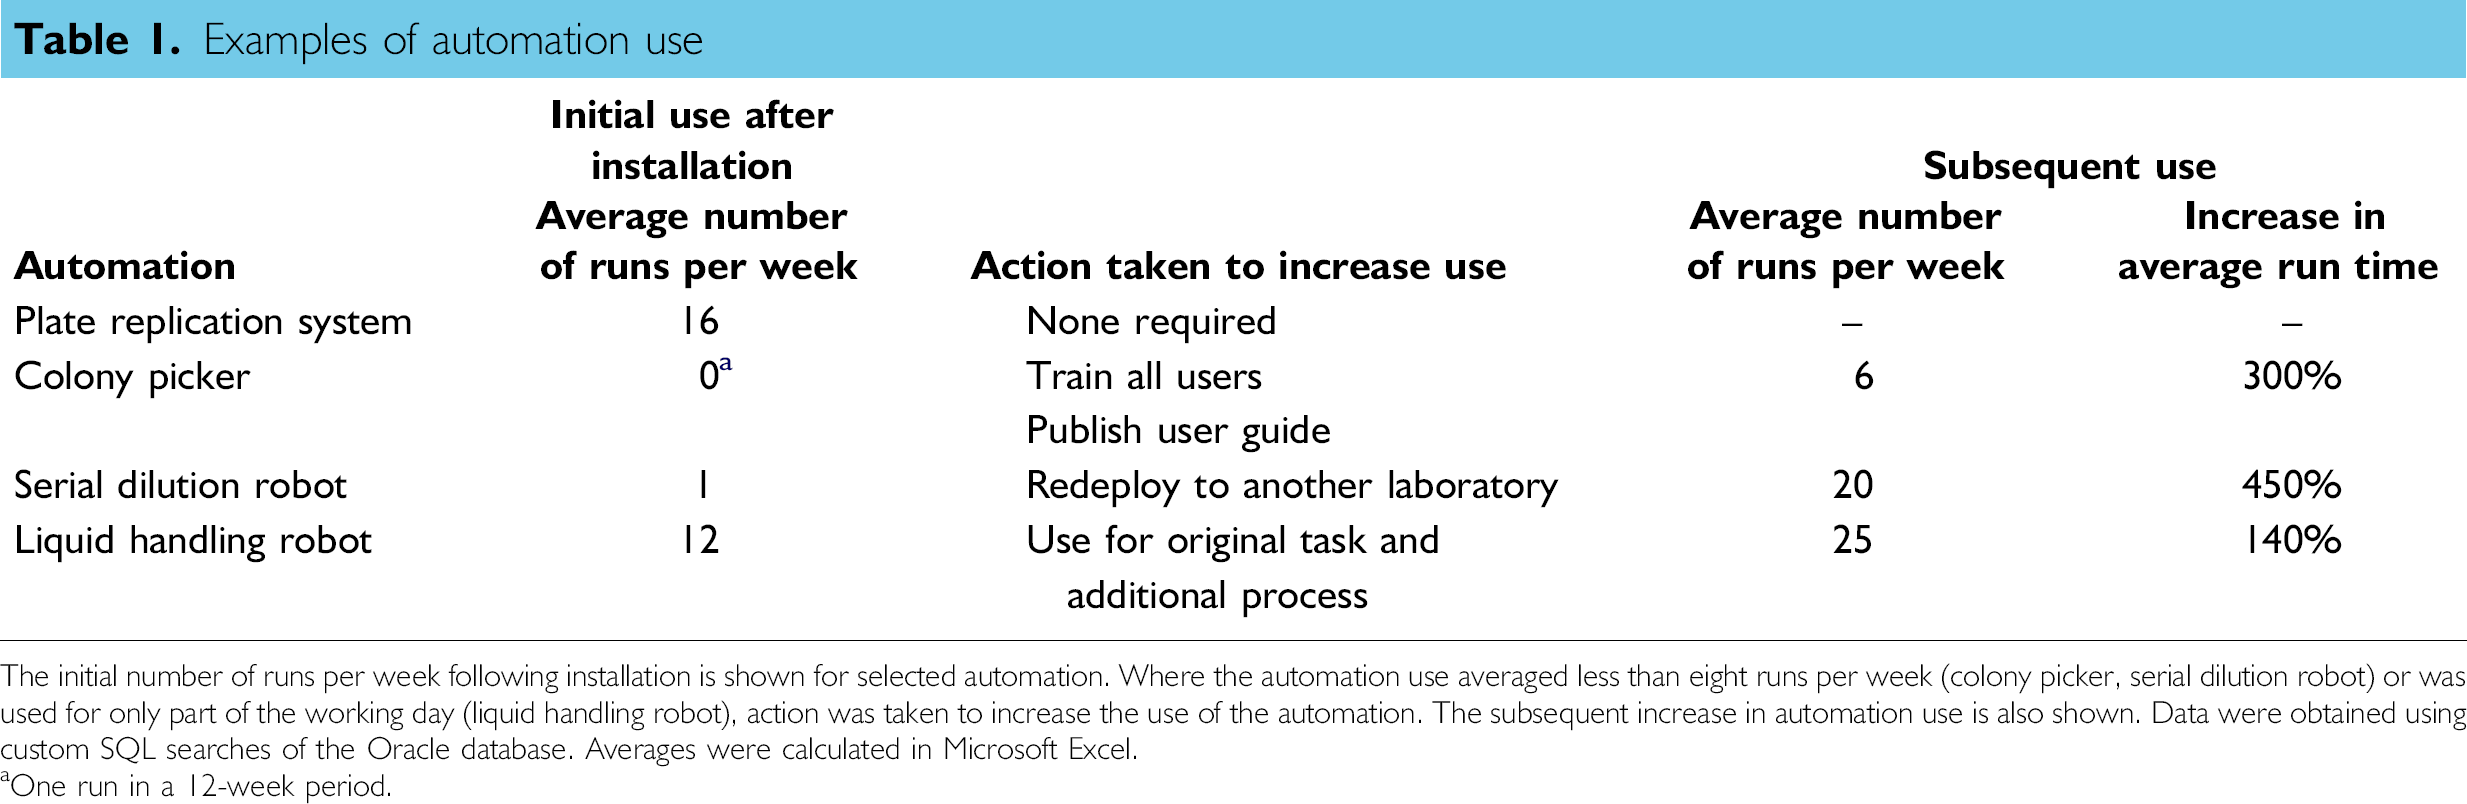
The initial number of runs per week following installation is shown for selected automation. Where the automation use averaged less than eight runs per week (colony picker, serial dilution robot) or was used for only part of the working day (liquid handling robot), action was taken to increase the use of the automation. The subsequent increase in automation use is also shown. Data were obtained using custom SQL searches of the Oracle database. Averages were calculated in Microsoft Excel.
One run in a 12-week period.
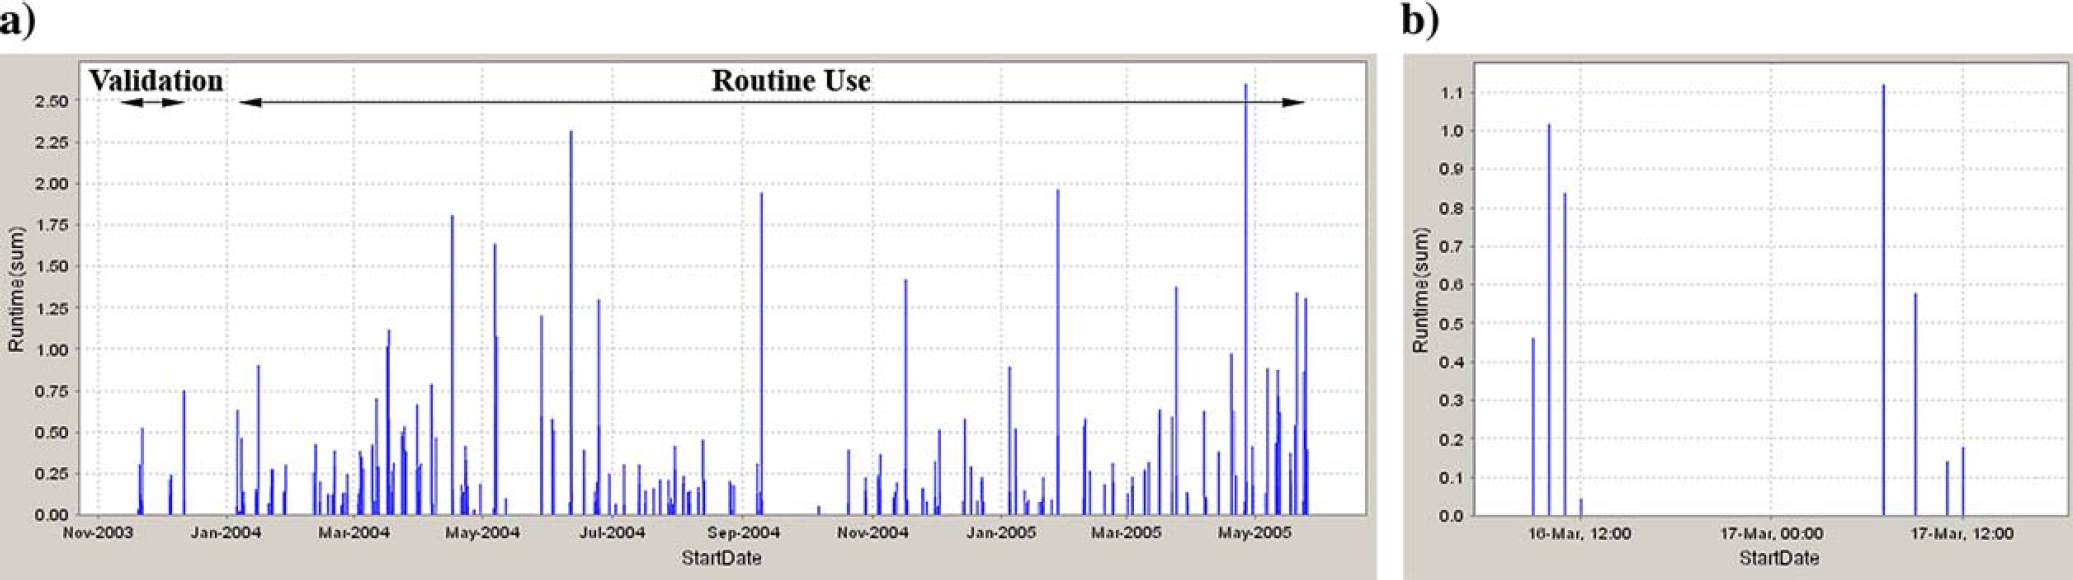
Graph showing use of a plate replication system in the screening laboratory (“Run time” in hours on the y-axis against “Start Date” on the x-axis). (a) The replication system was set up and validated at the end of 2003 and had a high level of use over the following 16-month period; (b) the metrics analysis GUI allows automation use to be studied in a variety of ways, for example, individual days.
The metrics revealed that three workstations, although they had been fully tested and validated, were not used for an average of eight runs per week. Two examples will be described. Scientists in a large molecular biology laboratory containing 34 staff had highlighted the need for an automated bacterial colony picker. A colony picker was installed in June 2004, two lead users were trained to operate it, and the scientists informed that it was available for use. In August 2004, the usage metrics showed that the colony picker had hardly been used (Fig. 3). Interviews with scientists showed that there was still a high demand for colony picking, but the potential users did not feel they knew how to operate the workstation and lacked the confidence to use it. In September 2004, in response to this feedback, further training was given to all the potential users of the colony picker (instead of just the two lead users). A set of easily understandable, step-by-step guidelines on the use of the colony picker was produced and placed by the workstation to give individuals the confidence to operate it on their own. Uptake was good (Fig. 3) and the frequency of use increased from virtually nothing to an average of six runs per week (Table 1). In this instance, extra training and instruction increased scientists' knowledge of, and confidence in, the workstation, therefore increasing its usage.
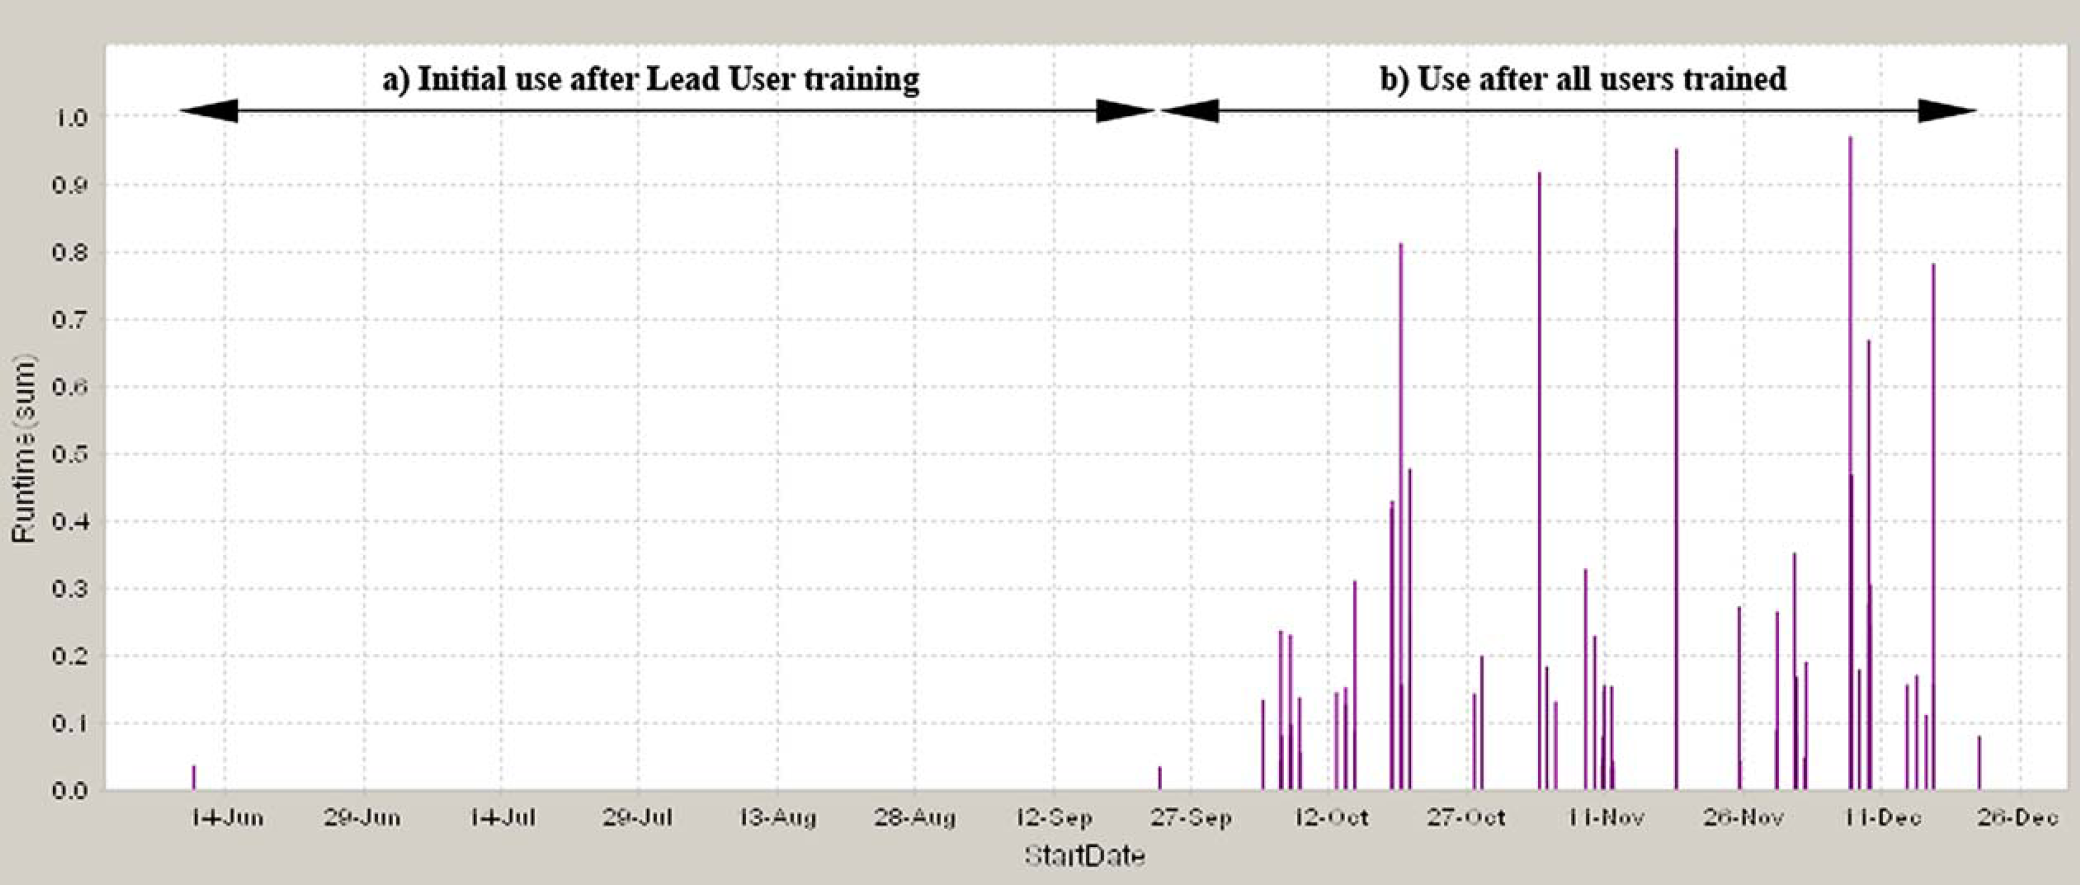
Graph showing colony picker usage (“Run time” in hours on the y-axis against “Start Date” on the x-axis). (a) Initial use following installation and training of two lead users; (b) use following the training of all potential users and the introduction of a step-by-step user guide placed near the colony picker.
It is interesting to note that although the underuse of the colony picker was identified in early August 2004, the metrics showed that its use did not increase until October 2004. During August and September 2004, the scientists were consulted to identify why the workstation was not being used, guidelines were written on the use of the robot, user feedback on the guidelines was obtained, and training on the use of the colony picker was organized and given to 34 staff. The automation metrics only measured the use of the workstation and do not reflect the other activities that led to increased use of the colony picker.
In a second example, scientists involved in drug discovery projects perform serial dilution of compounds before determining their IC50 values in assays. To automate this process, a serial dilution robot was installed in the laboratory in August 2003. The metrics showed that in the following 7-month period the serial dilution robot was rarely used (Fig. 4). The causes of the low usage were investigated. Scientists working in discovery laboratorie tested only a few compounds (12-16) at a time and found that it was quicker to dilute the samples manually rather than setting up and validating the serial dilution robot before using it. The scientists would need to test more than 32 samples at a time for automated serial dilution to be a viable alternative. Thus, although the serial dilution robot worked accurately it was unlikely to be used frequently, and an alternative use for it was investigated. In another department, scientists conducting clinical trials regularly have to perform serial dilutions of a large number of test samples in a highly reproducible manner. Experiments showed that the serial dilution robot was able to dilute the clinical samples with the required accuracy and reproducibility (see the peaks of activity in September and November 2004 shown in Fig. 4). Following satisfactory validation, the serial dilution robot was relocated to the clinical laboratory, and the usage metrics showed that it was being used on a regular basis in its new location (Fig. 4). Its use increased from approximately once a week in discovery to 20 runs per week in the clinical laboratory (Table 1). Additionally, the average run time increased significantly following relocation of the serial dilution robot reflecting the fact that more samples were being tested per run (Table 1). In this example, redeploying the workstation allowed it to be applied to an important task, increased its use, and automated a labor-intensive process that had previously been performed manually.
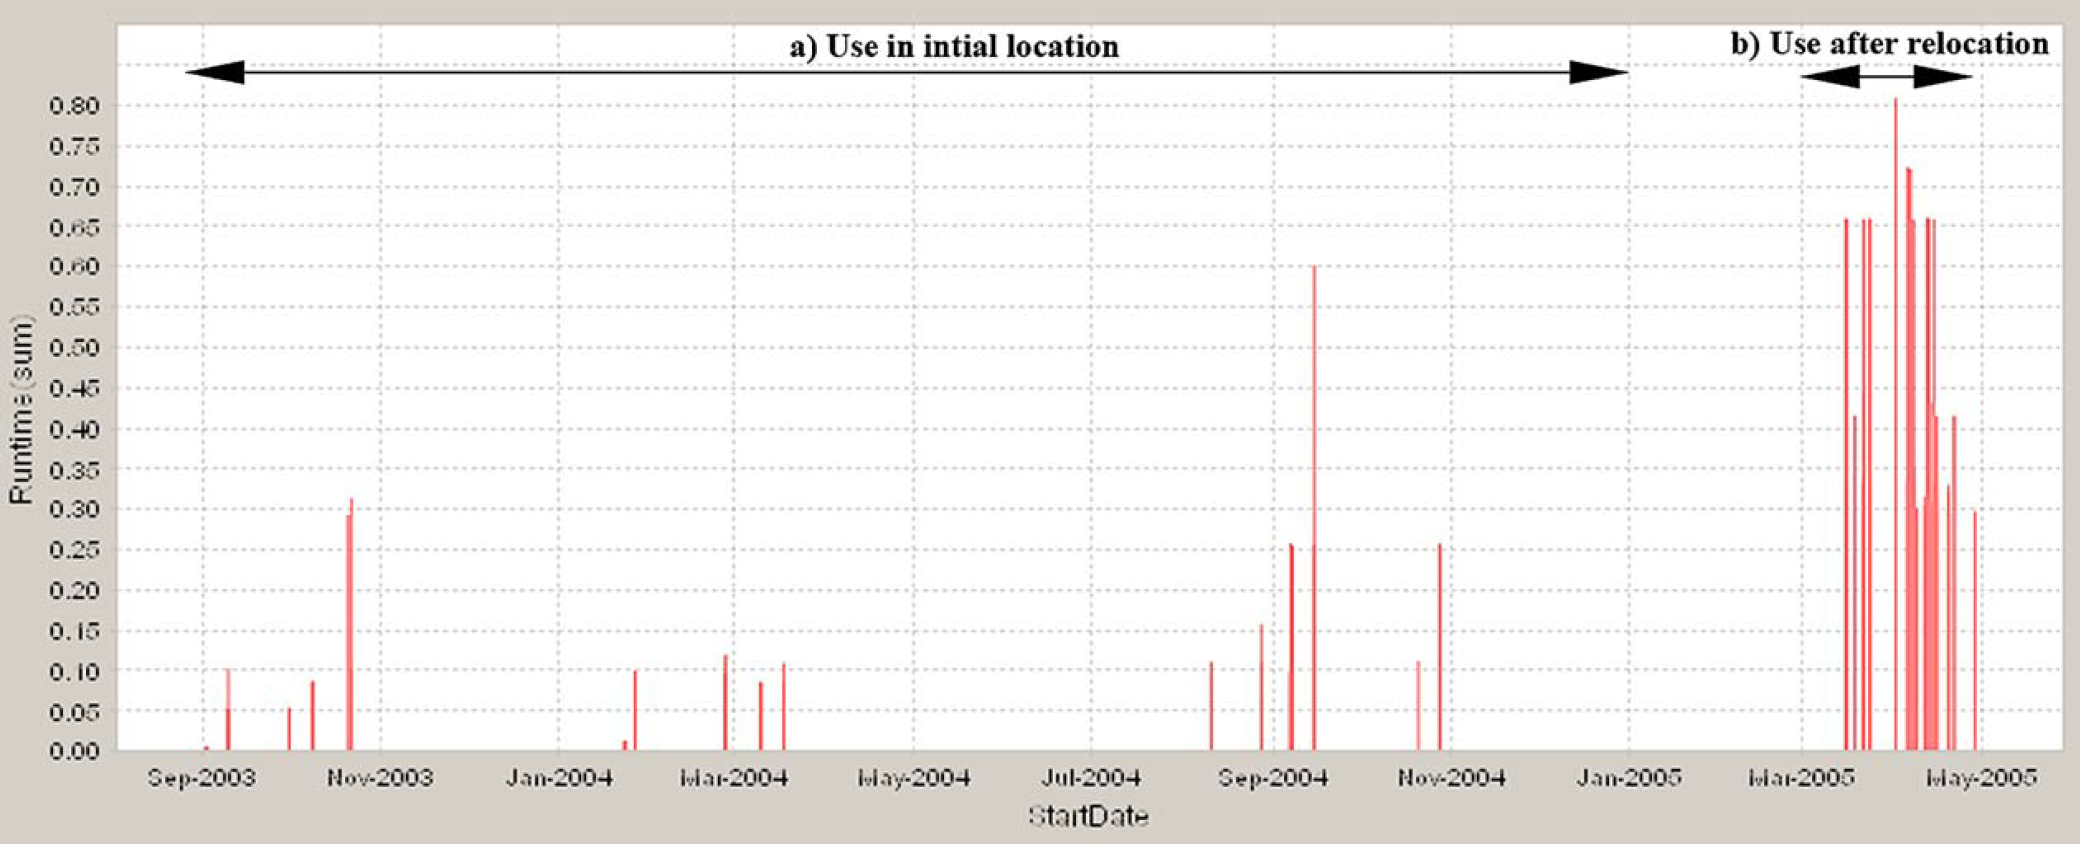
Graph showing use of serial dilution robot (“Run time” in hours on the y-axis against “Start Date” on the x-axis). (a) Use following installation in initial location in a discovery laboratory where scientists rarely tested sufficiently large numbers of samples to warrant use of the serial dilution robot; (b) use following relocation of the serial dilution robot to a laboratory analyzing clinical samples where serial dilution of large numbers of samples is performed routinely.
The serial dilution robot was an example of using the automation metrics data to influence laboratory scientists. The underuse of the serial dilution robot was apparent at the end of 2003 (Fig. 4), however, the users believed that their workloads would increase in 2004, and they would be generating a sufficient number of IC50 values to warrant the use of the workstation on a regular basis. They were reluctant to allow it to be moved to another laboratory. The metrics data for 2004 showed that the use of the serial dilution robot had not increased (Fig. 4), and when this was discussed with the users they accepted that they were not using it regularly and agreed that it could be redeployed. Although there was a delay in redeploying the serial dilution robot the metrics data provided a useful tool to persuade users that it was sensible to redeploy the workstation to another laboratory that would make greater use if it.
Analysis of the usage metrics also identified workstations that were used regularly but only for short, defined periods. For example, a 96-well liquid handler in the sequencing laboratory was used to clean up DNA samples and prepare PCR plates. Graphs of the metrics data showed that it was used regularly each day but only after 11.30 am (Fig. 5), and this was confirmed by custom SQL searches of the Oracle database. This showed that the liquid handler was not operating at capacity. Scientists were consulted to determine whether the liquid handler was necessary and whether its use could be increased. Although it was not used for most of the morning the liquid handler had improved throughput by automating sample preparation and PCR set up and enabled sequencing reactions to be performed in 384-well format. The liquid handler ran unattended, which allowed the scientists to perform other tasks and it had contributed to increased quality and reproducibility of sequencing results. 5 However, the nature of the DNA sequencing process dictated that the liquid handler would only be used after 11.30 am each day. Before that it could be used for other purposes. In June 2004, the replication of bacterial cultures from master stock plates to the sample plates used for screening was performed manually. This plate replication could be scheduled from 9 am to 11 am each day and could be interleafed with the existing use of the liquid handler (Fig. 5). The dual use of the liquid handler for DNA sequencing work and bacterial culture plate replication continued until the demand for automated plate replication increased to a level where a dedicated robot was required. In this example a distinct work pattern was identified that allowed two different processes to be run on the workstation. This increased the effectiveness of the workstation, its use was more than doubled, and the average run time increased slightly (Table 1). Additionally, it allowed the bacterial culture plate replication process to be automated and miniaturized from 96-well to 384-well format.
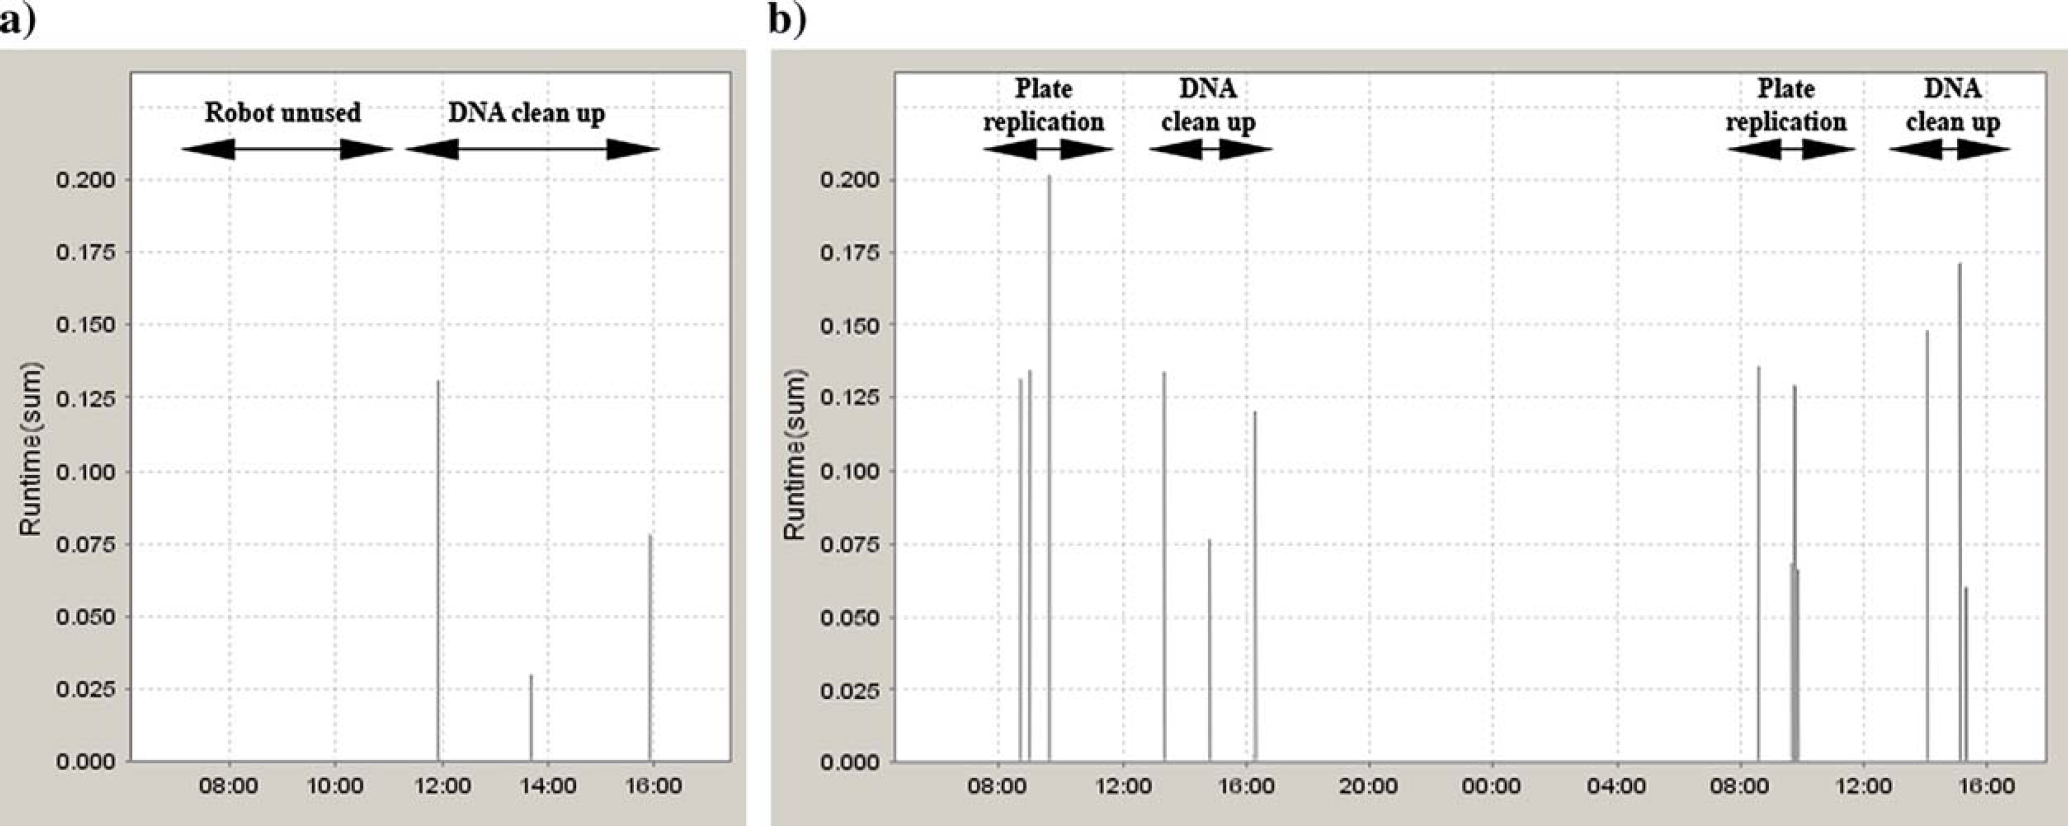
Graphs showing use of a 96-well liquid handler (“Run time” in hours on the y-axis against “Start Date” on the x-axis). (a) A typical day where the liquid handler was used to clean up DNA samples and prepare PCR plates after 11.30 am; (b) 2 days where the liquid handler was used to replicate bacterial culture plates before 11.30 am and clean up DNA samples and prepare PCR plates after 12.00 am.
Discussion
This article describes the implementation of a usage metrics system and demonstrates the possibility of presenting an accurate picture of automation usage in a highly distributed environment. Analyses showed that for the majority of automation uptake is rapid and it is used frequently. For some workstations, however, uptake and use were lower than expected, and the automated metrics gathering system allowed this to be identified. Although the metrics data identified patterns of automation use, it could not determine why these patterns occurred. The examples described here show that actively engaging with scientists to investigate the patterns of automation usage was important to fully understand the causes of limited use. These discussions with scientists identified several situations where infrequent use of automation can occur, namely limited understanding of the automation, insufficient volume of work requiring automation, and the laboratory process dictating a particular pattern of use. In our experience, when automation metrics were shared openly in the context of understanding patterns of automation usage, scientists responded positively and actively engaged in a discussion of how to enable automation to better meet their needs or the needs of their colleagues.
The solutions that were implemented to increase the use of the automation were essentially very simple (i.e., additional training and guidance, redeployment of automation, and running two complimentary processes on one workstation) and cost effective. They increased the use of the automation significantly and allowed existing processes to be automated without the purchase of additional automation. In a more subtle way they helped influence how teams in different laboratories worked together, stimulated discussion about improving processes, and encouraged sharing of automation.
Without an automated metrics gathering system, the issues described in this article may not have been identified and the solutions might not have been implemented. This indicates that in a distributed environment active, ongoing monitoring of equipment usage is vital to ensure that equipment is used effectively and that new solutions can be deployed to meet the changing scientific needs. However, our use of the automated metrics gathering system could be improved. A regular monthly data analysis routine would be an improvement and would allow earlier identification of issues. For example, the underuse of serial dilution robot could have been identified earlier and it could have been redeployed more quickly if the metrics data had been analyzed each month. To date, we have concentrated on identifying automation that is underused, and we should also investigate whether automation is subject to very high use that would indicate it is becoming a potential bottleneck. The current automation metrics system could easily identify automation that is being heavily used.
Monitoring equipment use also has many managerial benefits. Usage data could be used to demonstrate that automation is being used effectively, validating the purchase of the equipment. It can help to justify future investment in automation by identifying bottlenecks. Usage data could be used to determine whether purchasing particular automation has been a good investment. For example, dividing the cost of the automation by the number of runs or the total run time in the first year of operation could provide a measure of the return on investment. It would be interesting to investigate if this would be a useful measure of return on investment by comparing the calculated data for a wide variety of automation.
Implementing an automated metrics gathering system will have a cost. In this example, one person designed the architecture of the system in 6 weeks, created the metrics database in 1 week, and created the GUI in 2 weeks. Thus, designing and building the basic system took a total of 9 weeks for one person. The time taken to install and validate the Java client on each workstation or robotic system varied. Where the software controlling the automation could be scripted to invoke an external program at both the beginning and end of a protocol, this took around 2 h per installation, and where an indirect method of detecting use was used it took 1-3 days per installation. To design, build, and install the metrics system in its initial form where it collected data from 28 workstations and robotic systems took a total of 12 weeks. This was a relatively quick project, and we believe that the ability to analyze automation usage data has made this investment worthwhile.
Centralized systems to monitor automation are becoming more widely used, for example, to monitor the performance of laboratory equipment by recording and analyzing QC statistics, 6 to provide web-based information on the status of analytical instruments so potential users can determine whether an instrument is currently available for use, 7 and in this case to monitor robot use and allow decisions on the effectiveness and deployment of laboratory automation. It would be interesting to see these different approaches integrated into more extensive automation management systems that would collect and present a range of data for a wider variety of purposes. Such systems could deliver benefits at many different levels in an organization, for example, allowing scientists to see if equipment is available at a given time, automation specialists to evaluate the accuracy and reproducibility of robots, and managers to decide about the effectiveness of specific pieces of equipment and plan future investments.
Acknowledgements
We thank Tim Dilks and Rachael Eastwood for their help in preparing the manuscript and Jon Large for preparing the figures.