
Abstract
Aqueous solubility is one of the most critical physicochemical properties to be determined in the process of drug lead optimization. Particularly, an equilibrium solubility method is highly valuable to the study of structure property relationship (SPR), while meeting the needs of analytical sensitivity, reproducibility, and throughput. In this report, an automated solubility assay in a 96-well library format was designed and developed by means of robotic liquid handling, centrifugal separation, and HPLC-UV quantification. Requiring 1 mg of solid compound, this assay was used to determine the equilibrium solubility in three user-selected media, that is, 0.01 N HCl, phosphate buffer saline (PBS), and fasted state simulated intestinal fluid (SIF), with a throughput of up to 192 compounds a week. The assay parameters, including the equilibration time and the separation technique, were optimized to ensure that the thermodynamic solubility was measured at the presence of excess solid compound. A fast gradient HPLC method was developed with single-point on-plate calibration for each compound, followed by a customized 96-well chromatographic data analysis. The reporting solubility range was 1–200 μg/mL, appropriate for oral drug candidate selection at the stage of discovery lead optimization. Based on the test results obtained on the commercially available drugs and Amgen research compounds, this assay was considered to be equivalent to the conventional shake-flask methods. Examples were given to demonstrate that the thermodynamic solubility determined by this assay enabled the SPR study to support drug lead optimization.
Keywords
Introduction
Selection of an oral drug candidate to be developed always involves evaluation of its physicochemical properties, such as solubility, pKa, and lipophilicity. Particularly, aqueous solubility has become a more critical issue in the process of drug discovery. First, the increased structural complexity of new chemical entities (NCE) produced by synthetic or combinatorial approaches often render molecules with higher molecular weight and lipophilicity, thus lower solubility. Driven by the need of special formulation to enhance in vivo absorption, development of a low solubility compound is more costly and time-consuming than for a drug with a more desirable solubility property. Second, drug design in the discovery stage is primarily focused on the receptor binding potency and selectivity without sufficient consideration of the pharmacokinetic properties. Consequently, a significant number of development candidates failed to reach market because they were lacking sufficient “druglike” properties. 1 By evaluating drugs on the market, Lipinski 2 established the Rule of Five to predict the druglike properties of compounds, and still, aqueous solubility is one of the most important physicochemical properties to be determined as early as possible. Although computational methods can be used to calculate a predicted solubility value as part of rational drug design process, experimental measurement of an accurate solubility value is necessary during the key process of drug lead optimization. 3 Specifically, the equilibrium solubility is useful in the study of structure property relationship (SPR) as well as in the correlation to pharmacokinetic data. In drug discovery, high throughput screening (HTS) has been widely used in activity assays; however, the equilibrium solubility measurement has been a bottleneck due to its requirements for material, time, and labor. Therefore, a high-throughput equilibrium solubility assay is a highly valuable tool for the optimization of promising drug leads in order to increase their chances for success, and ultimately to reduce the cost and the time for drug development.
High-throughput solubility methods have been widely reported, utilizing compounds in dimethyl sulfoxide (DMSO) solution and taking advantage of the ready sample supply used for activity screening. With a number of detection techniques to choose from, the methods usually can be automated to enable HTS using 96-well microtiter plates. Several protocols have been published for ranking solubility by means of turbidity, nephelometry, or flow cytometry.2–4 For example, high-throughput measurement of kinetic solubility has been reported using an integrated system of robotic liquid handling, plate handling, and nephelometry detection. 5 To improve the detection sensitivity, high-throughput solubility assays using a UV plate reader have also been developed.6, 7 In all these methods, however, the DMSO cosolvent has to be less than 5% (v/v) in the aqueous buffer in order to avoid solubility enhancement by the presence of DMSO. Therefore, the routinely supplied 10 mM DMSO stock solution dictates a fixed upper limit of solubility, that is, 0.5 mM in 5% DMSO buffer. The main drawback is that, even when the DMSO solution is diluted with buffer to 1% or less, the presence of DMSO may increase the solubility to an unknown and unpredictable extent and cause erroneous results for the compounds across the biopharmaceutics classification system (BCS).8–10 Furthermore, the formation of precipitate or excess solid at the presence of DMSO tends to negate the polymorph or crystal lattice effects, resulting in the determination of a kinetic solubility through a short duration of the experiment. Although kinetic measurement has been proven useful in the early discovery stage from an activity screening perspective, the kinetic data cannot serve as a substitute for the thermodynamic solubility to predict the drug properties or establish SPR during lead optimization.
The conventional shake-flask methods determine the equilibrium solubility and usually require several milligrams for each measurement performed by adding the solid into the aqueous buffers until saturation. Typically, an aliquot sample is taken after 24 h, filtered, and quantified by HPLC-UV for solubility. This method has several drawbacks: (1) At the discovery stage, compounds are available only in limited quantities, and consumption of several milligrams of compound for solubility profiling in multiple pH buffers is considered to be impractical; (2) The throughput is extremely low since the measurement is often done individually for each compound, rather than in a parallel or array format; (3) Different and less reproducible results can be obtained dependent on the types of membrane filters used, since a loss of compound can occur through adsorption to the filter membrane.11, 12 Recently, miniaturized shake-flask solubility assays have been customized by applying the appropriate filtration techniques to improve throughput, and at the same time, to reduce sample consumption.11, 12 Overall, the thermodynamic solubility, determined from equilibrium with a stable solid form, is highly preferable for SPR study during lead optimization if the issues of throughput, sample requirement, and analytical sensitivity can be solved to allow diverse drug candidates with a broad range of solubility to be evaluated under different buffer conditions.
In this report, we have designed, developed, and implemented an automated solubility assay by means of centrifugal separation and HPLC-UV quantification, using a commercially available, database-integrated robotic liquid handling system. Requiring 1 mg of solid compound, this assay provides an experimental template in 96-well format to determine the equilibrium solubility of 24 compounds in the range of 1–200 μg/mL in three user-selected screening media.
Experimental
Compounds
For each Amgen compound screened for aqueous equilibrium solubility, 1 mg of solid was obtained from the corporate sample repository in a 4 mL glass vial with an open-top screw cap and a polytetrafluoroethylene (PTFE)-coated silicone rubber septum. A set of eight commercially available drugs (Sigma-Aldrich, Milwaukee, WI) with different solubility profiles was selected for assay development and validation: furosemide, hydrocortisone, indomethacin, ketoconazole, nitrofurantoin, phenylbutazone, piroxicam, and terfenadine.
Stock Solvents
Methanol (MeOH), HPLC grade, was purchased from Burdick&Jackson (Muskegon, MI). 1,2-Dimethoxyethane (DME), HPLC grade, was purchased from Sigma-Aldrich.
Solubility Media
Phosphate buffered saline (PBS), pH 7.4, was purchased from Invitrogen (Grand Island, NY). The following were prepared by Amgen Lab Services: 0.01 N HCl and fasted state simulated intestinal fluid (SIF), pH 6.8, containing 5 mM sodium taurochol, 1.5 mM lecithin, 2.9 mM KH2PO4, 0.22 M KCl.
Instrumentation
The Symyx Solubility System (Santa Clara, CA) used in this study consisted of a liquid handling robot and an Agilent 1100 HPLC. An experiment template was created for solubility measurement of 24 compounds in three aqueous media on a 96-well plate using Symyx's Library Studio. The liquid handling robot was programmed and executed by Symyx's Impressionist. The HPLC chromatograms were acquired and processed in 96-well library format using the Symyx's Epoch program. All experimental data were saved to an Oracle database for storage and query.
Sample Preparation
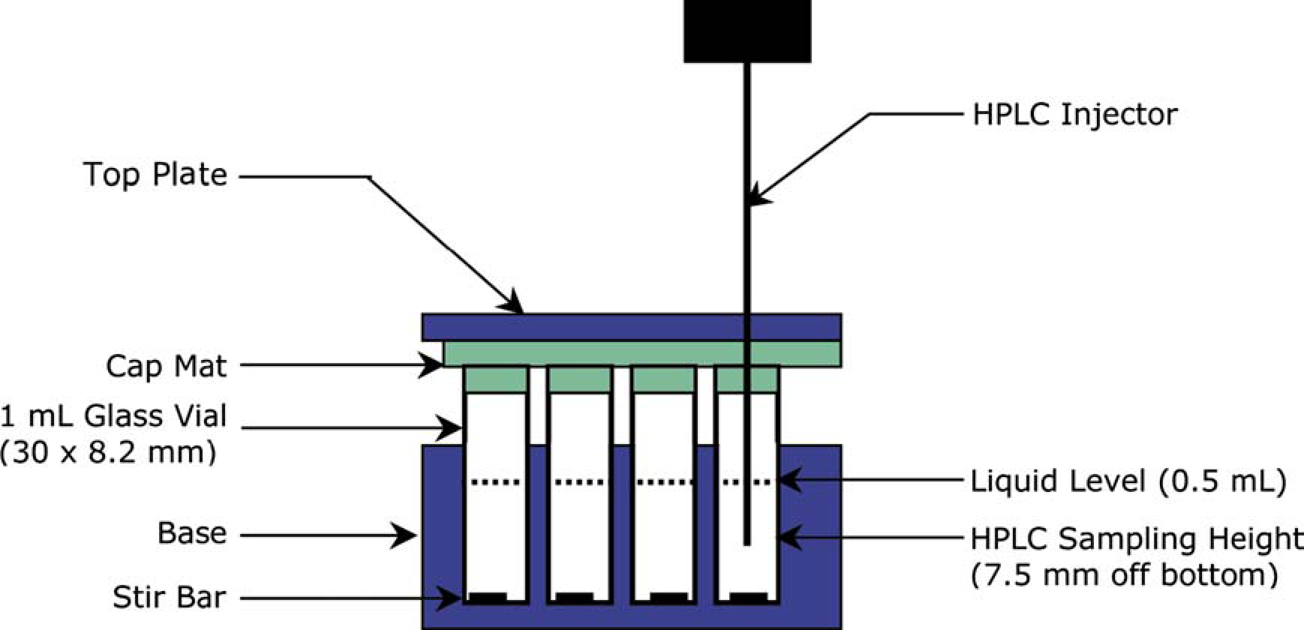
Assuming a screening criterion of 200 μg/mL solubility, the assay flowchart is outlined in Figure 1. A stock solution was first prepared for each of 24 compounds on a 24-well plate. A mixed solution of 50/50 MeOH/DME (v/v) was used as the stock solvent. The weight of the solid sample (i.e., 1 mg, to the nearest 0.01 mg) was directly imported, and the appropriate volume of the stock solvent was calculated and dispensed into the 4-mL vial for each compound by the liquid handing robot to obtain a stock concentration of 500 μg/mL. From each of the 24 compound stock solutions, volumes of 200 μL, 250 μL, 250 μL, and 250 μL were robotically transferred to an array of four 1-mL glass vials on a 96-well plate: one vial for the calibration standard and the other three vials for solubility samples. After evaporation of the stock solvent using a centrifugal evaporator, 500 μL of the solubility media, 0.01 N HCl, PBS, and SIF, respectively, were added to the corresponding sample vials on the 96-well plate for each compound to give a calculated concentration of 250 μg/mL. A stir bar was added to each vial using a 96-well stir bar dispenser, and the vials were sealed with a 96-well cap mat (Fig. 2). The samples were equilibrated by stirring at 100 rpm for 24 h and subsequently left standing, unstirred, for an additional 24–48 h at room temperature. After equilibration, 500 μL of 50/50MeOH/DME was added to the corresponding standard vials on the same plate for each compound to give a calibration concentration of 200 μg/mL. Immediately before solubility measurement by HPLC, the sealed 96-well plate was centrifuged at 1650 rpm for 10 min using a plate centrifuge to allow separation of the compound supernatant from undissolved solid.
The solubility assay flowchart. Cross-section view of sample vials in a 96-well plate, illustrated with the HPLC injector needle inserted for sampling.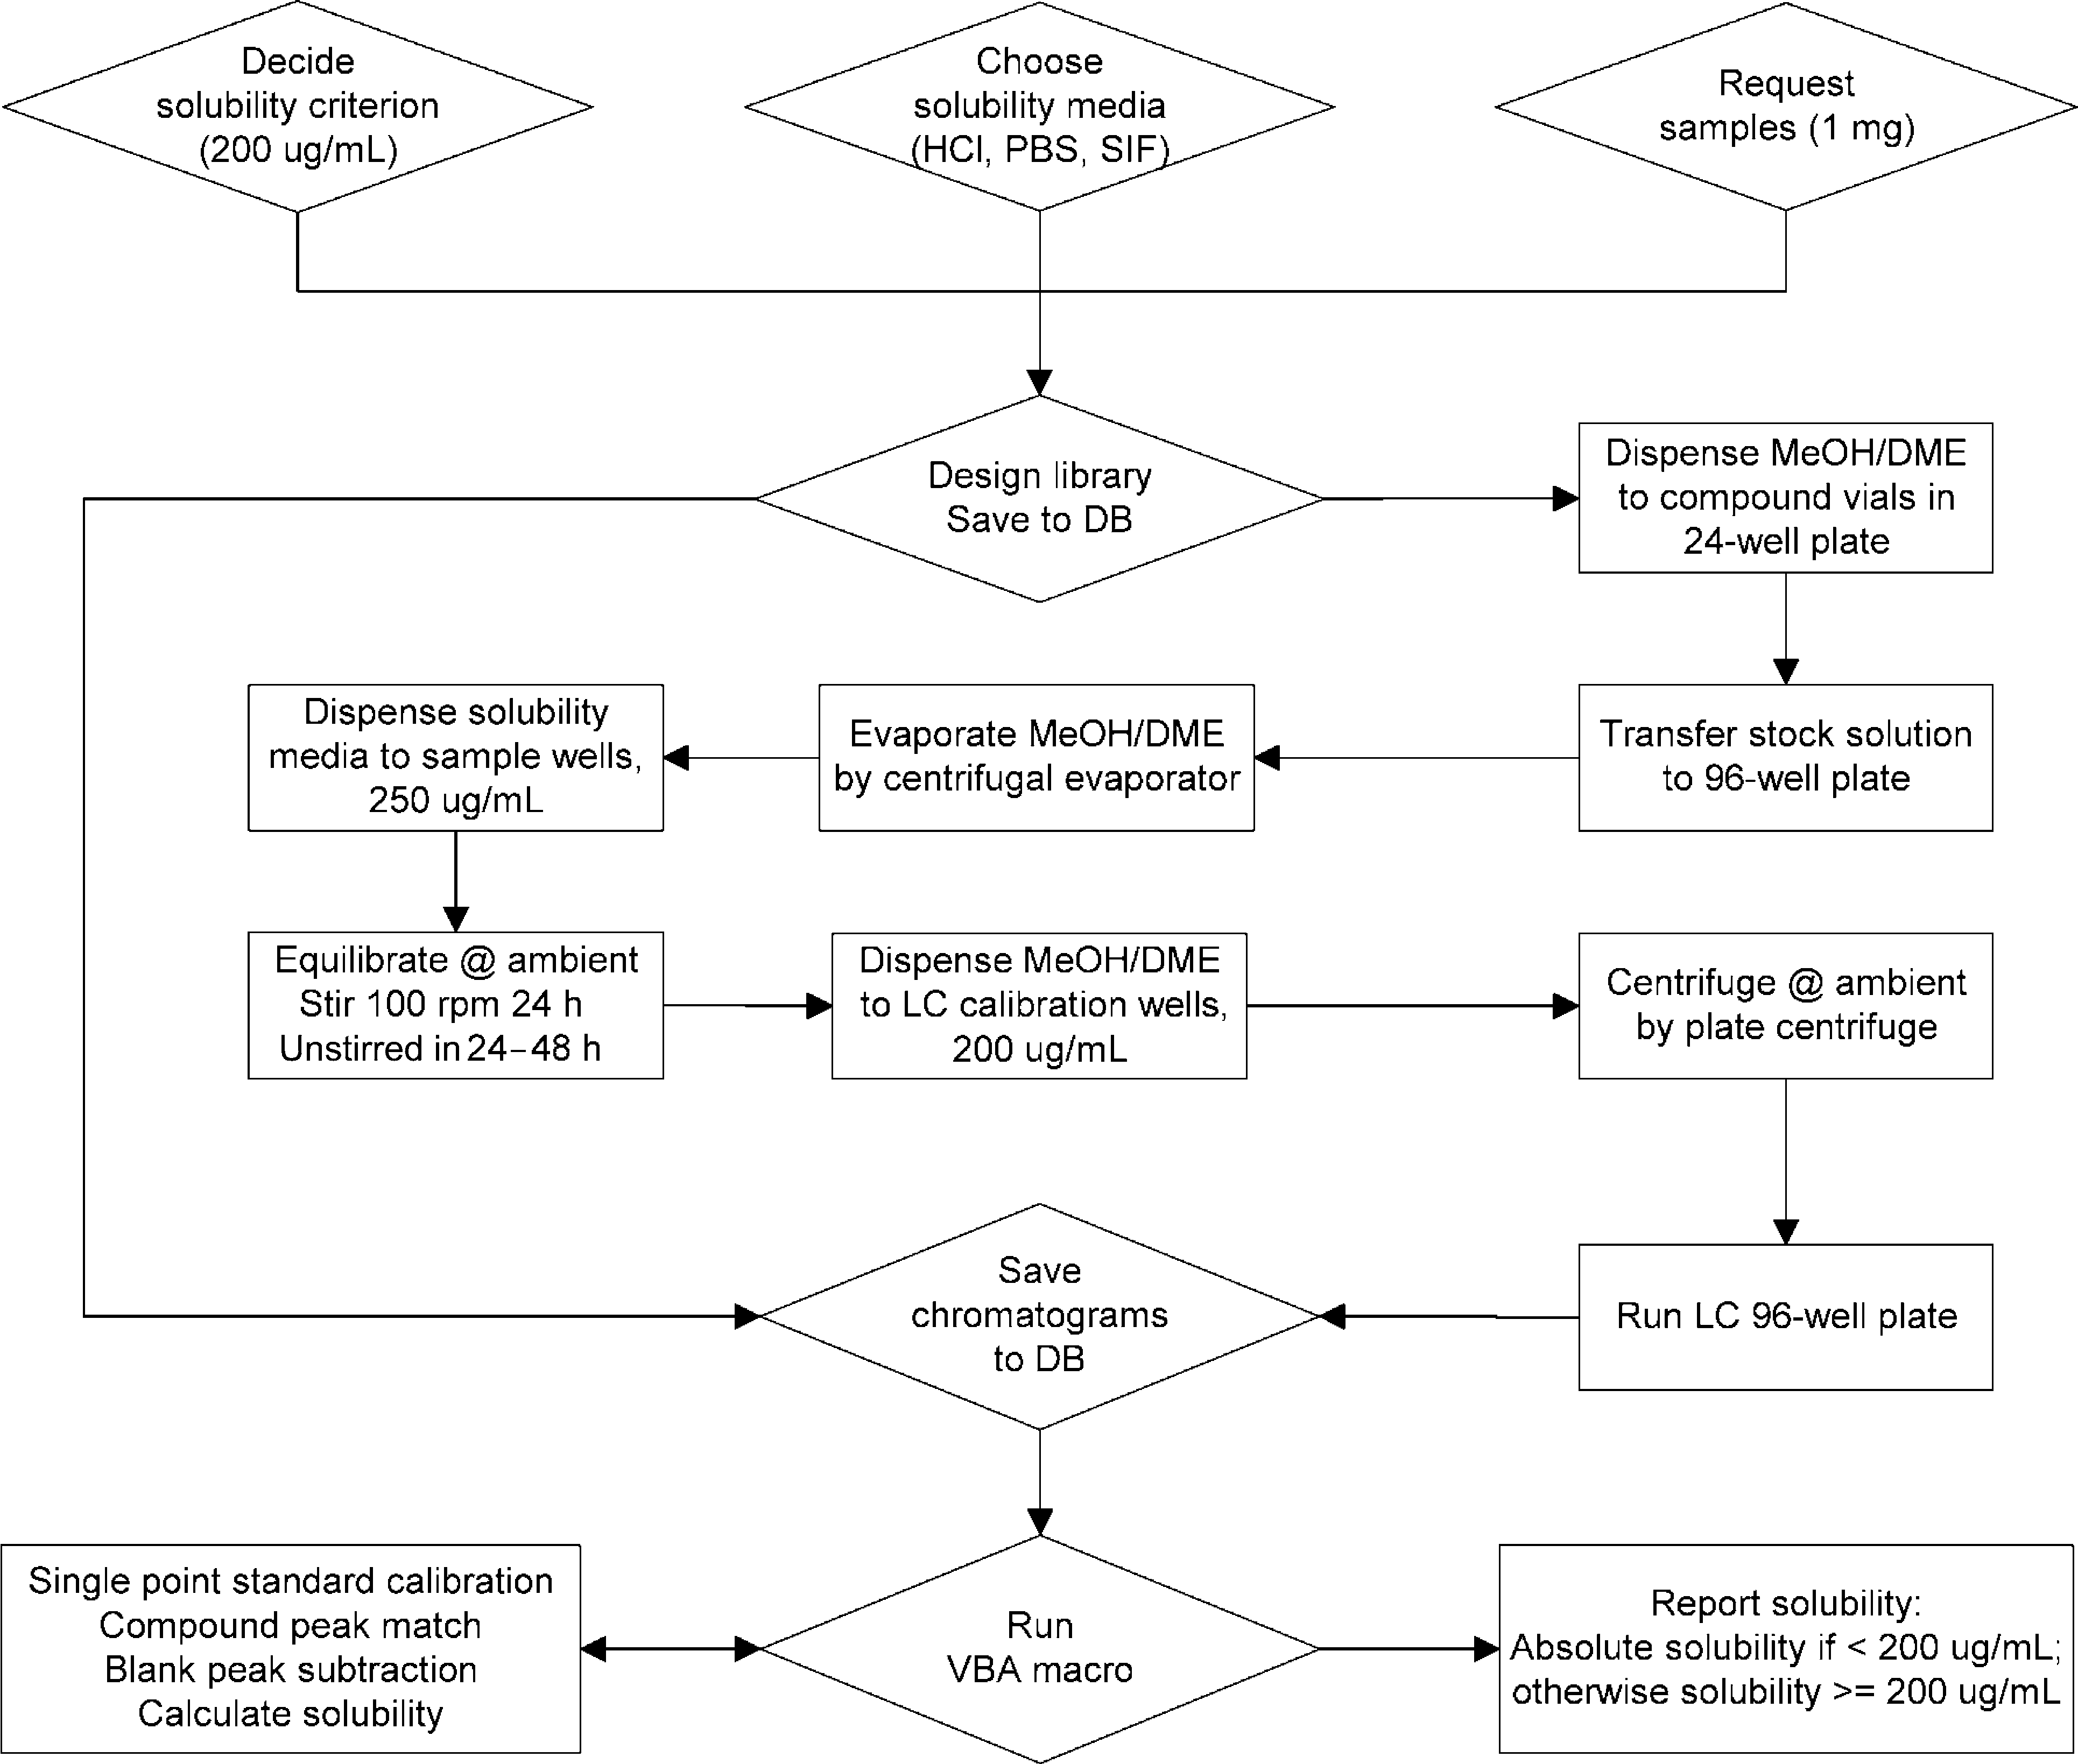
Data Collection and Reporting
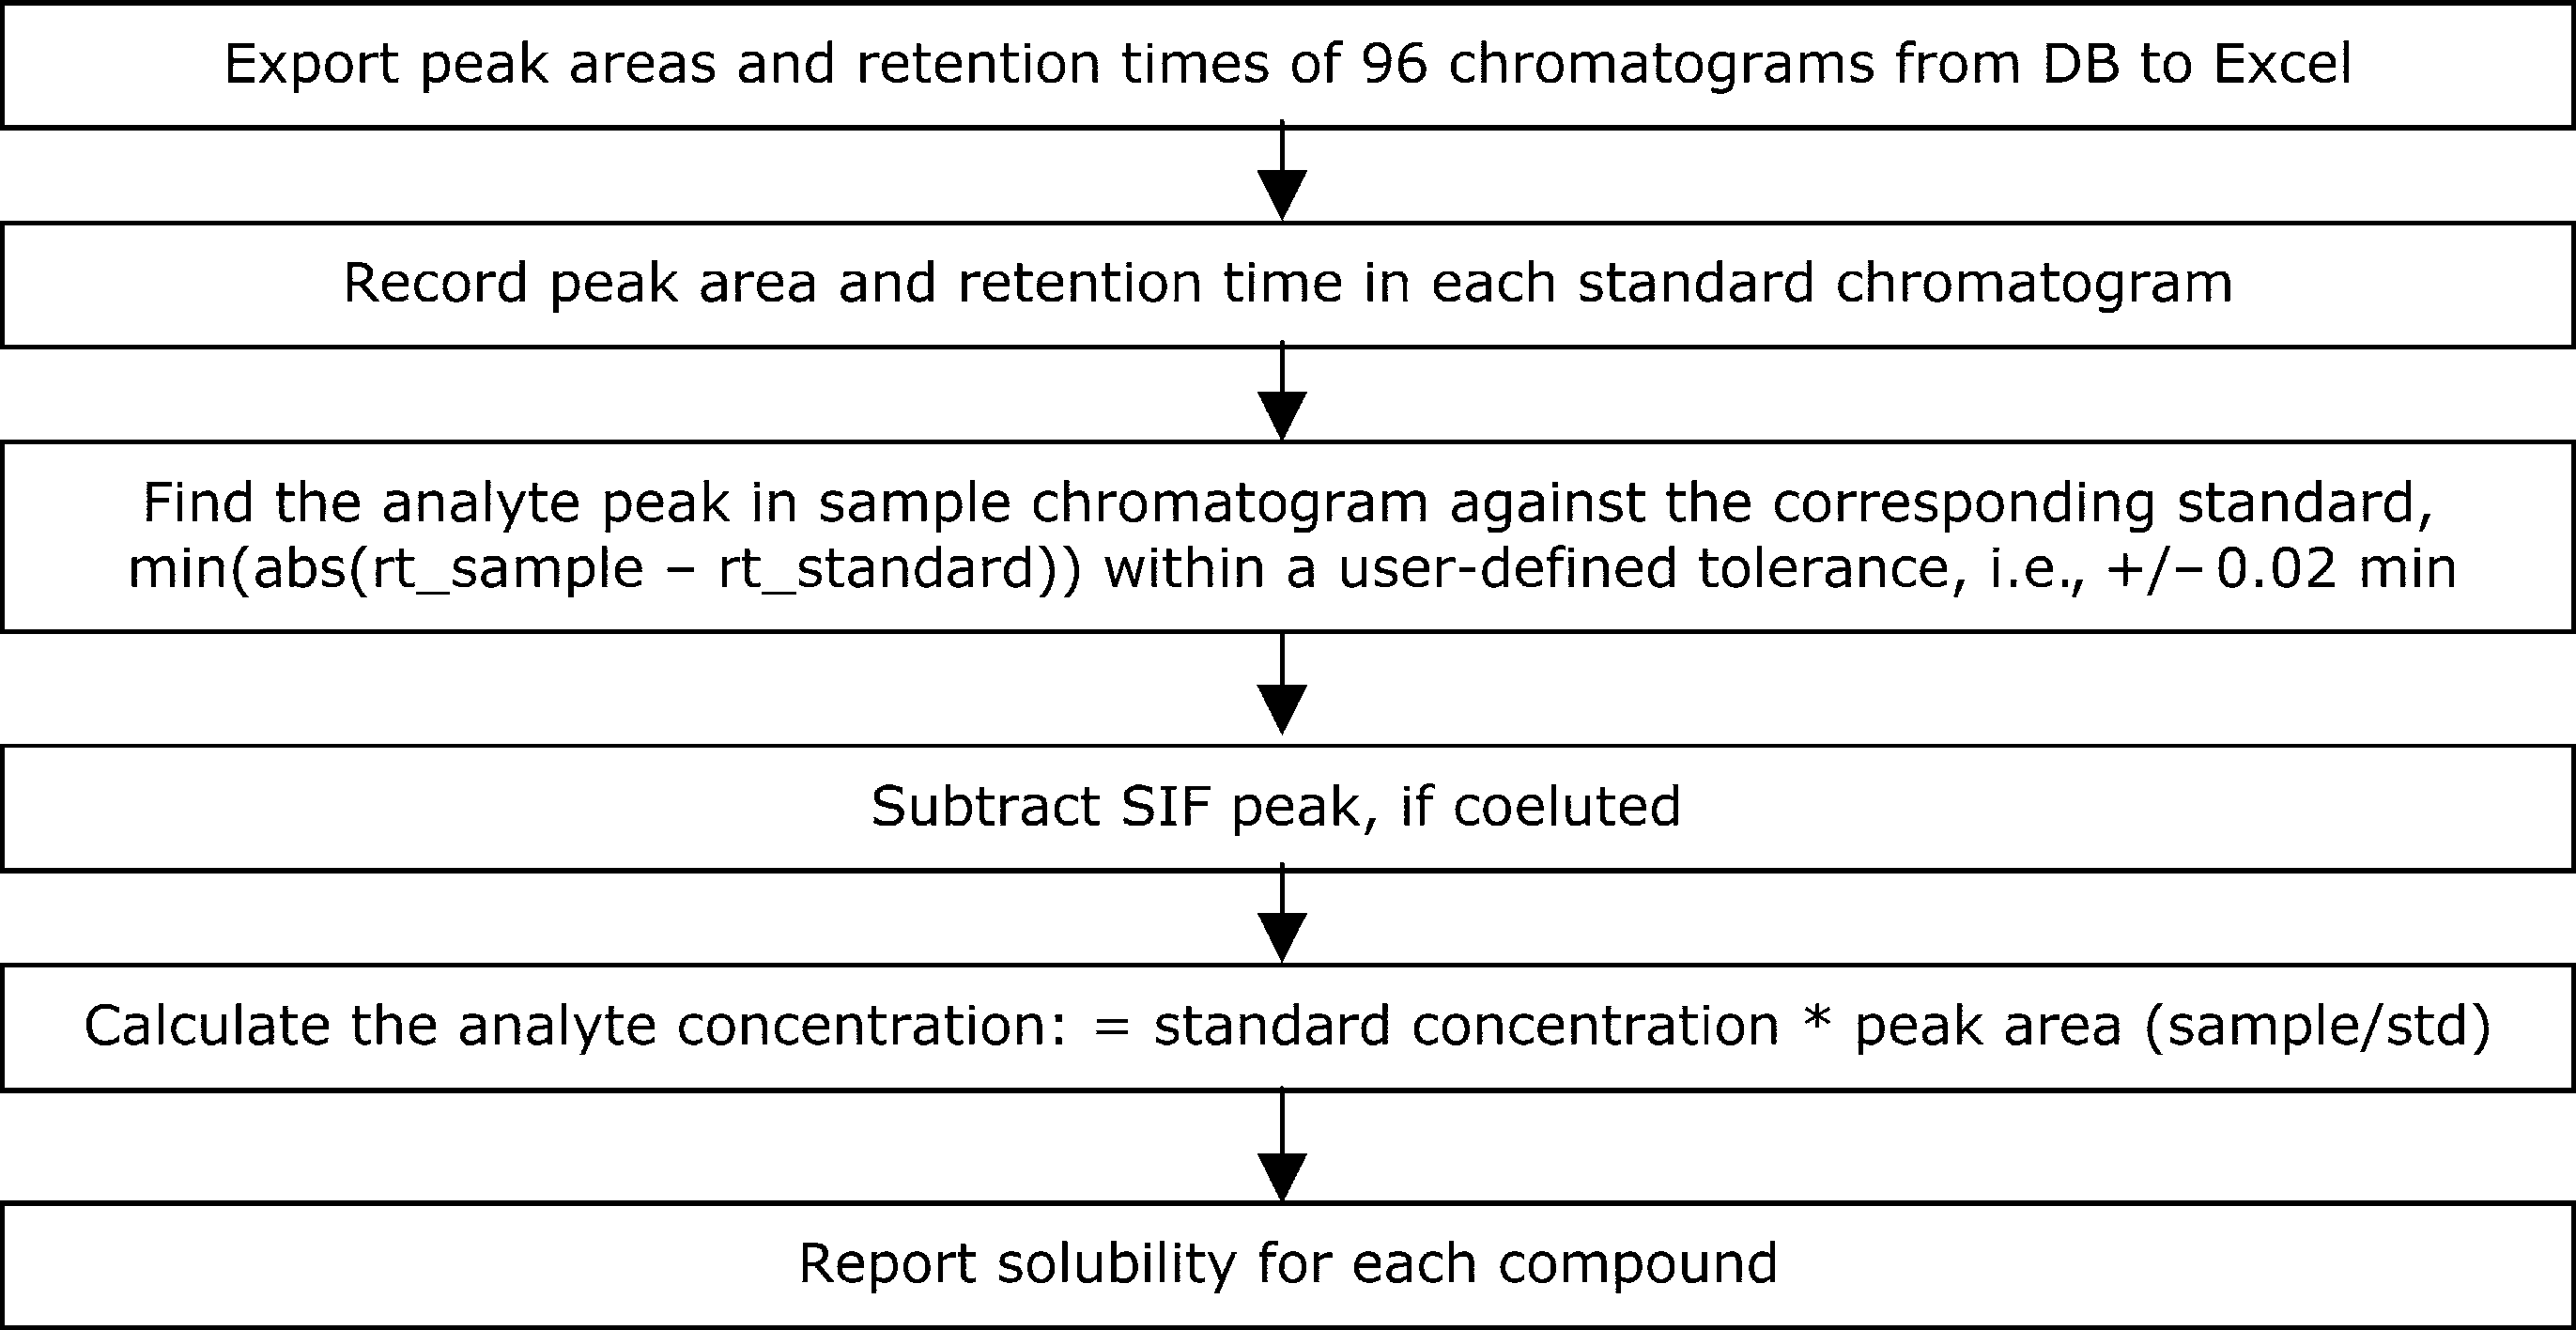
The solubility samples and the calibration standards in 1-mL vials on a 96-well plate were injected directly onto HPLC after centrifuging. As one of the HPLC method parameters, the HPLC injector draw position was controlled at the half-height of the solution level as shown in Figure 2, so that the injector needle was not in contact with the solid samples settled at the vial bottom. A fast gradient method was developed for HPLC throughput starting with 100% water containing 0.04% trifluoroacetic acid (TFA) and holding for 0.1 min, then ramping to 100% acetonitrile containing 0.04% TFA in 0.1 min and holding for 1.0 min. A Phenomenex Synergi Hydro-RP C-18 column (10 × 2.0 mm, 2 μ) was chosen for retention and resolution of both polar and nonpolar compounds. Typical elution times were from 0.7 to 1.2 min (Fig. 3). The injection volume was 2 μL, with a detection wavelength of 220 nm. For each compound, its solubility was quantified through individual standard peak area calibration at a concentration equal to the solubility-screening criterion, that is, 200 μg/mL. As illustrated in Figure 4, a reporting template using visual basic application (VBA) for Excel was customized to automate the data analysis of 96 chromatograms collected for standard calibration and solubility measurement of 24 compounds in three aqueous media.
Four overlaid chromatograms of a representative compound in calibration solvent (200 μg/mL), 0.01 N HCl, PBS, and SIF, respectively, showing an unknown peak as well as a blank peak from SIF. VBA programming for automated standard calibration and solubility quantification in a 96-well library format.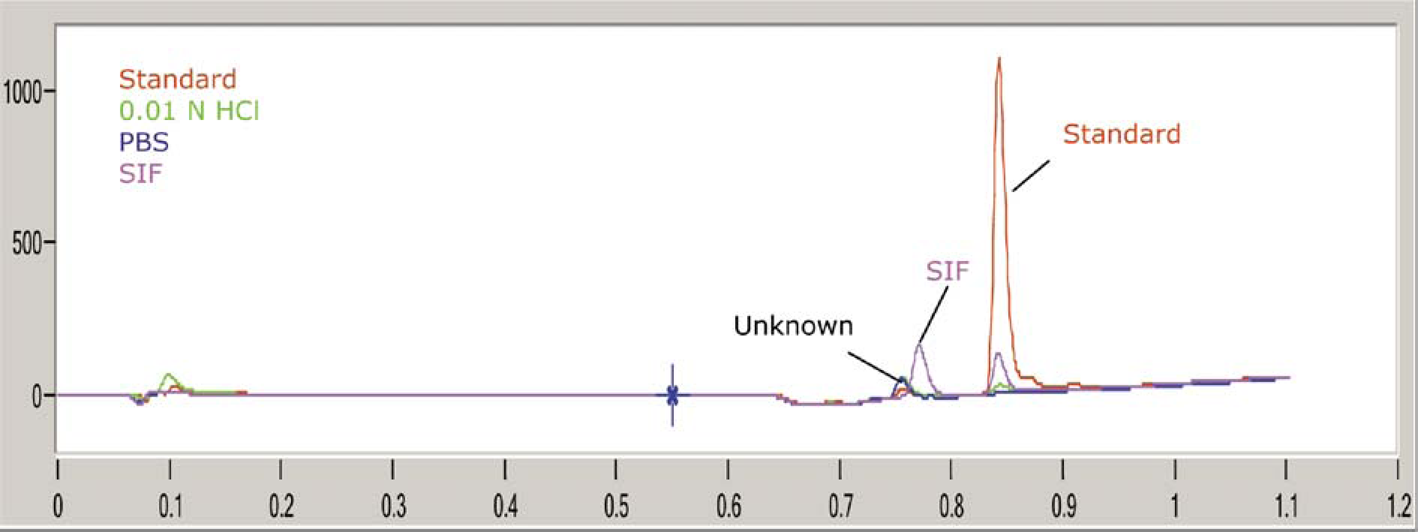
Shake-Flask Method
For solubility data comparison, the shake-flask method was performed manually for eight commercially available drugs in the media of 0.01 N HCl, PBS, and SIF, respectively. One mg of the compound was weighed into a 4-mL glass vial, and 4 mL of the medium was added to give a calculated concentration of 250 μg/mL. The samples were equilibrated by stirring at 100 rpm for 24 h and subsequently left standing, unstirred, for an additional 24 h at room temperature. At the end of equilibration, the entire sample volume was filtered manually through a 1 μm glass fiber syringe filter. The filtrate was subsequently analyzed by HPLC for solubility, with a reporting limit of 200 μg/mL.
Results and discussion
Solubility Medium and Screening Criterion
The aqueous medium of the human's gastrointestinal tract is more complex than any simple pH buffered medium. In humans, typical pH values in fasted stomachs are 1–2, while pH values in small intestines are 5–7. Because aqueous solubility of a compound often depends on pH of the solution, it is important to determine the compound solubility in parallel in several different pH buffers. Considering the relevance of the solubility medium for in vivo absorption, we chose 0.01 N HCl, PBS (pH 7.4), and fasted state SIF (pH 6.8) as the aqueous media in which the solubility of each compound was determined during SPR-based lead optimization. Based on the screening requirements, other buffered media can also be selected, that is, simulated gastric fluid. The interference from buffer components can be eliminated as the appropriate HPLC-UV method can be developed to separate the compound of interest for solubility quantification.
With a working volume of 500 μL, the solubility-screening criterion chosen dictates the amount of sample required by this assay. Based on the drug-likeness solubility ranking, we selected a screening criterion of 200 μg/mL for solubility of a lead compound in the neutral form, regardless of whether it is ionizable or non-ionizable. A compound with the aqueous solubility greater than 200 μg/mL at about pH 7 generally indicates a good oral drug candidate, even if its permeability is low. 13 To ensure that excess solid was present in equilibrium with a reporting solubility of 200 μg/mL, the actual sample amount added (i.e., 125 μg) was greater than the theoretical amount of 100 μg in 500-μL medium. On the other hand, a user-set maximum concentration reduced the risks of supersaturation or aggregation that otherwise might change the equilibrium, especially for low-solubility compounds. In total, 475 μg of compound was consumed for its standard calibration and solubility measurement, up to 200 μg/mL in three aqueous media. Given the fact that 1 mg of solid compound is usually requested and delivered, the solubility-screening criterion can also be extended to 400 μg/mL based on the user's discretion.
Equilibration Conditions
At the early stage of drug discovery, it is likely and acceptable that the synthesized compounds are amorphous. This is often due to the use of automated preparative HPLC followed by rapid precipitation or solvent evaporation as a final purification step in many modern chemistry labs, rather than the potentially more time-consuming method of crystallization. Although the traditional method is intended to determine the equilibrium solubility of the original solid form, we believe that it is more critical for SPR study to determine the equilibrium solubility of a compound representing a thermodynamically stable form under the defined equilibration conditions. The original solid form may change to a more stable form as a result of so-called “solution-mediated transformation” during the course of equilibration. 14 To take advantage of automated volume transfer, we chose a mixture of MeOH/DME as the stock solvent to prepare a stock solution of 500 μg/mL for each compound. MeOH/DME had characteristics of a clean HPLC-UV chromatogram and easy liquid handling. Furthermore, we found that 50/50 MEOH/DME (v/v) had better dissolution power than MeOH, or DME alone, to dissolve both polar and nonpolar compounds because of the so-called “cosolvent effect”.
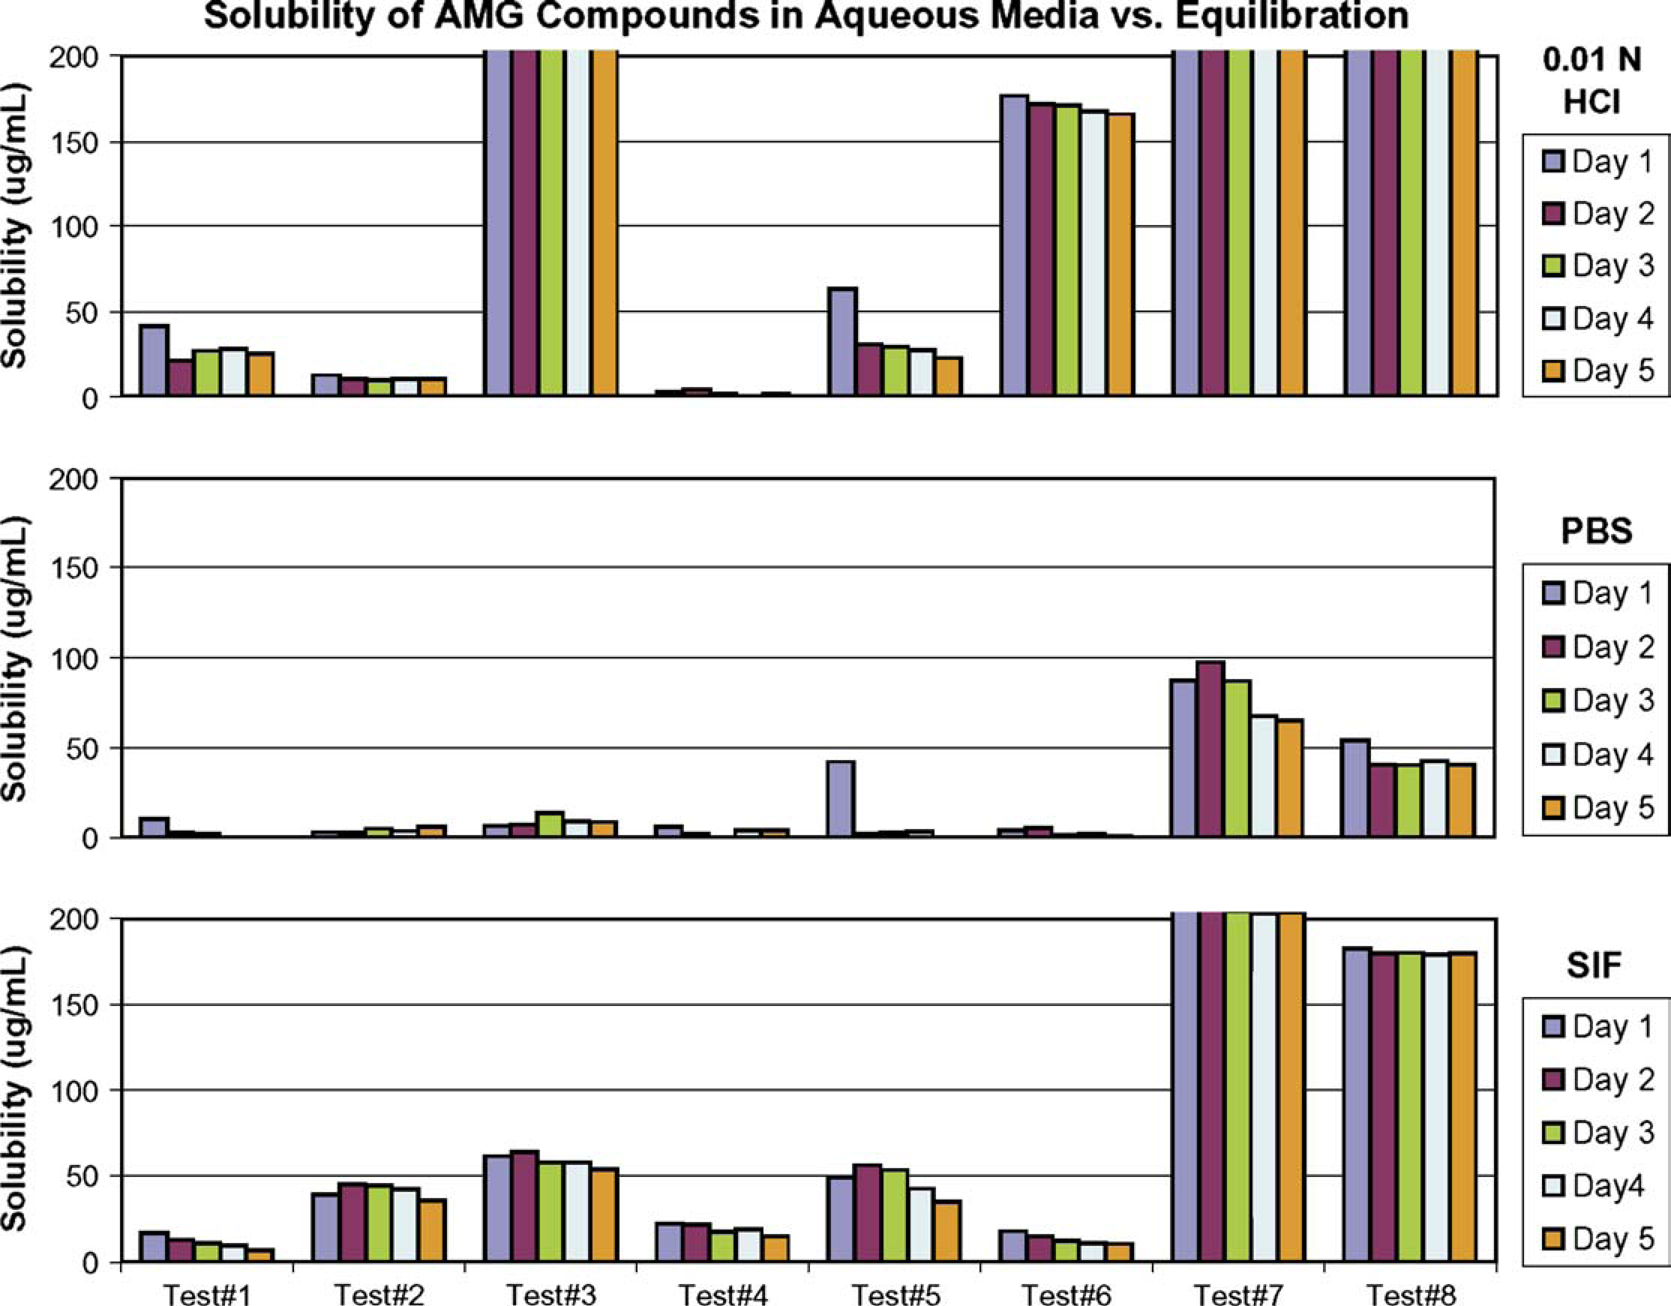
To investigate the effect of equilibration duration, the solubility samples on the 96-well plate were centrifuged, and the aliquots were injected directly onto HPLC after equilibration at ambient for 1, 2, 3, 4, and 5 days. As shown in Figure 5, the solubility of the marketed drugs tested was quite consistent throughout the 5 day equilibration course, except that higher values were observed for nitrofurantoin and phenylbutazone in 0.01 N HCl at the time point of 1 day equilibration, compared to those determined at the time points of 2-, 3-, 4-, and 5-day equilibration. The difference was more evident for some Amgen test compounds as shown in Figure 6, for example, the solubility of test compound 5 was 63 μg/mL in 0.01 N HCl, and 42 μg/mL in PBS at the end of the first day, whereas its average solubility in the subsequent 4 days was 28 μg/mL in 0.01 N HCl, and 2 μg/mL in PBS. This indicated that the amorphous form might be generated in the dried compound after rapid solvent removal by vacuum, and in that case, solution-mediated transformation prevailed to convert the metastable solid to a stable form during the course of equilibration. Furthermore, equilibrium could take longer for low-solubility compounds. By knowing the cause and the trend of observed solubility changes with equilibration time related to this assay at a scale of 500 μL, with a solubility-screening criterion of 200 μg/mL, we believe that 48 to 72 h of equilibration should be adequate to allow a thermodynamically stable form to be produced and its equilibrium solubility to be determined. More specifically, the solubility samples were stirred at 100 rpm for 24 h, and subsequently left still for an additional 24 to 48 h before separation by centrifuging for solubility measurement.
The effect of equilibration duration on solubility of marketed drugs, showing the solubility in 0.01 N HCl, PBS, and SIF, respectively, measured after 1-, 2-, 3-, 4-, and 5-day equilibration at 27 °C. The effect of equilibration duration on solubility of Amgen (AMG) test compounds, showing the solubility in 0.01 N HCl, PBS, and SIF, respectively, measured after 1-, 2-, 3-, 4-, and 5-day equilibration at 27 °C.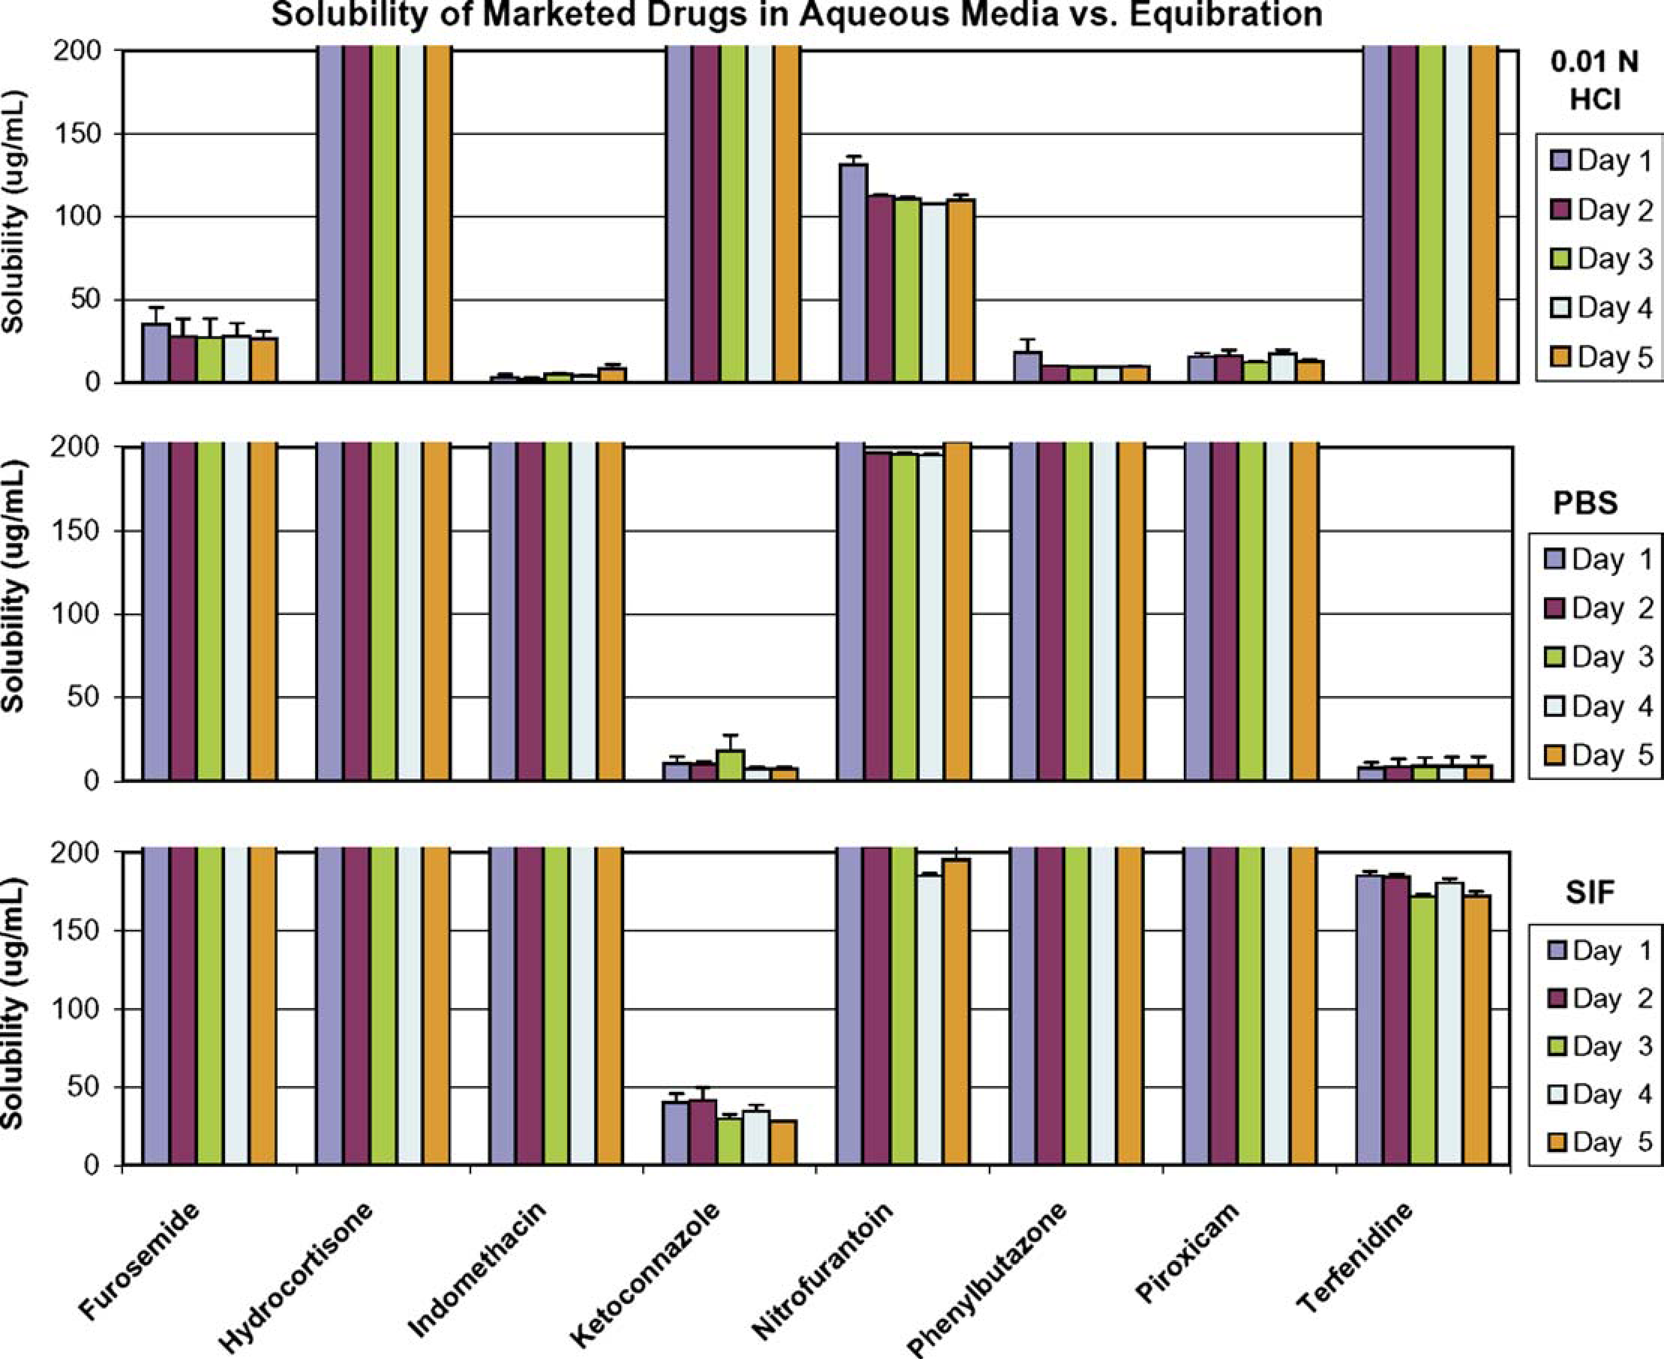
Separation Technique
For measurement of the equilibrium solubility, a physical separation step has to be carefully chosen so that the true equilibrium solubility can be determined from a saturated compound solution. Traditionally, a sample aliquot is filtered and the compound concentration in the filtrate is then quantified as the solubility. Not only is the filtration step labor-intensive and tedious, it has been a known issue that drug loss can occur through membrane absorption during filtration in the shake-flask methods.11, 12 The plate centrifuge technique has been widely used in HTS assays, which can be attributed to its accessibility and easy use. However, this is the first time for a solubility-screening assay to separate the supernatant by centrifugation for direct solubility measurement. Given the scale of 125 μg compound in 500 μL medium, high-speed centrifugation of the 96-well solubility samples in 1-mL glass vials provided an adequate and efficient mean to settle undissolved solid. After centrifuging, the solubility samples on the 96-well plate were analyzed by HPLC, with a user-adjustable sampling-height well above the vial bottom relative to the total volume, so that the supernatant was sampled for accurate solubility measurement.
HPLC Calibration and Quantification
Typically, the HTS solubility assays employing nephelometry detection or UV plate scanning are not sensitive to purity, identity, and stability of the compound of interest in the solubility matrix, whereas HPLC-UV in the conventional shake-flask methods is. However, HPLC-UV is usually a very time-consuming technique for method development, calibration, and solubility quantification of individual drug candidates. We have developed a HPLC method with a run time of 1.2 min to meet the throughput requirement, while achieving sufficient peak resolution for solubility quantification of individual compounds with diverse structures. HPLC calibration was conducted in the same plate run as the solubility samples, using 50/50 MeOH/DME (v/v) as the calibration solvent. Four chromatograms of a representative compound in calibration solvent, 0.01 N HCl, PBS, and SIF, respectively, are overlaid in Figure 3. One SIF peak eluted at 0.78 min with a fixed area count under the HPLC conditions, thus blank subtraction of SIF chromatogram became necessary using VBA macros for offline data analysis. As shown in Figure 3, impurity or unknown peaks were often detected after compound equilibration in aqueous media. Based on the individual standard peak calibration, this fast HPLC-UV method has been used for solubility measurement of diverse Amgen research compounds. The detection limit was found to be approximately 1 μg/mL of solubility under the assay conditions.
Table 1 compares the solubility data of eight marketed drugs, determined by 1-point calibration with those by 4-point calibration from the same HPLC run of a 96-well plate after 48 h equilibration in 0.01 N HCl, PBS, and SIF. The single-point calibration concentration was 400 μg/mL for each compound, whereas the 4-point calibration concentrations were 400, 80.0, 16.0, and 3.2 μg/mL, generated through serial dilution using the liquid handling robot. The 4-point calibration curve is linear for each compound, with its regression coefficient (r 2 ) equal to or better than 0.997. Comparing the calibration equation, Concentration = a* Area + b, the a value in 1-point calibration is in agreement with that in 4-point calibration. In contrast, the 4-point calibration equation possesses a positive b value, and the b value becomes relatively larger for a compound with a weaker UV chromophore, that is, hydrocortisone and nitrofurantoin. In fact, the b value is the concentration compensation for the robotic dilution error. We found that the liquid handling robot carried a system error up to 2%, and tended to transfer slightly less volume of the calibration solvent, 50/50 MeOH/DME, than the desired transfer volume. Furthermore, the system error was amplified through serial dilution, that is, 5x, 25x, 125x, for preparation of the standard concentrations. As shown in Table 1, the solubility values determined by 1-point calibration were comparable to those by 4-point calibration. However, without the concentration compensation (the b value), single-point calibration could render a lower solubility that might have a larger impact on a poorly soluble compound with a weak chromophore. By understanding the potential error sources, we decided to use single-point calibration with a standard concentration equal to the solubility-screening criterion, that is, 200 μg/mL. Fixed volumes were transferred for calibration standard and solubility samples followed by direct measurement without serial dilution, with the intent to cancel out the volume error delivered by the liquid handling robot. Most importantly for throughput, solubility of 24 compounds in three aqueous media can be determined in one HPLC run, together with single-point calibration of each compound on the same 96-well plate.
Comparison of 1-point calibration vs. 4-point calibration done on the same plate
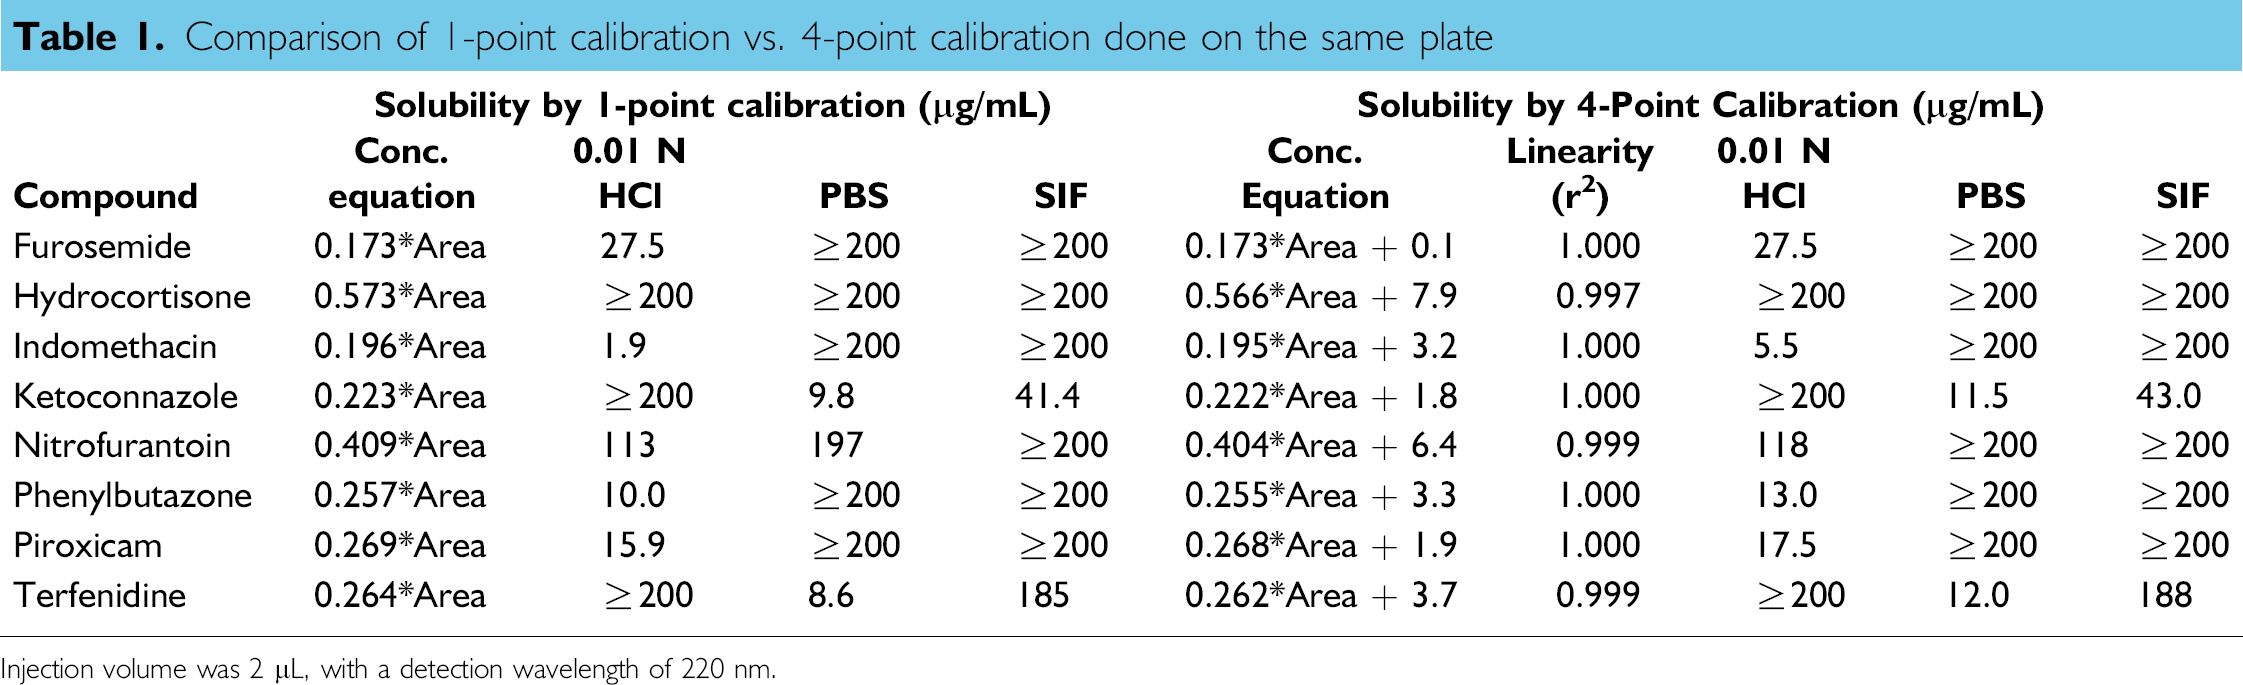
Injection volume was 2 μL, with a detection wavelength of 220 nm.
Assay Validation
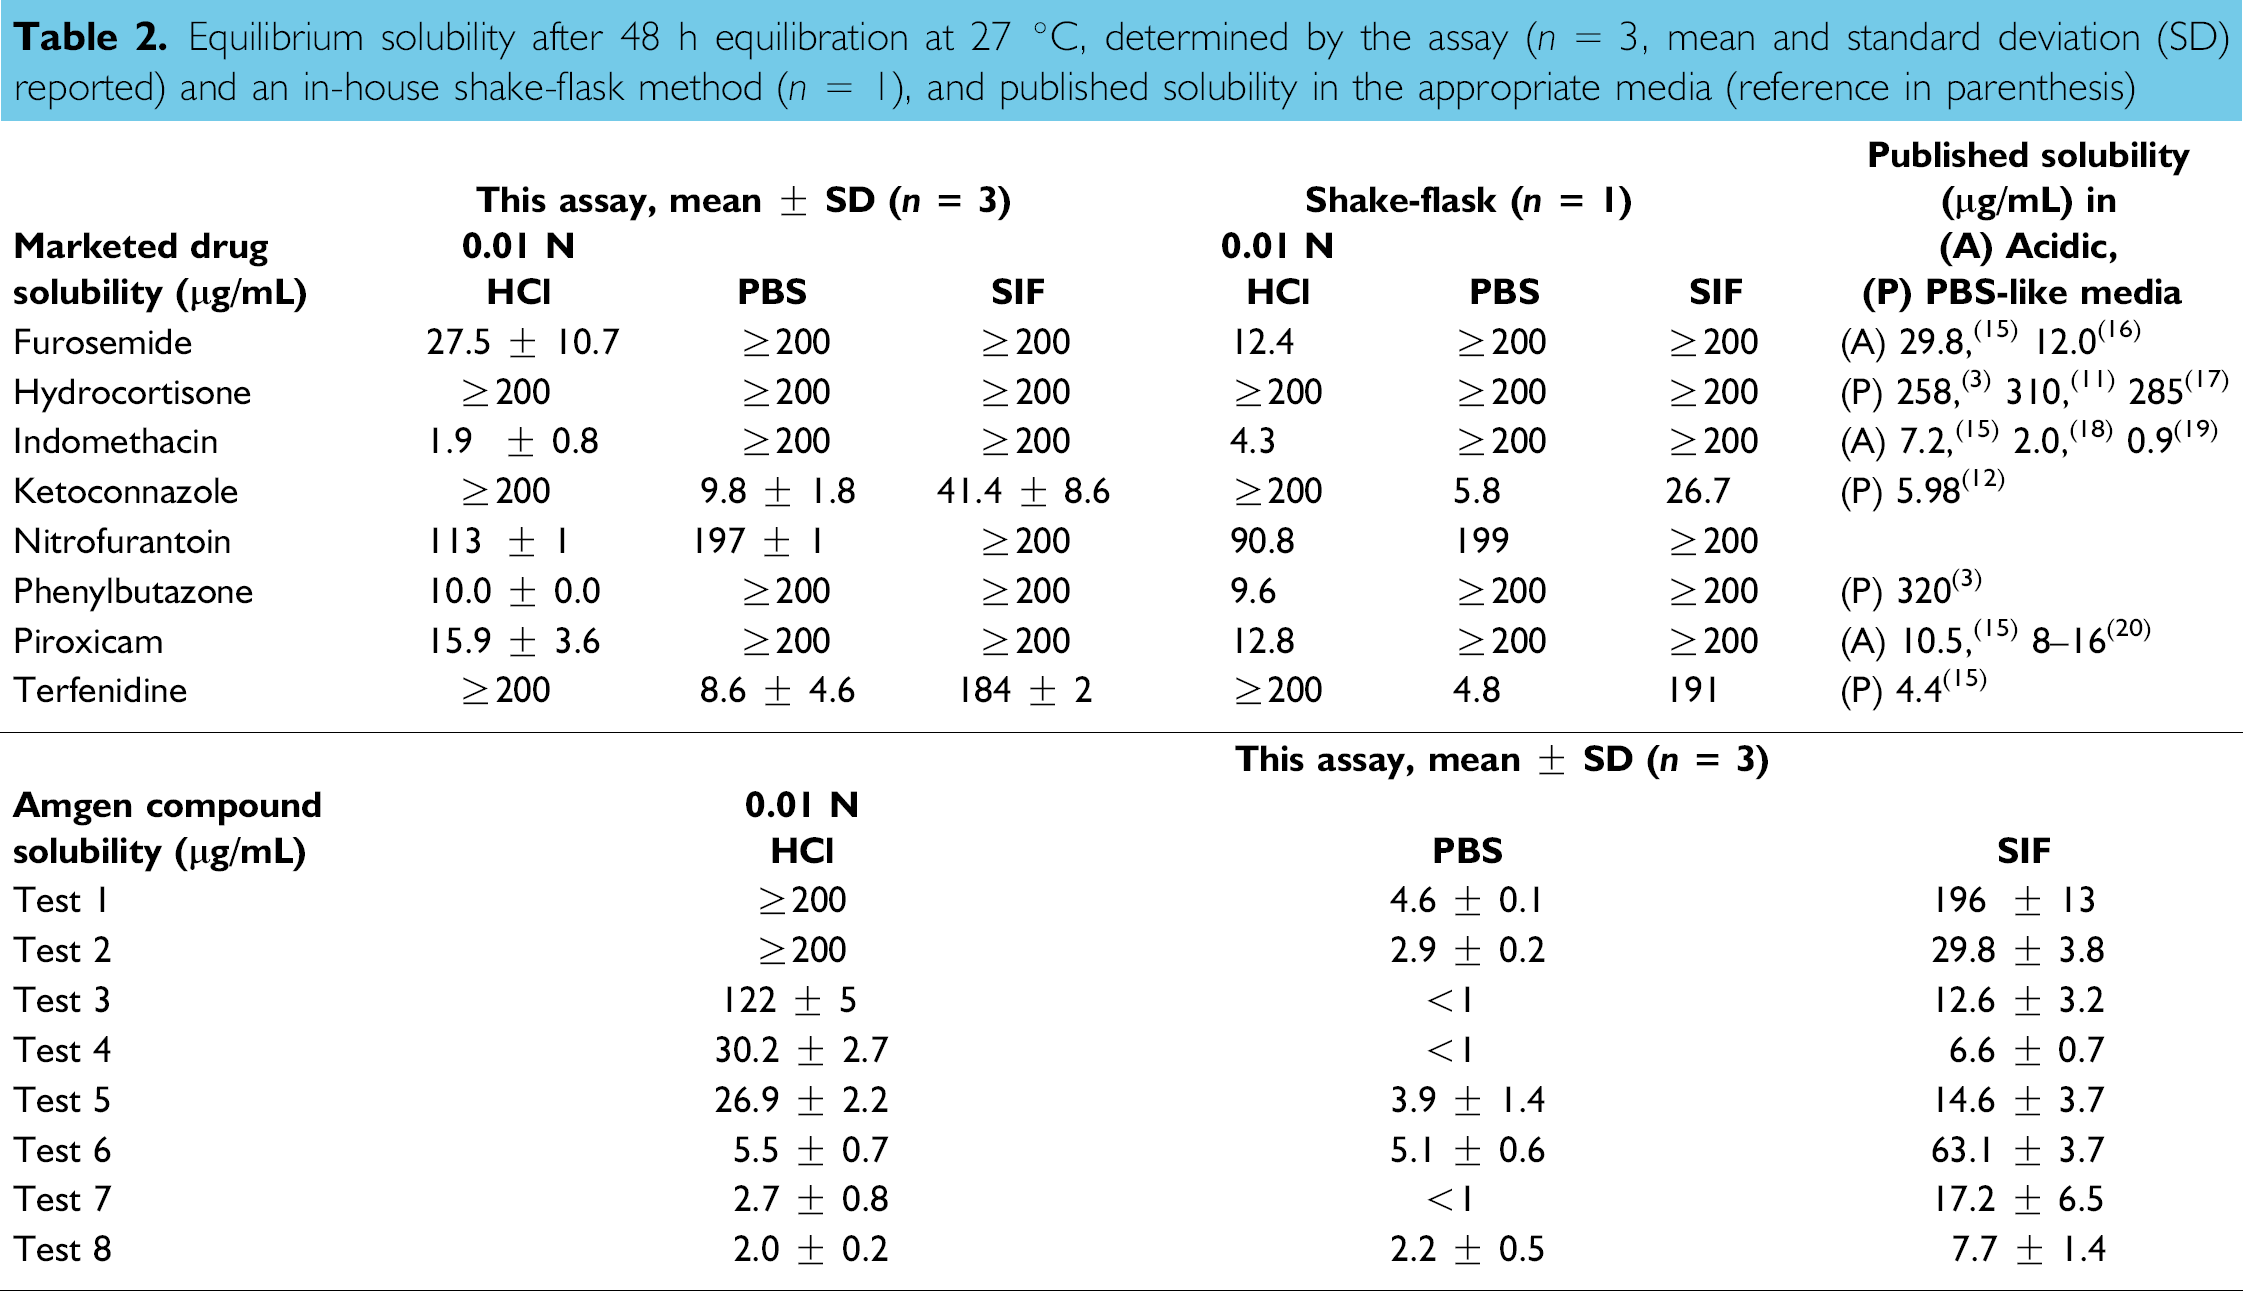
To evaluate the assay reproducibility, triplicate solubility experiments were performed, and the mean value of solubility and its standard deviation were determined for the marketed drugs and Amgen test compounds as shown in Table 2. The relative standard deviation of this assay was found to be less than 10% when the reported solubility was higher than 50 μg/mL. For the compounds with solubility less than 50 μg/mL, the relative standard deviation could be as high as 50%, largely due to autointegration error caused by the small analyte peak in gradient elution HPLC and partially due to solubility fluctuations under the equilibrium conditions. For the purpose of assay accuracy validation, solubility values of eight marketed drugs were also determined using an in-house shake-flask method. Solubility in the acidic or PBS-like media has been reported in the literature; however, limited public data is available for solubility in SIF. As can be seen in Table 2, the equilibrium solubility determined by this assay was comparable to the shake-flask value as well as the published data in the corresponding media, therefore the assay was considered equivalent to the shake-flask methods.
Equilibrium solubility after 48 h equilibration at 27 °C, determined by the assay (n = 3, mean and standard deviation (SD) reported) and an in-house shake-flask method (n = 1), and published solubility in the appropriate media (reference in parenthesis)
Throughput
Typically, 24 compounds can be assayed on one 96-well plate for HPLC calibration and solubility measurement in three aqueous media. Another option for throughput enhancement is to determine solubility of 96 compounds in one medium, that is, PBS, using the same well as HPLC standard calibration followed by evaporation and reconstitution in the aqueous medium. Often the liquid handling robot can be programmed to handle multiple plates sequentially. Two 96-well plates can be loaded onto one HPLC, and the resulting 192 chromatograms can be collected in one run with a fast gradient elution. The experiment design and chromatographic data were stored to a database. Throughout the assay, the user labor time was minimized. The customized VBA reporting template allowed a user to analyze the 96-well chromatograms and to obtain the solubility results in seconds. In terms of throughput, 192 compounds in three media, or eight 96-well plates, can be done weekly. Using this assay, we have recently determined the equilibrium solubility for more than 1000 Amgen compounds, in various aqueous media, to evaluate the critical physicochemical properties of discovery drug candidates.
Structure Property Relationship (SPR) Study
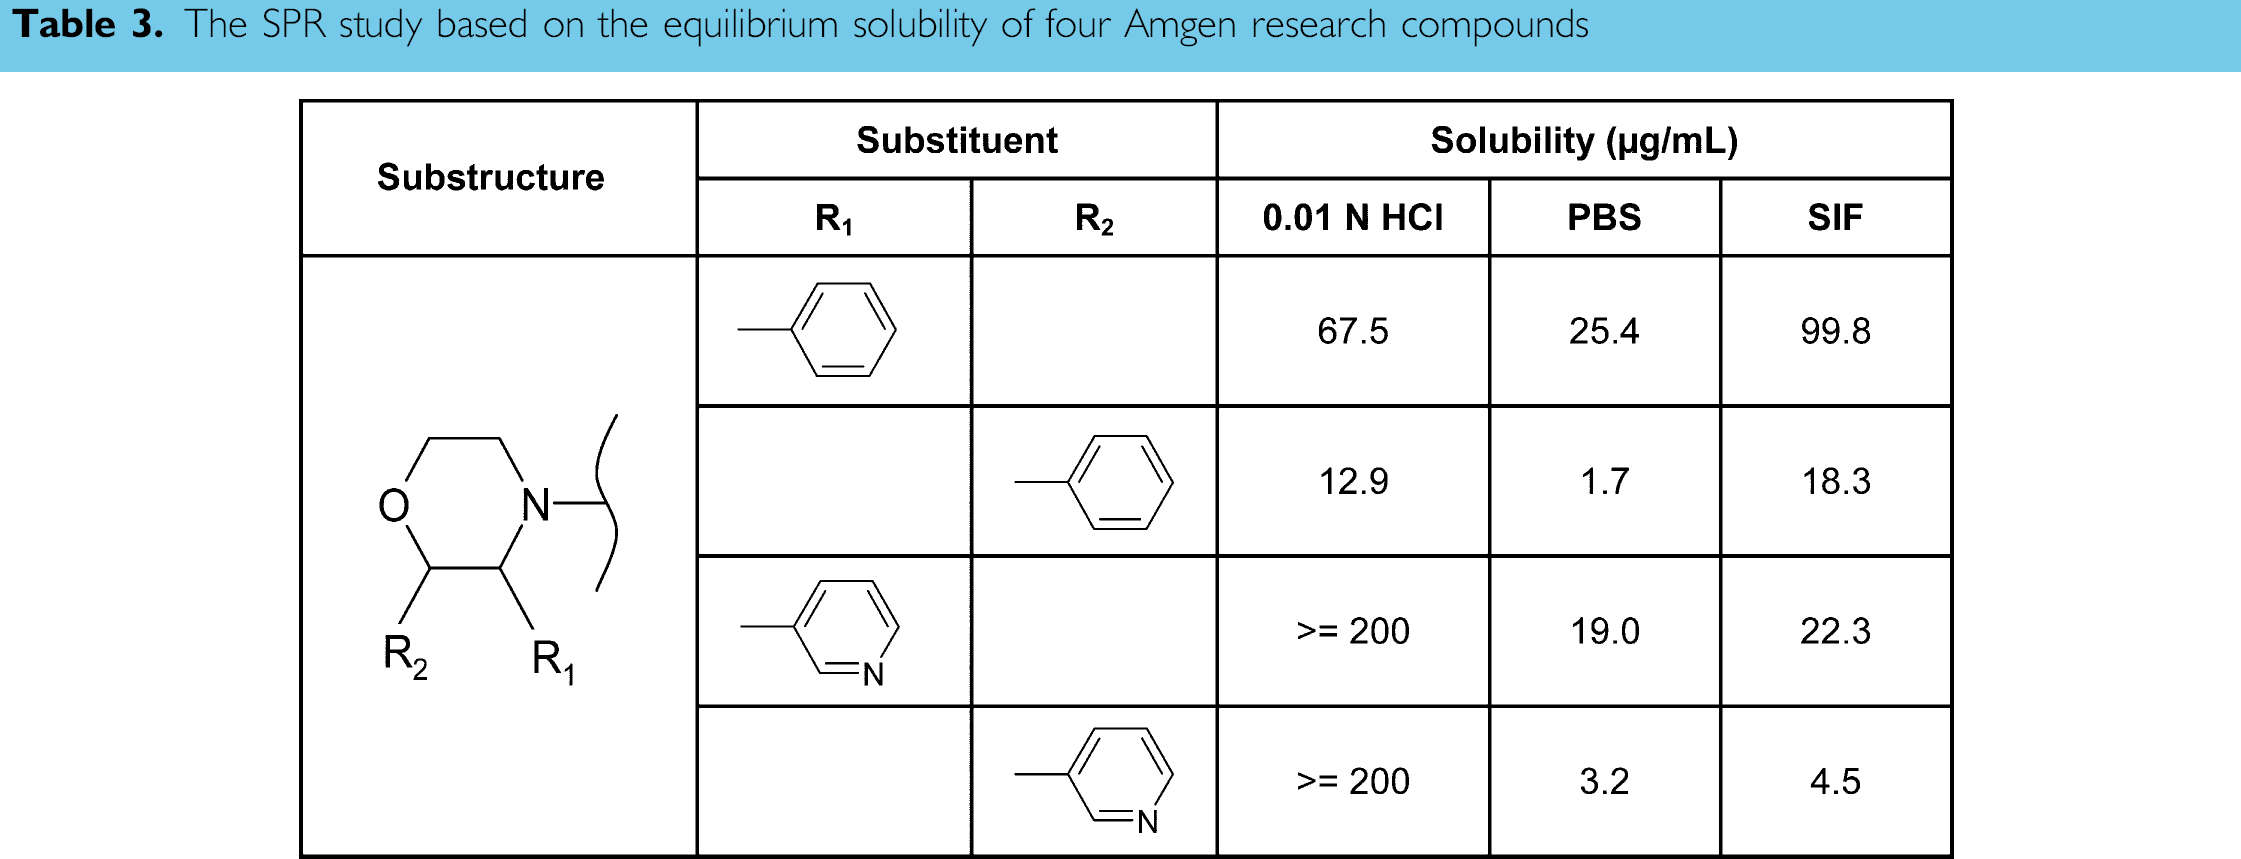
The ultimate goal of this assay was to allow us to correlate the equilibrium solubility to compound structures, and to interpret further the pharmacokinetic activities during lead optimization. As examples of the SPR study, Table 3 lists the aqueous solubility of four Amgen research compounds possessing the morpholine substructure. Both the phenyl and the pyridine substituents at the R1 position increased the solubility more than fivefold, compared to those same substituents at the R2 position, unless the upper limit of 200 μg/mL was reached for the ionizable pyridine moiety in 0.01 N HCl. Furthermore, although the phenyl or pyridine substituent at the same position seemed to give equivalent solubility in PBS, the phenyl ring enhanced the solubility as much as five times in SIF, whereas the pyridine group had little effect. The effect of SIF composition is apparent but quite complex. Without knowing SPR, it is difficult to predict correctly the drug solubility property in biological related media. These data clearly indicate that the equilibrium solubility measured is related to both the substituent position and its electronegativity. The structural modification influences the molecular behaviors of hydrogen bonding and ionization, and in turn, alters the dipole-dipole interaction between compound and the surrounding water molecules. From the examples, it is demonstrated that the thermodynamic solubility measurement enables the SPR study, which is critical to efficient drug lead optimization.
The SPR study based on the equilibrium solubility of four Amgen research compounds
Conclusion
An automated equilibrium solubility assay in a 96-well library format has been designed and developed by means of robotic liquid handling, centrifugal separation, and HPLC-UV quantification. Requiring 1 mg of solid compound, this assay was used to determine the equilibrium solubility in three user-selected media: 0.01 N HCl, PBS, and SIF. The database-integrated workflow facilitated the experiment design and the solubility measurement of 24 compounds in a single run, with a throughput of up to 192 compounds a week. The reporting solubility range was 1–200 μg/mL, which was considered appropriate for oral drug candidate selection at the stage-of-discovery lead optimization.
The assay parameters were optimized using Amgen research compounds and commercially available drugs. The equilibration time of 48–72 h was chosen to ensure that the thermodynamic solubility was measured in equilibrium with a stable solid form present. Centrifuging the solubility samples in a 96-well plate, followed by direct HPLC sampling at a user-controlled height, was found to be an efficient and reliable separation technique. A fast gradient HPLC method was developed with single-point on-plate calibration at a concentration equal to the solubility-screening criterion of 200 μg/mL for each compound. The HPLC method was suitable for solubility assessment of diverse discovery compounds based on the individual standard peak calibration. A customized VBA program was created to automate the 96-well chromatographic data analysis for solubility reporting. The assay was validated and considered equivalent to the conventional shake-flask methods. The assay's reproducibility was <10% relative standard deviation (RSD), for solubility >50 μg/mL, and up to 50% RSD for solubility <50 μg/mL. The thermodynamic solubility determined by this assay was demonstrated to enable the SPR study during drug lead optimization.
Footnotes
Acknowledgement
The authors would like to thank the Amgen coworkers Liz Doherty, Mark Norman, Queenie Wang, Hui-Ling Wang, Nuria Tamayo, Roland Burli, Chris Fotsch, Dawei Zhang, Steve Notari, Samer Chmait, Annette Bak, and Sesha Neervannan for their valuable suggestions and support during assay development and implementation.