
Abstract
Protein stability is a standard metric to study the relationship between protein sequence and stability. Here we show that laboratory automation can be used to increase both the precision and the throughput of stability measurements. A laboratory automation workstation was used to purify his-tagged eglin c proteins in 96-well format and to prepare protein solutions for solvent denaturation on a semiautomated titrating fluorometer. Using this setup, we have attained a throughput of about 20 stability measurements per day. The robotics facilitate precise stability measurements in which the standard deviation of values from multiple protein preparations (±0.05 kcal/mol) differs little from multiple measurements from a single preparation (±0.04 kcal/mol), while the measurement errors in the literature ranges from 0.10-0.60 kcal/mol. Our approach can be applied to evaluate the consequences of mutation in any fast-folding protein. Large numbers of high-precision stability values derived from mutation are useful for parameterizing models about protein stability determinants and testing models for predicting protein stability and structure based on protein sequence information.
Introduction
The relationship between amino acid sequence and protein stability and structure has been the subject of many studies over the past 50 years and continues to fascinate present-day scientists. While we have come to some understanding of the forces that determine protein stability, a quantitative, predictive, and physicochemical explanation is still elusive. One general approach to probe the role of a residue of interest in a protein is to mutate the amino acid using site-directed mutagenesis 1 and then to assess the effect of the amino acid change on stability.
While site-directed mutagenesis is a powerful tool for testing hypotheses about protein stability determinants, the complexity of the interactions of single residues in proteins and the high frequency of thermodynamic coupling means that an experimentally obtained stability value for a given amino acid change may not be derived solely from the energy effect of interest. This complexity implies that characterizing a few tens of mutants is, at root, anecdotal. One way to extend this approach is to use statistical modeling 2 with stability data from large numbers of mutants to decompose the stability change into component parts. Advantages of using statistical modeling to parameterize models with the data from large numbers of mutants over the anecdotal approach are: (1) Statistical modeling provides a quantitative estimate of the fraction of behavior accounted for by the hypotheses/models tested; (2) It accurately parameterizes the descriptors even in models where important effects are missing from that model, provided that the descriptors are independent of the missing effects; 2 (3) It can accurately parameterize descriptors even when the observable is only weakly related to the hypothesis and there is considerable measurement error in the data 3 . However, the cost of using this approach is a need to acquire stability data from numbers of mutant proteins which exceed that of traditional studies by several orders of magnitude. The actual number of protein mutants that need to be characterized to achieve both significance and robustness depends on the number of descriptors to be parameterized and the precision of the measurements. It is challenging to characterize the thermodynamic stability for many hundreds of mutant proteins with high precision using traditional biophysical methods. This prompted us to explore a laboratory automation approach for precise high-throughput protein stability measurements.
The most common method for measuring protein stability or ΔGH2o,n-d, the free energy of unfolding of a protein in the absence of denaturant, is to use solvent denaturation with reagents like guanidinium chloride (GdnHCl) or urea. 4 Fluorescence monitored solvent denaturation provides considerable potential for high-throughput measurements due to its high sensitivity (requiring 5 uM compared to 30 uM for circular dichroism monitored thermal denaturation) and the protein concentration independence of the derived parameters.
In this report we show that automation allows us to increase both the precision and throughput of protein stability measurements.
The Consequence of Using Automation to Purify Proteins
We had anticipated that contaminants during protein purification of large numbers of samples would be a major source of variance in stability measurements. Hence, we automated the growth and purification of the proteins. Use of a Biomek 2000 liquid handling robot to purify the his-tagged proteins gives stability values in which the standard deviation of stability values from measurements using multiple protein preparations (±0.05 kcal/mol) differs little from that obtained from multiple measurements using a single protein preparation (±0.04 kcal/mol). 5 Automation reduced measurement variability due to contaminants to ∼10% of that obtained via the best manual methods.
The Consequence of Using Automation to Prepare the Solutions Used in Solvent Denaturation
Solvent denaturation involves adding a solution of denaturant at high concentration to the protein solution at lower denaturant concentration and then measuring the effect on some parameter, in our case fluorescence. If the high-denaturant solution also contains protein, it needs to be at exactly the same concentration as the low-denaturant solution. In our hands, the concentration variability of doing this manually gives rise to standard deviations greater than 0.6 kcal/mol. To deal with this, most manual methods leave the protein out of the high-denaturant solution and correct the readings for protein concentration changes. This reduces the sensitivity of the measurements since the protein concentration is reduced during the high-denaturant portions of the titration and introduces a new source of variability from the concentration correction.
We explored whether automation could be used to prepare high- and low-denaturant solutions with protein concentrations with acceptable levels of variability. Using weights to determine volumes of solutions delivered, we found that the Biomek 2000 was capable of preparing the high- and low-denaturant solutions with protein concentration coefficients of variations of 0.2-0.3%. 5 This amount of variation adds 0.008 kcal/mol to the standard deviations in our measurements. Automation of this step is 50-100 times better than we do manually using protein in both solutions.
The Consequences of Error on Hypothesis Testing
While the number of measurements is critical for using statistical modeling, the quality of the stability measurements is also crucial to one's ability to test hypotheses. Precision of the measurements determines, to a large extent, the significance and robustness of the hypotheses tested.
How good do the high-throughput stability measurements need to be? To estimate the consequences of ΔGh2o,n-d measurement error on the capacity to assess the completeness of models, we did a simulation using real ΔGh2o,n-d data from eglin c mutant proteins. In this simulation, the model was set up to predict the measured values. Simulated ΔGh2o,n-d errors were generated by drawing numbers from normal distributions with means of zero and various standard deviations. These errors were added to 85 real ΔGh2o,n-d measurements taken from the library of eglin c mutant proteins. These values were then fit to the nonerror containing values using a least squares method that gives the proportion of variation in the measured values from the terms in the model (ΔGh2o,n-d) and that from random error (the errors added). If there were no measurement error, the model should predict the variation in the measurements exactly. As the amount of added error increases, the fraction of the variation in the measured values predicted by the otherwise perfect model decreases. The fraction of the variation in the measured values attributable to the measurement error increases as the square of the added error (Fig. 1). Based on this simulation, the consequence of measurement error goes from negligible to large over the range of uncertainties in the literature (±0.10 to ±0.60 kcal/mol). While a measurement error of ±0.10 kcal/mol leaves only 2% of the variation in measured values for an otherwise perfect model unexplained, an error of ±0.60 kcal/mol leaves 48% unexplained by the model. With that level of uncertainty in ΔGh2o,n-d, a large fraction (∼50%) of the measured stability behavior of the mutant proteins would be unexplained by even perfect models.
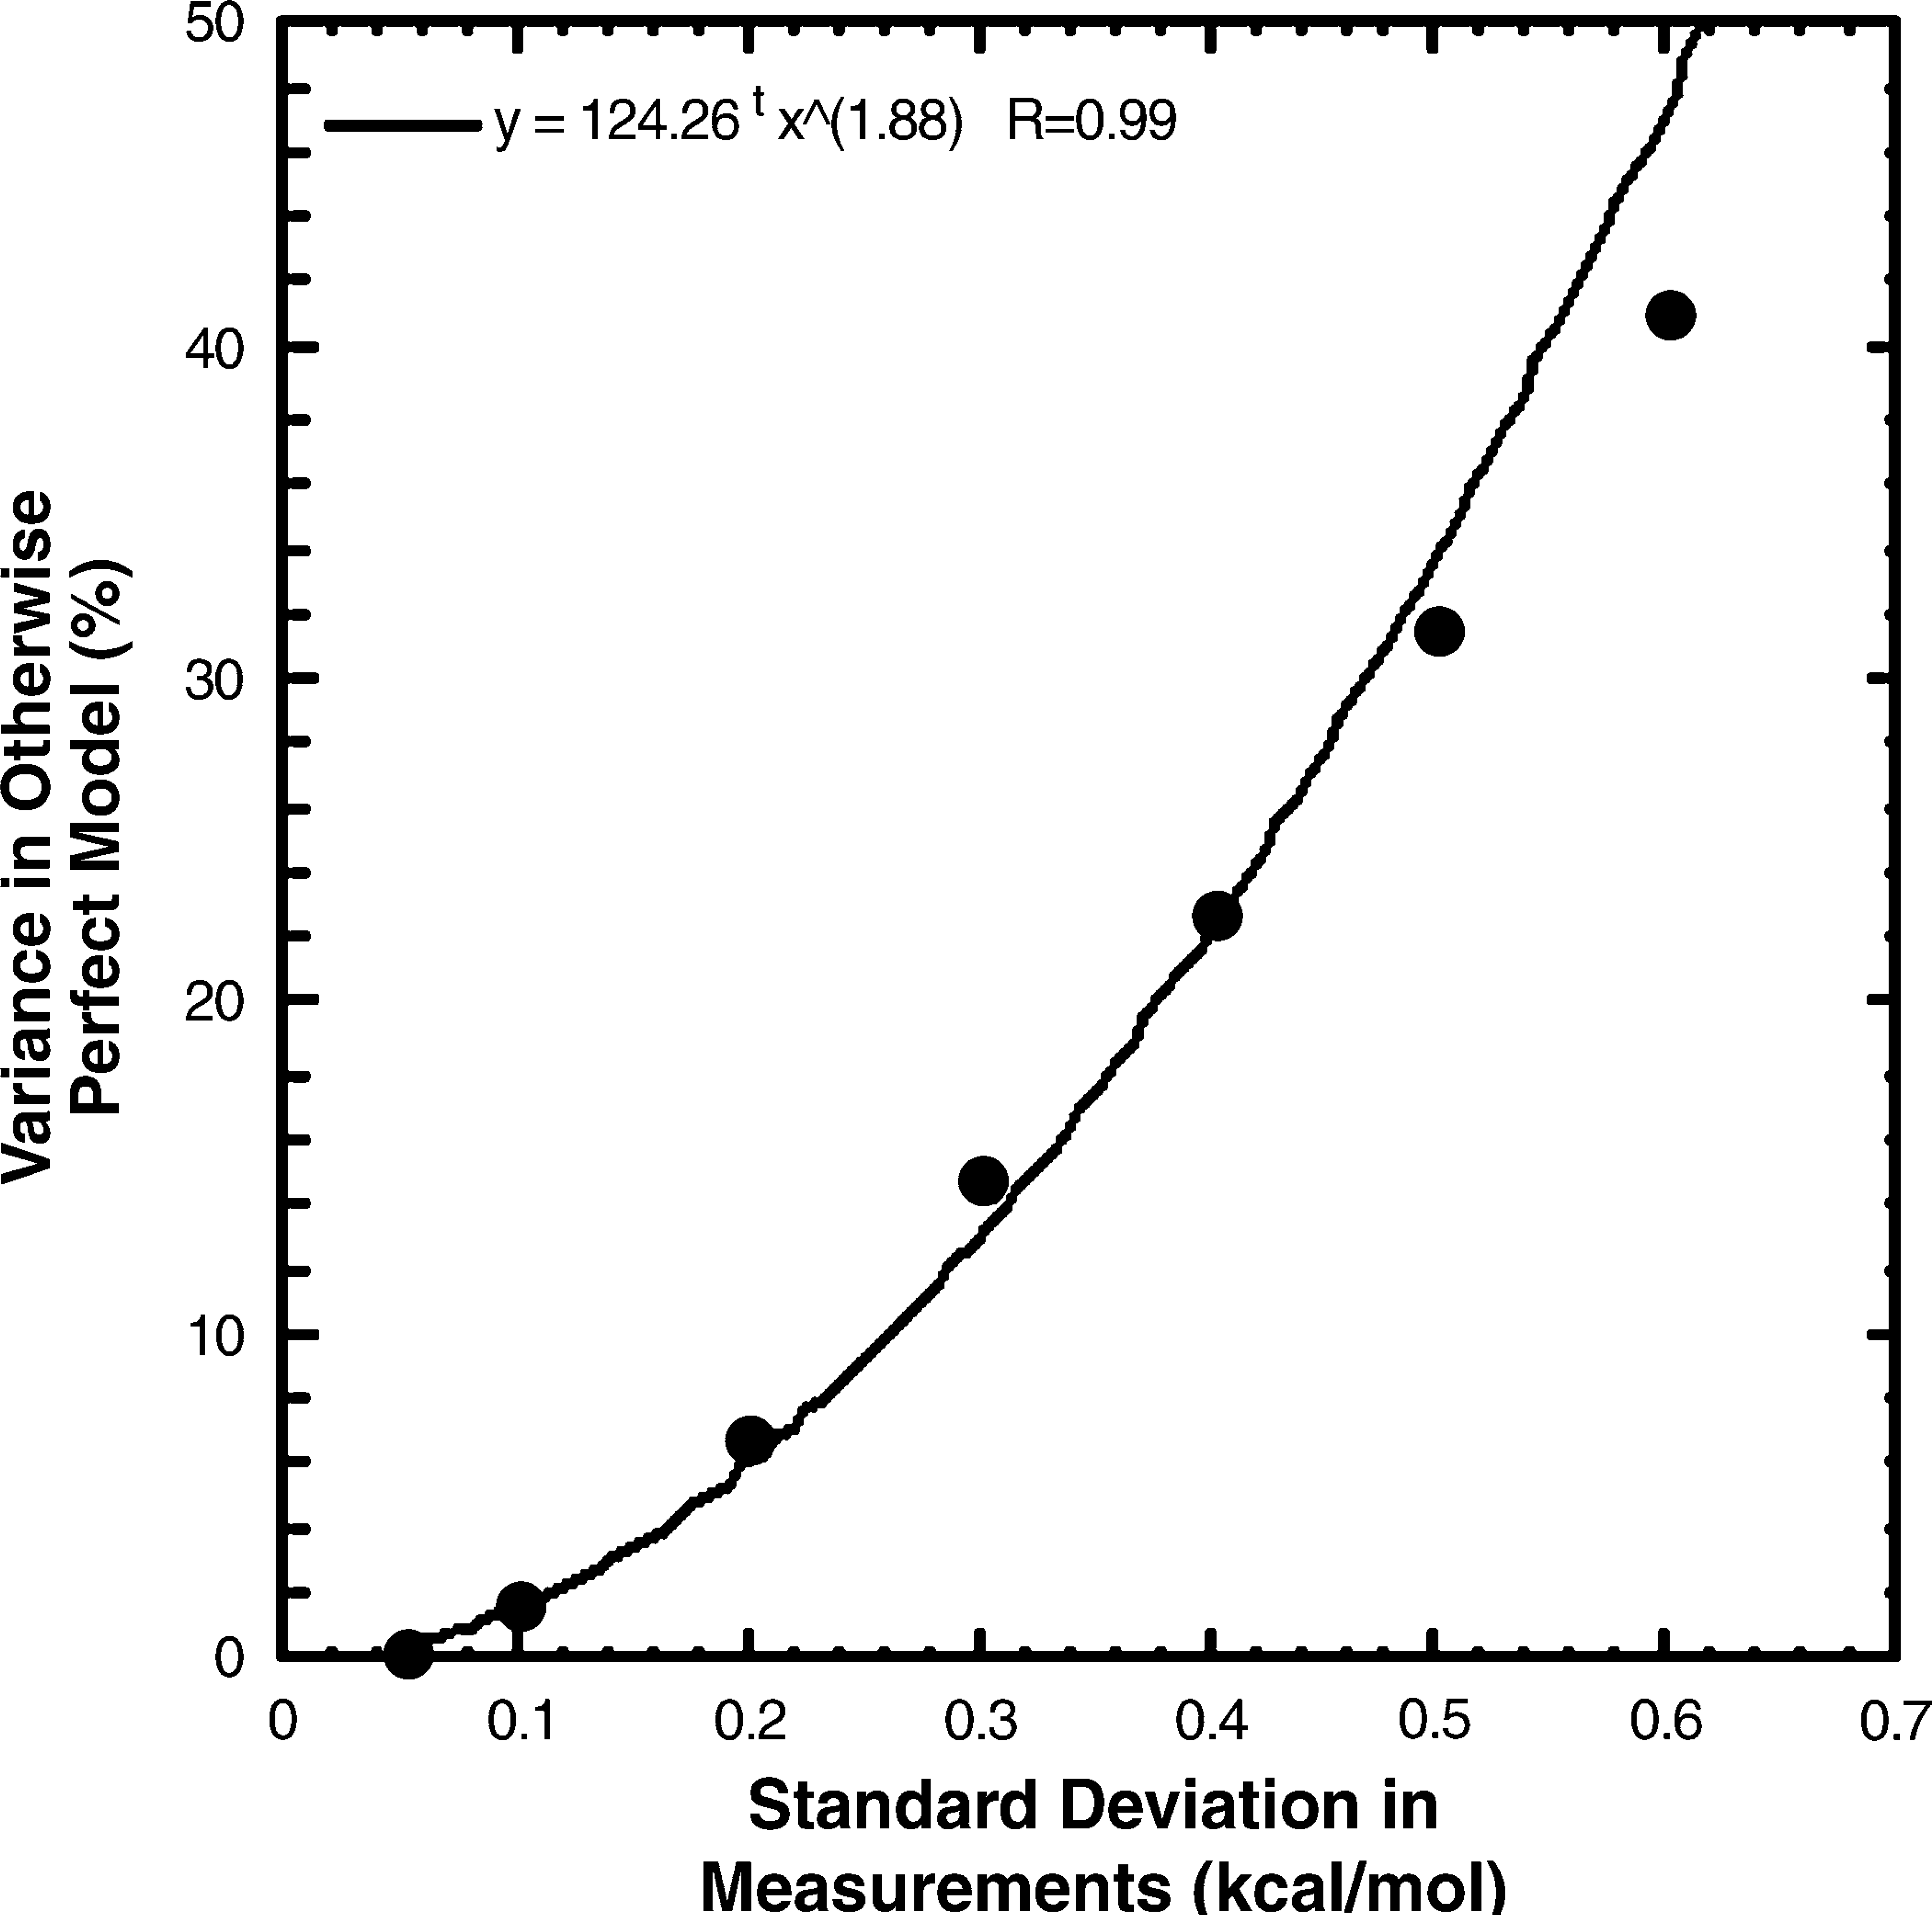
Proportion of the variation in measured values in otherwise perfect models, coming from Δh2o,n-d measurement error. The values for the proportion of variation in the measurements due to measurement error in the plot are the average from nine separate simulations.
Our measurements for ΔGh2o,n-d from a single preparation of wild type eglin c is 6.14 ± 0.04 kcal/mol. Measurements from 19 different preparations of wild type eglin c gave 6.12 ± 0.05 kcal/mol. We also collected ΔGh2o,n-d measurements from four different preparations of 14 mutant eglin proteins selected to represent the range of ΔGh2o,n-d values in the full set. 6 The average standard deviation in ΔGh2o,n-d for these 14 mutant proteins from 56 different protein preparations was ±0.087 kcal/mol. A perfect model would predict 99% of the variation in the data with this level of precision. We were pleasantly surprised that automation gave us the most precise stability values reported in the literature. 6
Sources of Error
Given this requirement for high precision, we dissected the contribution of error from each part of the measurement protocol to the final stability measurements and the corresponding fraction of variance that could be accounted for. 5 There are four major sources that might contribute to the final stability measurement error during the titration process: the difference in protein concentration in the two solutions, the dispensing errors during the titration process due to syringe inaccuracies, the impurities in protein preparation, and the error in the fluorometer intensity measurement, for example, drift in the baseline over time. Our results based on simulations and experimental studies estimate the error in ΔGh2o,n-d data from solution mismatch to be ±0.008 kcal/mol (9%); the error due to Hamilton syringes dispensing error is about ±0.011 kcal/mol (13%); the error from protein impurities is negligible. The major source of error in our ΔGh2o,n-d determinations comes from the fluorometer intensity error, an error of 0.00054 units (measured for our ATF105) produces a standard deviation of ±0.059 kcal/mol, accounting for 68% of the observed standard deviation in the total measurement error ±0.087 kcal/mol.
Alternative Approaches to High Throughput
Before we established the current Robot-ATF105 setup for stability measurements, we also explored other possibilities. One such was the fluorescence plate reader. The idea was to prepare protein samples in different concentrations of GdnHCl in 96-well plate on the robot all at once, let the solutions incubate to reach equilibrium, then make end point fluorescence measurements. Unfortunately, the plate readers we tested all had too much variation in the emission values for our purpose.
We also tested high-throughput DSC as an alternative. Some test runs using our protein samples showed that this method is more reliable in measuring the Tm of different samples (with a standard deviation of triplicate measurements of 0.1 degree) than measuring protein stability values (the derived stability values have a standard deviation of 0.70 kcal/mol), making it more suitable for screening purposes instead of thermodynamic characterization of protein stabilities.
Constraints
Throughputs depend on the time that the protein takes to reach equilibrium after changing the denaturant concentration during the titration process. Eglin c is a fast-folding protein. We are able to collect data from 20 eglin c variants per day using the approach described above. Stop-flow fluorescence measurements show that wild type eglin c takes ∼ 25 s to reach thermodynamic equilibrium when the denaturant concentration is changed from 0 M to 3.5 M. 5 Hence, we must wait at least 25 s between each of the 42 points we take during a titration. A slower folding protein would require more time per determination, and hence, would yield a lower throughput.
With the current apparatus, sample loading is the major step in the titrating process that requires manual handling and therefore determines the throughput. Our lab is currently designing an autosample loader to deal with sample loading to allow us to operate for at least 48 h without operator attention.
Conclusions
In this report we show that a combination of robotics and instrument automation has enabled us to increase the throughput and precision for protein stability measurements. The throughput depends on both the protein (fast-folder or slow-folder) and the sample loading process. The measurement error depends mostly on the precision of the fluorometer followed by the precision of the syringe in dispensing volume and the capacity of the robot to precisely prepare the solutions used for titration. Automation improved the protein purification process and the production of solutions used in titration leading to measurements as good as or better than any other in the literature.
Acknowledgment
Funding for this work was provided by NIH Grant GM58665, NSF Grant MCB0212939, and the North Carolina Biotechnology Center Grant 2002-MRG-134.