
Abstract
A fully automated chip-based nanoelectrospray (nanoESI) system, NanoMate® 100 (Advion Bio-Sciences, Inc., Ithaca, NY), was evaluated for its application on quantitative bioanalysis of small molecules in support of exploratory pharmacokinetic (PK) studies. The NanoMate® 100 was compared with the conventional autosampler coupled with liquid chromatography-electrospray (LC-ESI) interface. An API® 3000 triple quadrupole mass spectrometer (Applied Biosystems, Inc., Foster City, CA) was used for the evaluation. The results show that the NanoMate® 100 performs comparably to LC-ESI in terms of standard curve fitting, low limit of quantitation (LLOQ), dynamic range, accuracy, and precision. Parallel analyses of exploratory PK study samples show high correlation (
Introduction
In the past decade, electrospray ionization-tandem mass spectrometry (ESI-MS/MS) has proven to be an extremely powerful tool in quantitative drug analysis. Liquid chromatography (LC) has been used as the primary separation tool prior to sample introduction to the ESI-MS/MS. A microfabricated, fully automated NanoESI system, NanoMate® 100, was introduced three years ago, and has been primarily applied to proteomics and genomics research. 1 2 3 The NanoMate® 100 is comprised of a miniature robotic liquid sampling arm and disposable nanoESI chip with a 10 × 10 array of micro-fabricated ESI nozzles. This automated sample handling system coupled with the ESI Chip® has potential benefits such as increased sample throughput, better reproducibility, higher sensitivity, and significantly lower cost over conventional LC-ESI interface. 4 In this study, the NanoMate® 100 was evaluated by comparing with the conventional LC-ESI interface coupled with 96-well based autosampler. An API® 3000 was used as the mass spectrometer. The NanoMate® 100 was fitted on the front of the API® 3000 using a mounting bracket to replace the standard Turbo Ionspray® source. Plasma standard curves spiked with Compound A were analyzed on both configurations. Comparative evaluation was conducted based on curve fitting, linear range, limit of quantitation (LOQ), matrix effect, and carryover. In addition, exploratory PK study plasma samples were analyzed on both configurations to compare the nanoESI-MS/MS data with the conventional LC-ESI-MS/ MS data.
Methods
Materials and Instrumentations
Water (H2O), acetonitrile (ACN), and methanol (MeOH) were HPLC grade. Formic acid (FA) and trifluoroacetic acid (TFA) were chemical reagent grade. The conventional LC-ESI-MS/MS consisted of Rheos LC pump (Flux Inc., Carrboro, NC), Leap CTC PAL autosampler (Leap Technologies Inc., Carrboro, NC), and API® 3000 triple quadrupole mass spectrometer (Applied Biosystems Inc., Foster City, CA). The chip-based nanoESI-MS/MS system consisted of NanoMate® 100 (Advion BioSciences, Ithaca, NY) and API® 3000 triple quadrupole mass spectrometer. Analyst® 1.1 or higher (Applied Biosystems Inc., Foster City, CA) was the software for API® 3000 data acquisition and analysis. ChipSoft® (Advion BioSciences Inc., Ithaca, NY) was the software for NanoMate® 100 operation.
NanoMate® 100 Evaluation
Standard curves were prepared in triplicates by spiking Compound A into beagle dog plasma. Details are described in Figure 1. One third of the plasma extract was analyzed on the conventional LC-MS/MS configuration. A 5 μm, 30 × 2 mm, Luna® Phenyl-Hexyl column (Phenomenex Inc., Torrance, CA) was used as the analytical column. Mobile phases consisted of 10 mM of ammonium formate at pH 5.0 (B) and methanol (C). LC gradient is described in Figure 2. The MS/ MS transitions were 361.2 → 212.1 and 386.0 → 237.0 for Compound A and the internal standard (I.S.), respectively.
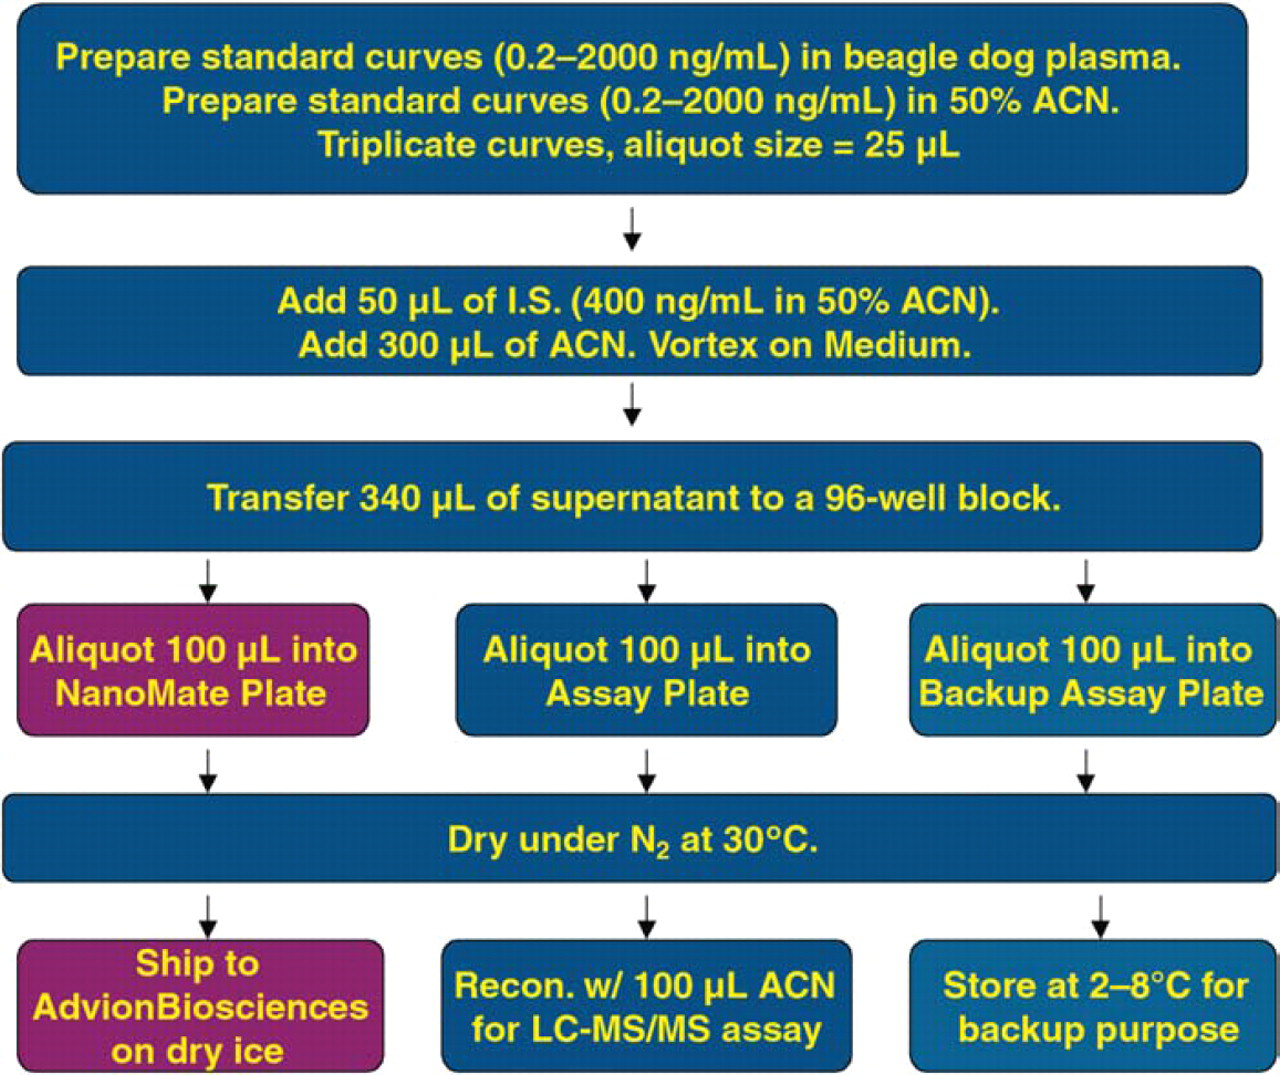
Standard curve sample preparation of Compound A in beagle plasma.
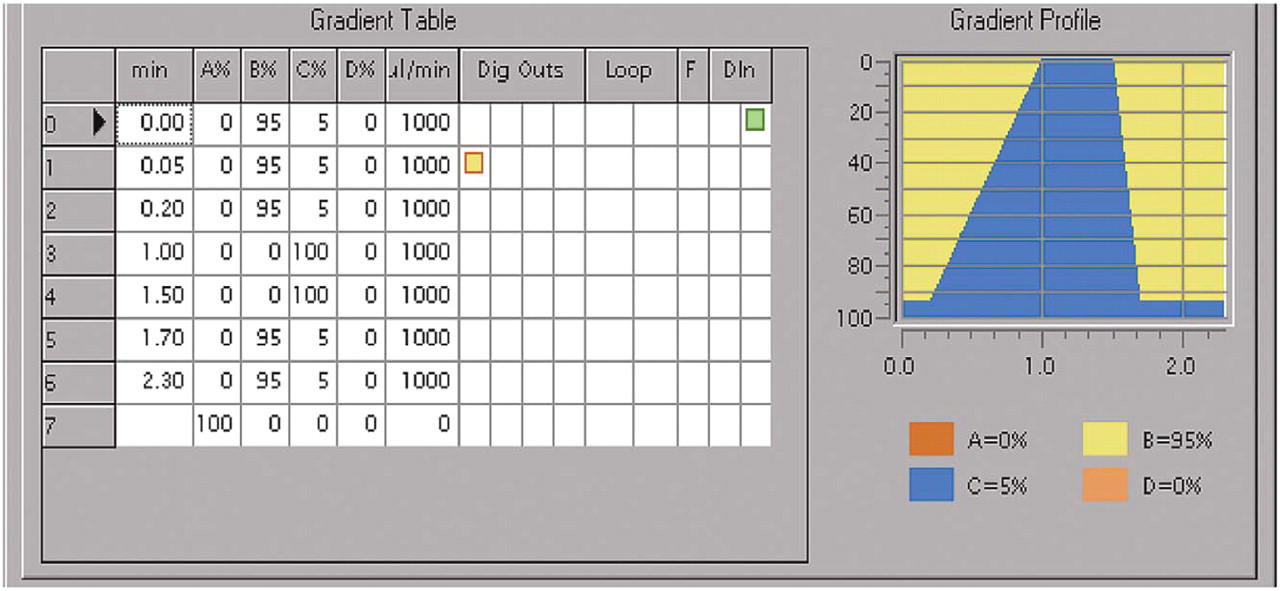
LC gradient profile (
One third of the plasma extract was shipped to Advion BioSciences Inc. (Ithaca, NY) and further extracted using the ZipTip® C18 (Millipore Inc., Billerica, MA) as described in Figure 3. The final extract was analyzed on a NanoMate® 100-MS/MS configuration.
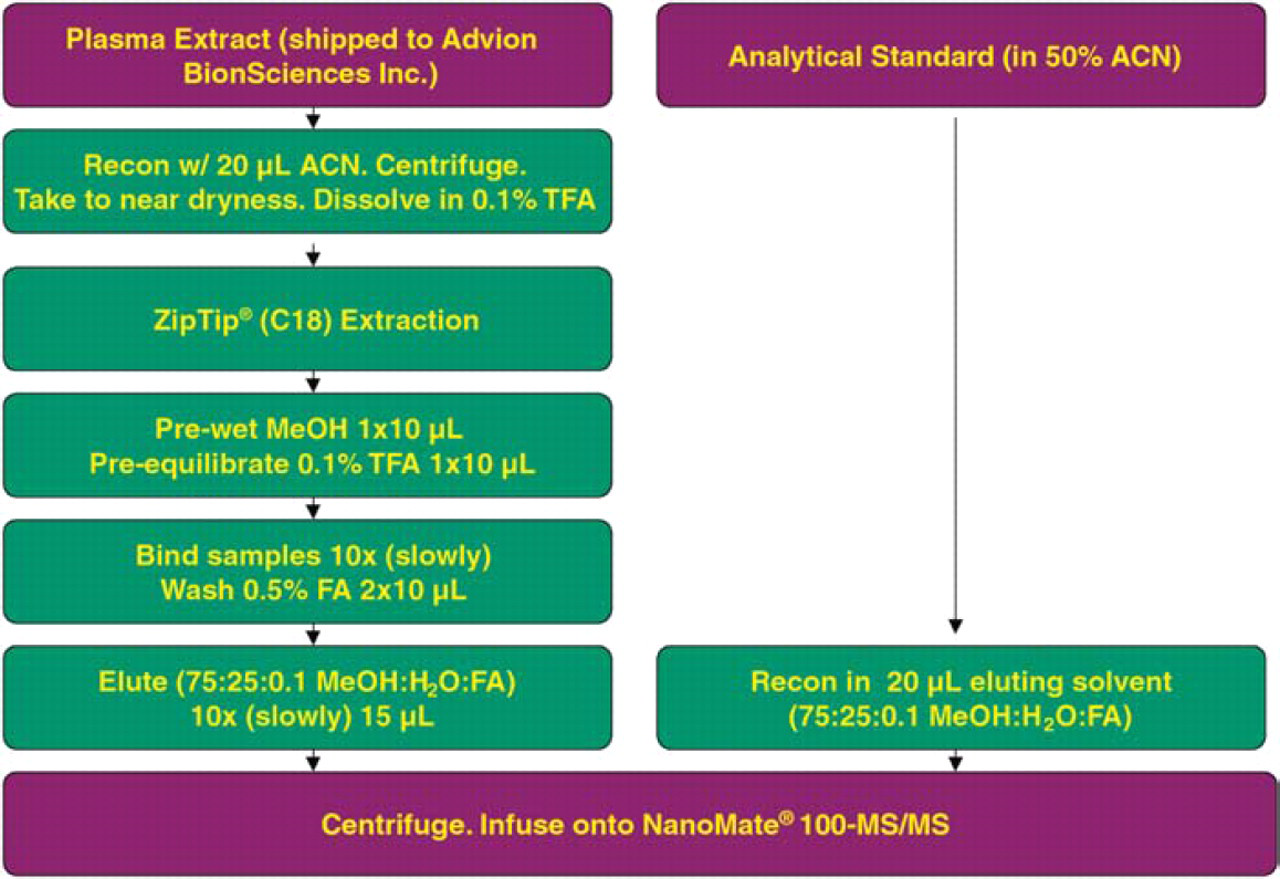
ZipTip® extraction of Compound A from beagle plasma extract after protein precipitation.
Exploratory PK Sample Analysis
A total of 103 plasma samples were collected from several exploratory PK studies, where one of the five compounds (B-F) was administered to different species (rat or mouse) intravenously (iv) or orally (po). Samples were analyzed in parallel on the LC-ESI-MS/MS system and the NanoMate® 100-MS/MS system. Sample preparation details are in Figure 4. A 5 μm, 30 × 2 mm, Clipeus® C18 column (Hig gins Analytical Inc., Mountain View, CA) was used as the analytical column. LC mobile phases consisted of 0.1% formic acid in water (A) and 0.1% formic acid in methanol (B). The LC gradient started from 95/5 (A/B), and then changed to 50/50 (A/B) at 0.69 minute. The LC gradient ramped up from 50/50 (A/B) to 100%B from 0.70 to 1.40 minute. The LC gradient remained at 100%B from 1.40 to 1.90 minute. LC flow was 1.0 mL/minute, and the LC run time was 1.90 minutes. The MS/MS transitions were 475.2 → 111.2, 577.3 → 128.3, 492.2 → 357.0, 588.2 → 128.3, 570.1 → 128.1, and 374.2 → 212.1 for Compounds B-F and the I.S., respectively.
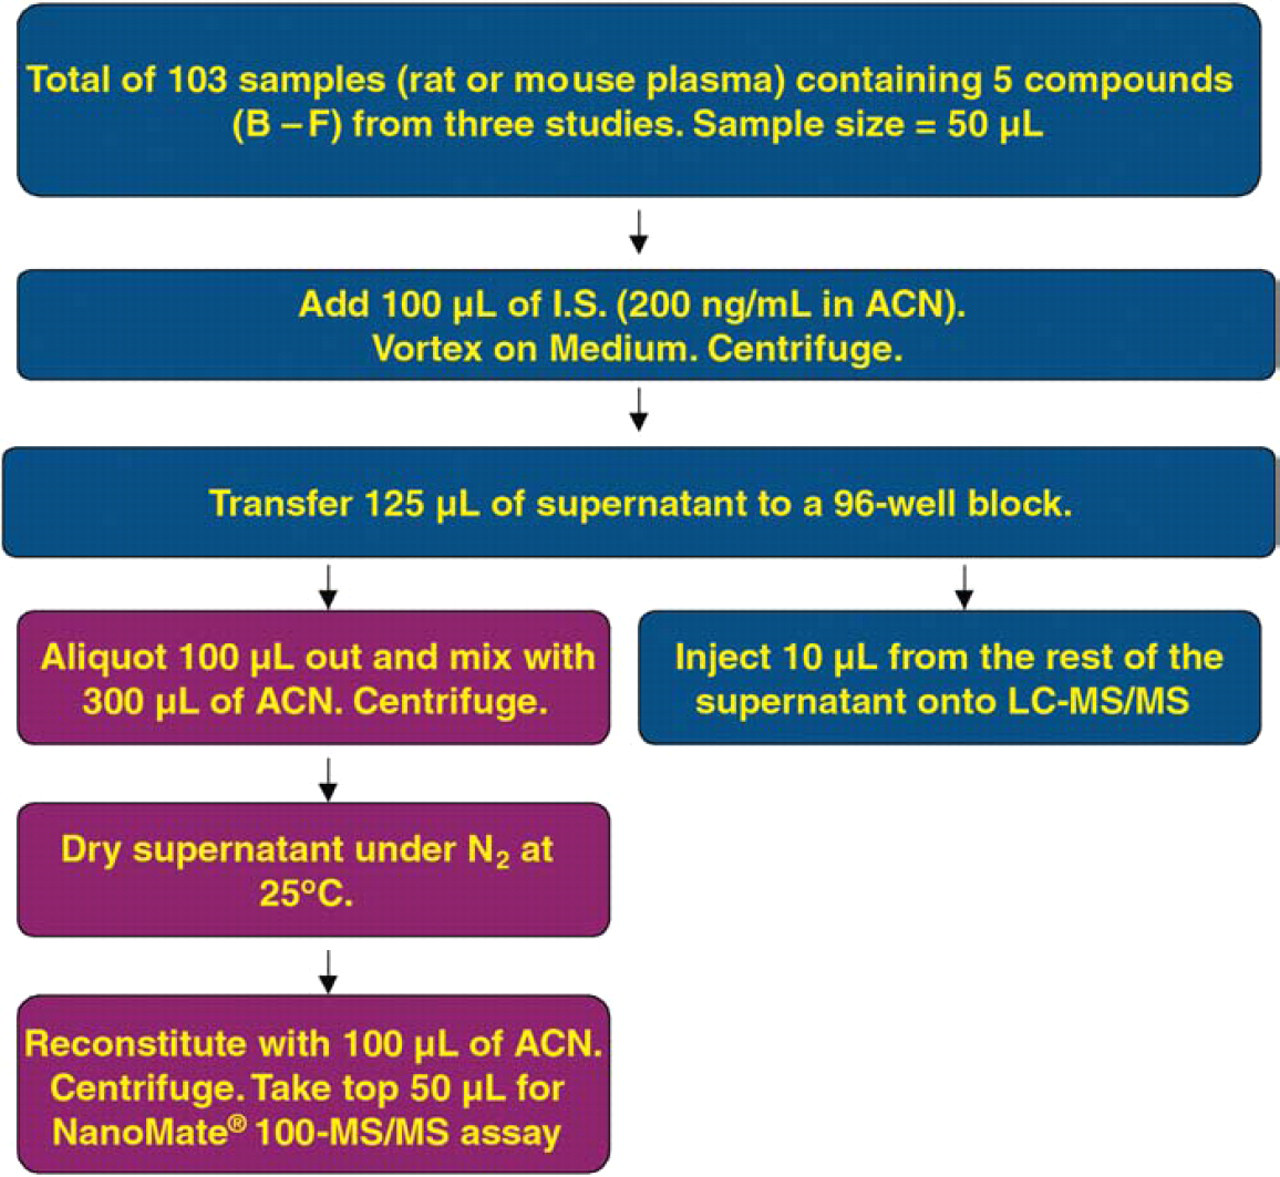
Plasma sample preparation of compounds B-F dosed to rat or mouse in five exploratory PK studies.
Results
NanoMate® 100 Evaluation
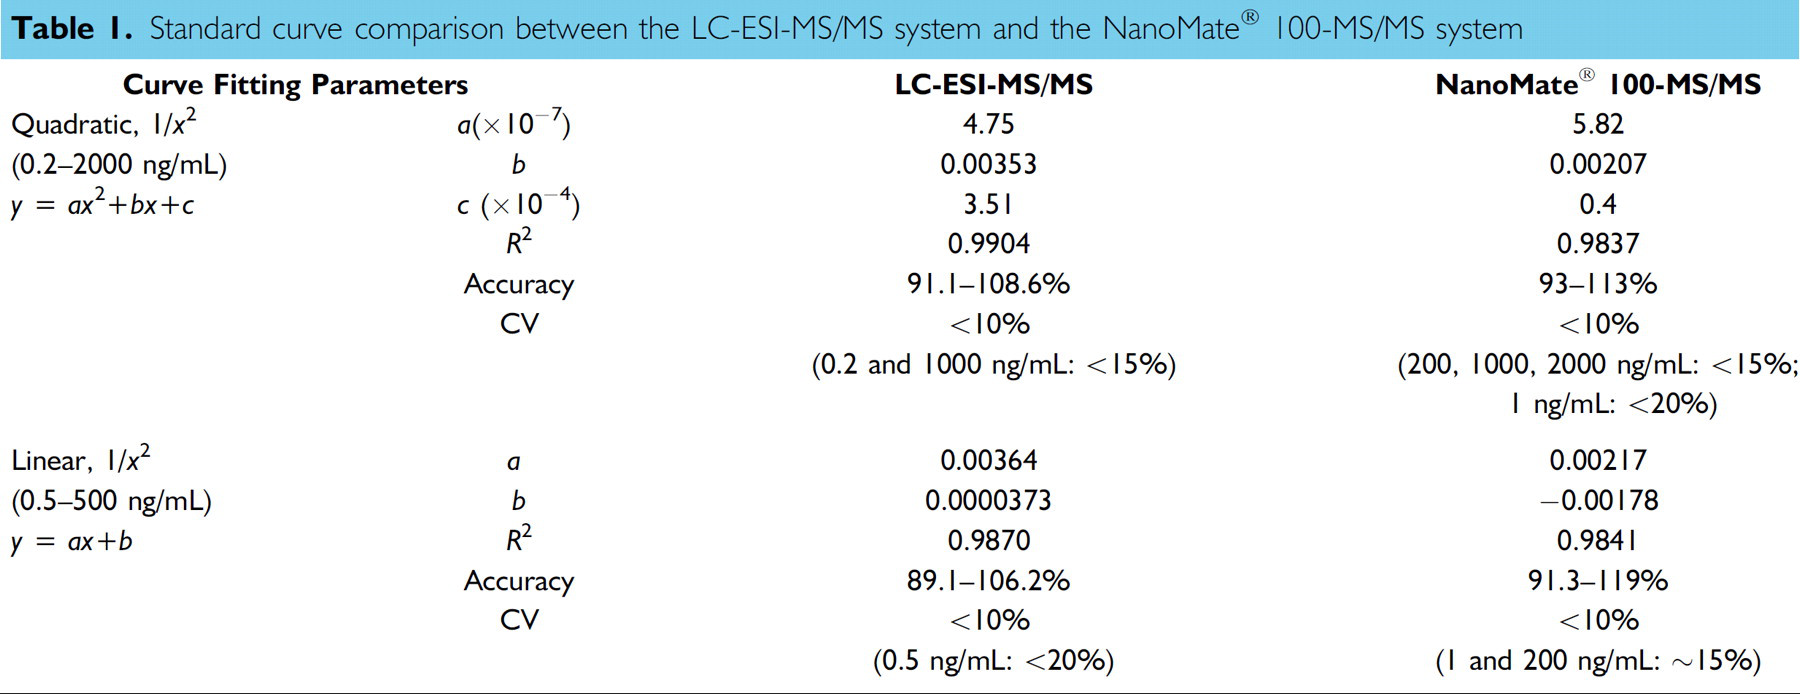
The standard curves of Compound A using NanoMate® 100 were comparable to those obtained using a conventional autosampler-LC-ESI interface. For comparison, the standard curves were fitted using both quadratic and linear regression with 1/
Standard curve comparison between the LC-ESI-MS/MS system and the NanoMate® 100-MS/MS system
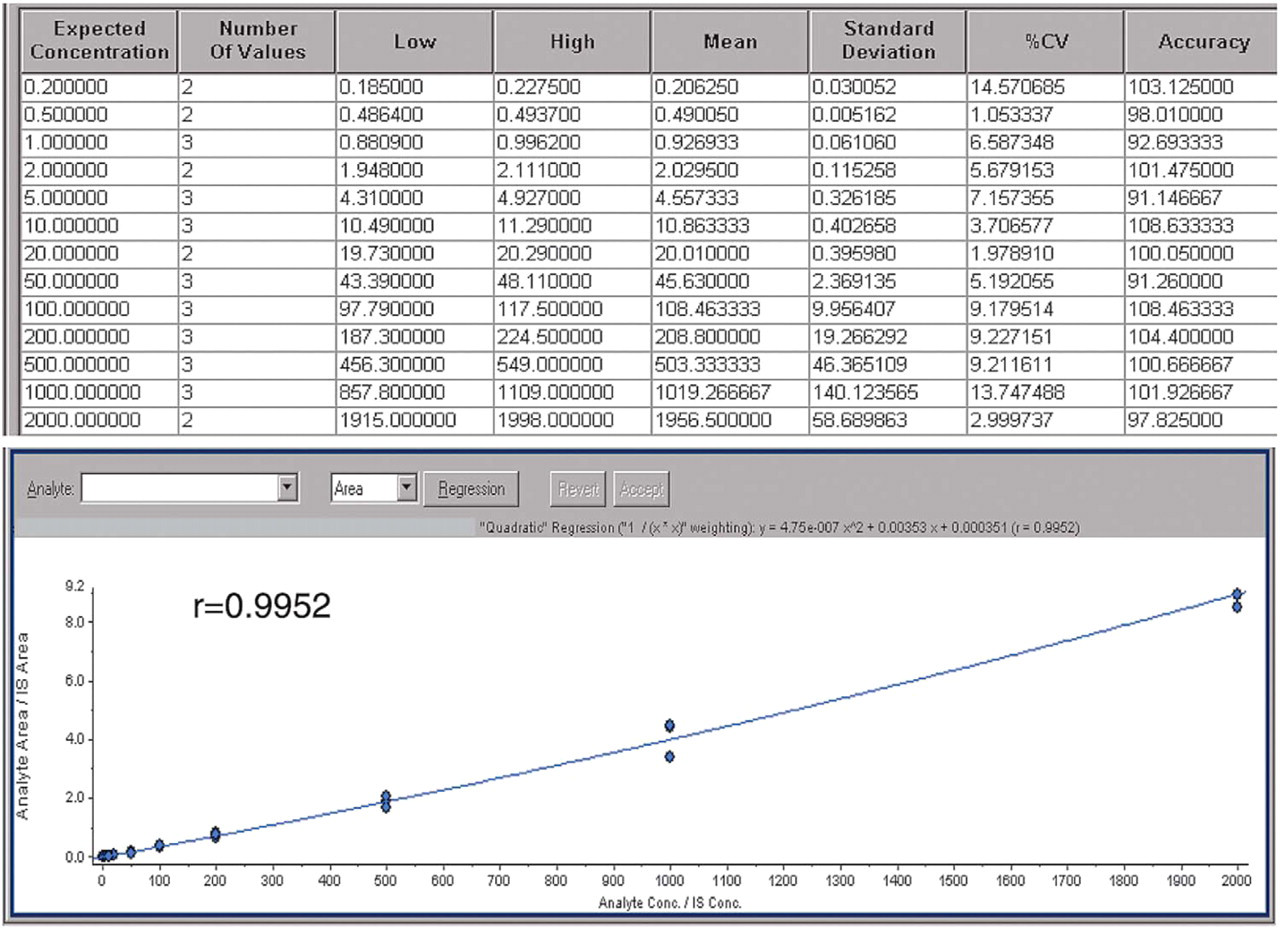
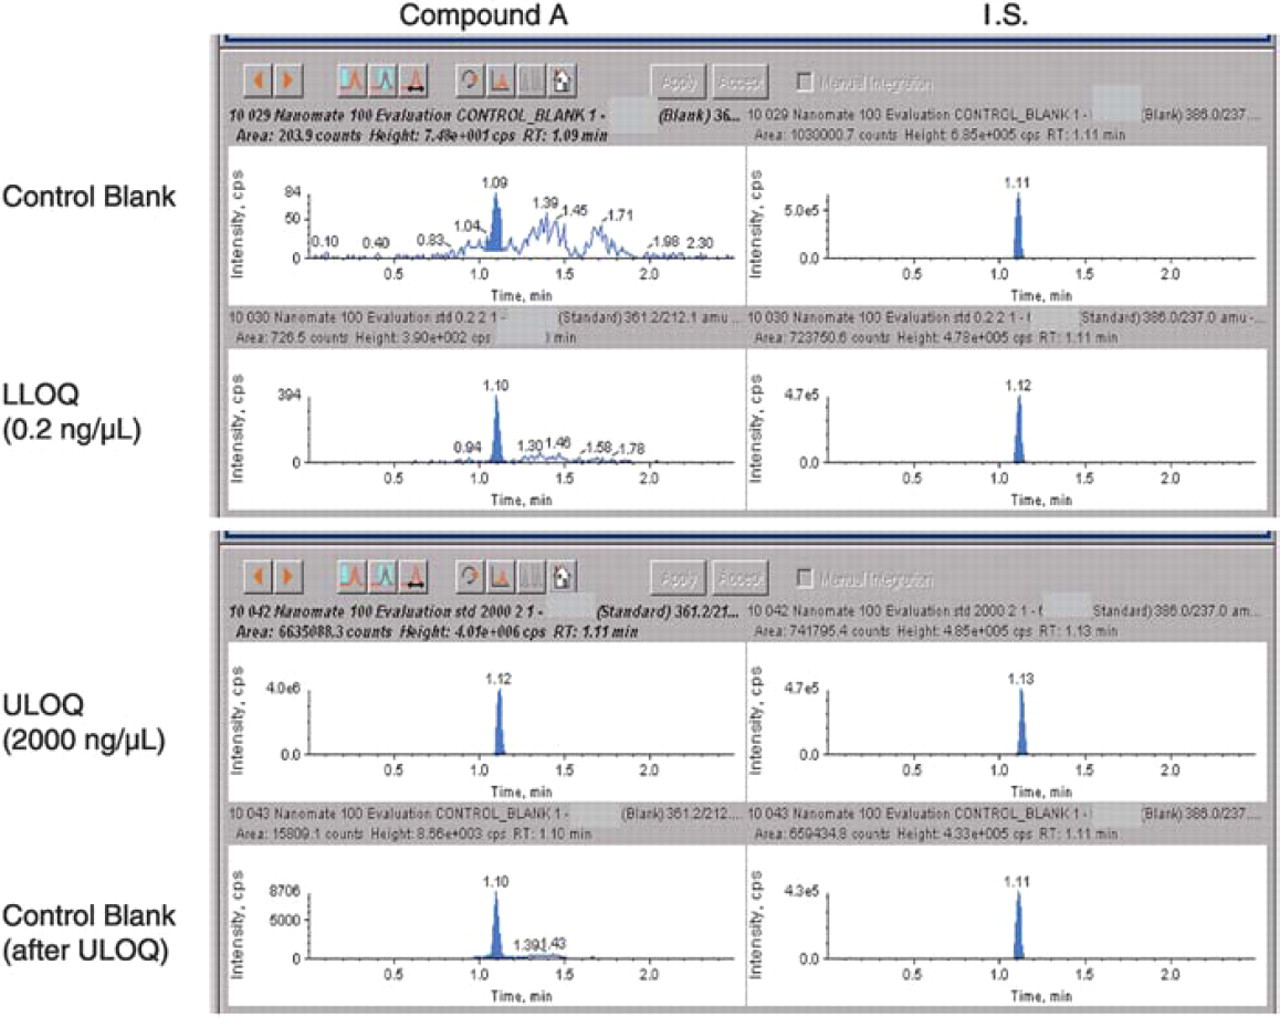
Compound A standard curves analyzed on LC-ESI-MS/MS (0.2–2000 ng/mL, quadratic, 1/
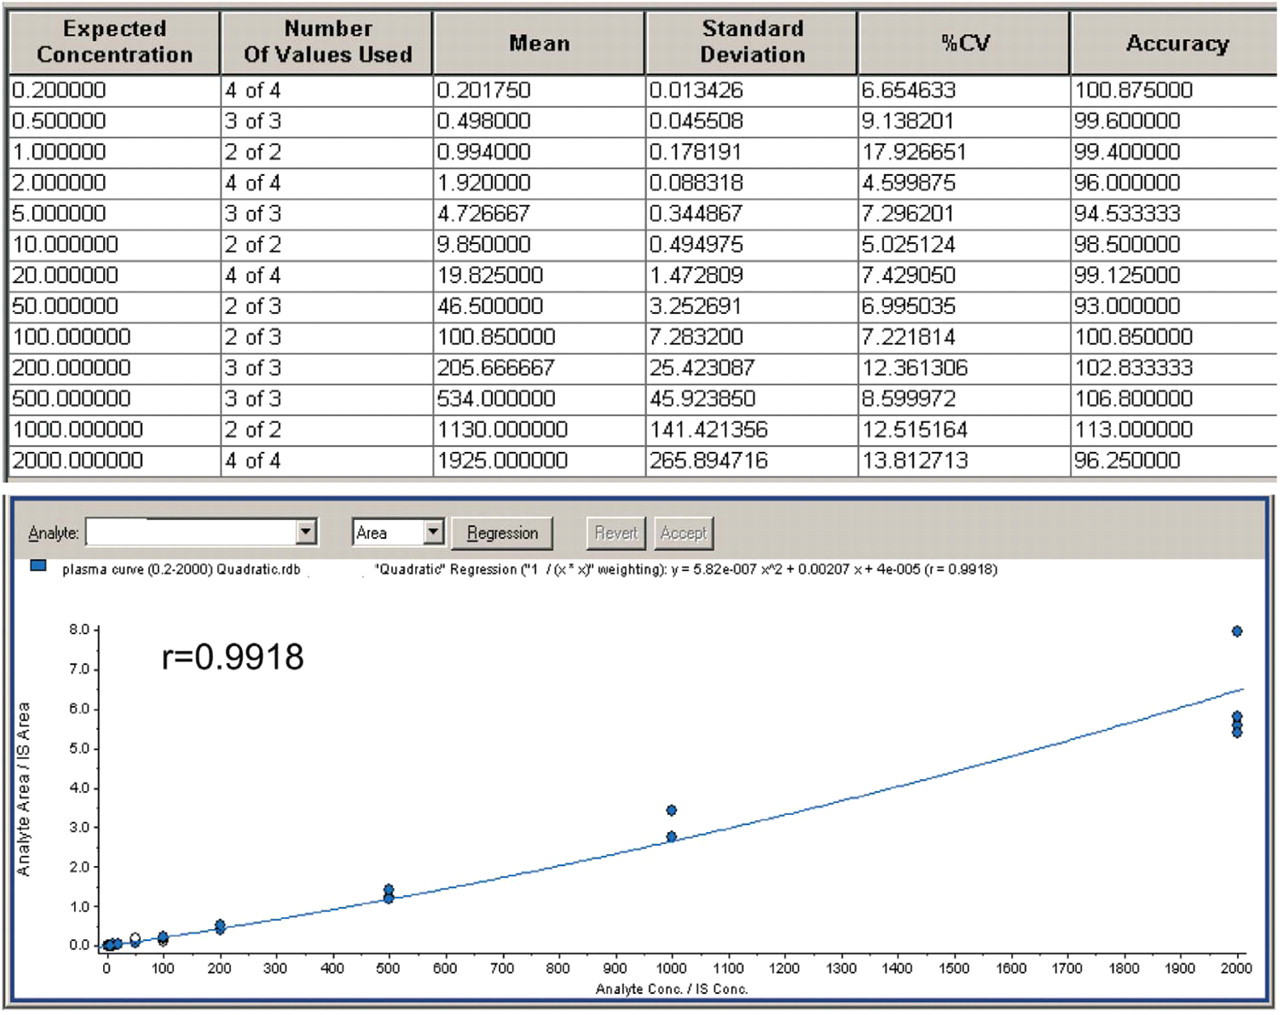
Compound A standard curves analyzed on NanoMate® 100-MS/MS (0.2–2000 ng/mL, quadratic, 1/
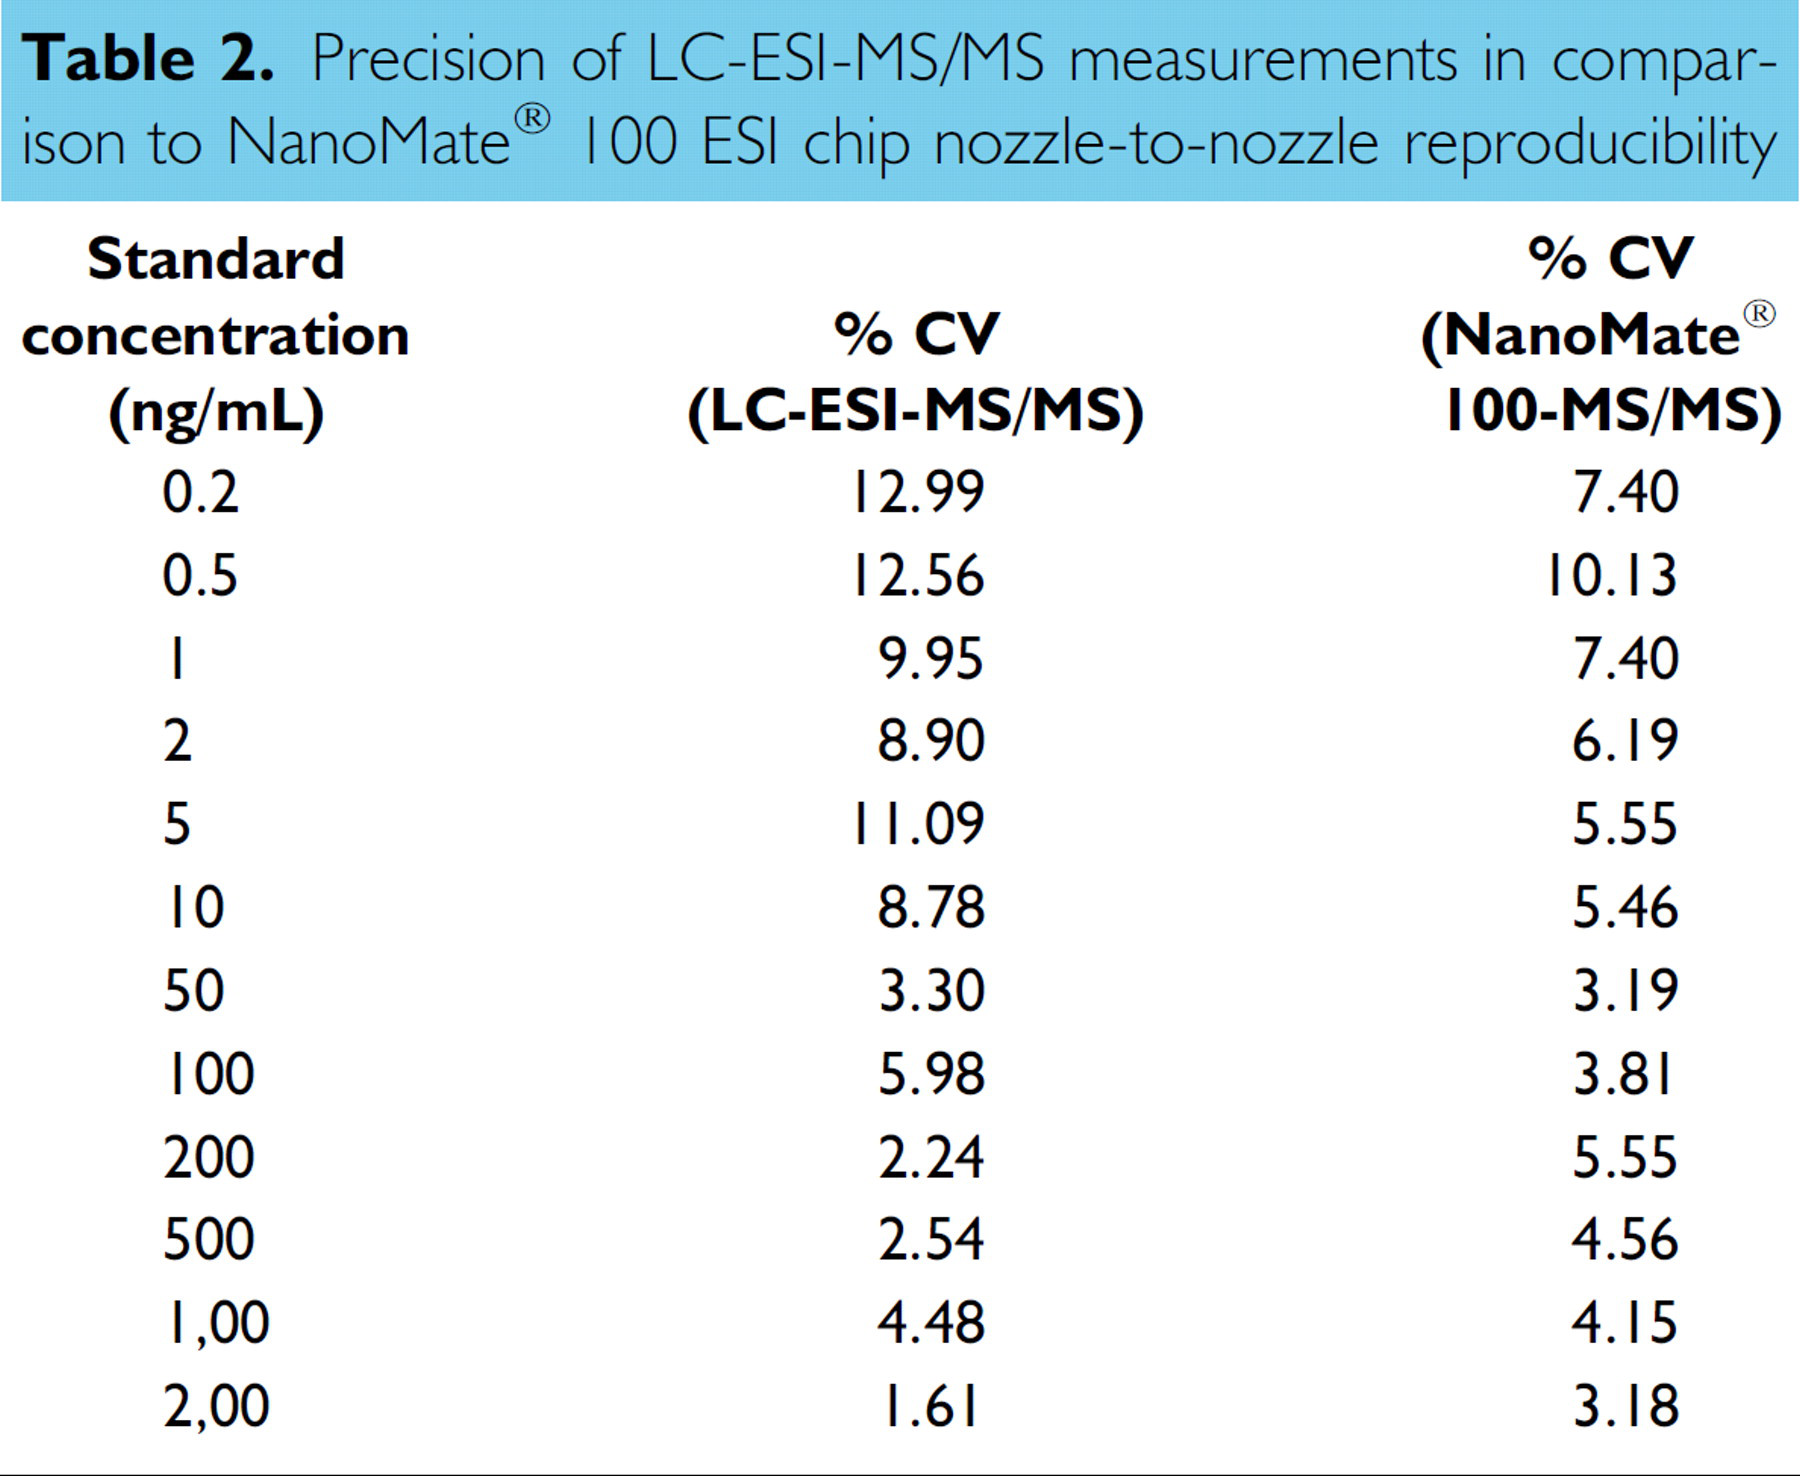
The nozzle-to-nozzle reproducibility of the NanoMate® 100 ESI chip was tested by infusing the same standard curve sample onto five different nozzles on the ESI chip. For LC-ESI reproducibility, each standard curve sample was injected five times. Below 10 ng/mL better precision was observed with the NanoMate® 100 system. The results on precision are summarized in Table 2. Significant matrix effect on I.S. response was observed in dog plasma samples using the LC-ESI-MS/MS system (Figure 7). The I.S. peak area in spiked plasma was less than 50% of that in neat solution (50% ACN). No significant difference in I.S. peak area was observed between plasma samples and neat solutions when samples were analyzed using NanoMate® 100 following ZipTip® C18 extraction (Figure 8). The elimination of the matrix interference was due to additional cleaning by the ZipTip® C18 procedure.
Precision of LC-ESI-MS/MS measurements in comparison to NanoMate® 100 ESI chip nozzle-to-nozzle reproducibility
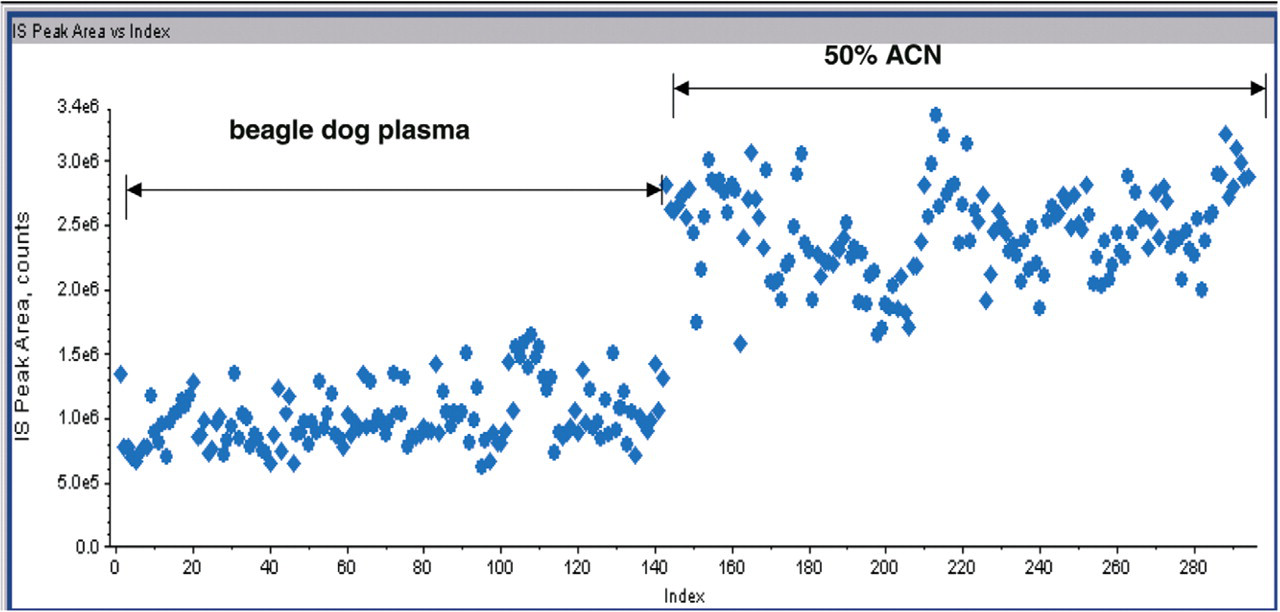
Matrix effect on I.S. in plasma extracts and neat solutions (50% ACN) analyzed on the LC-ESI-MS/MS.
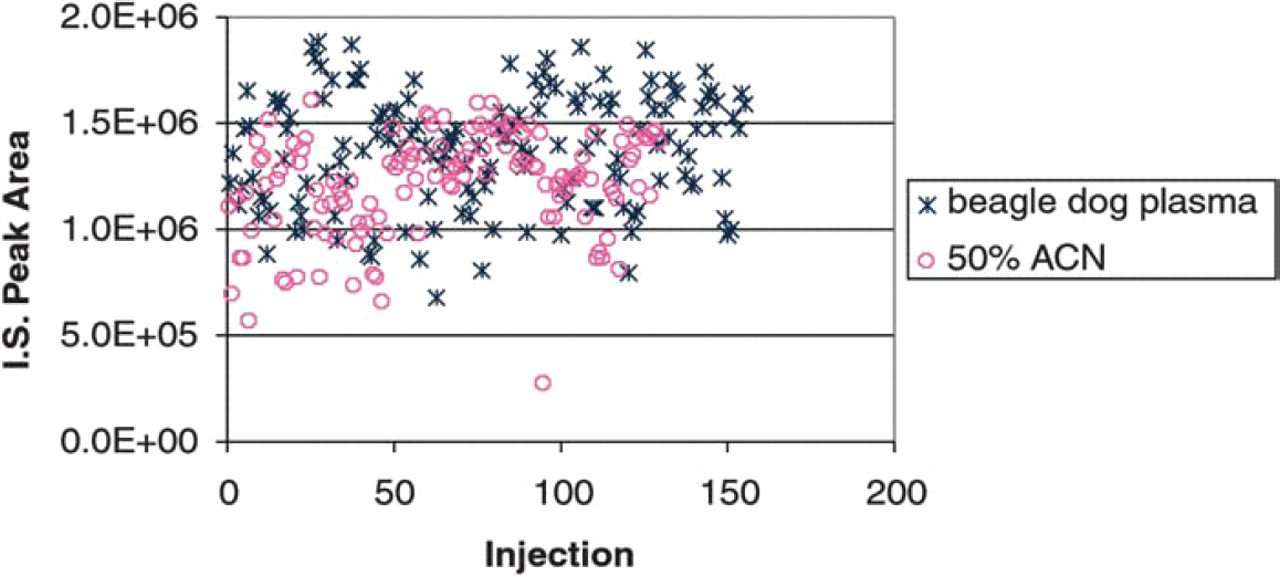
Matrix effect on I.S. in plasma extracts and neat solutions (50% ACN) analyzed on the NanoMate® 100-MS/MS following ZipTip® extraction.
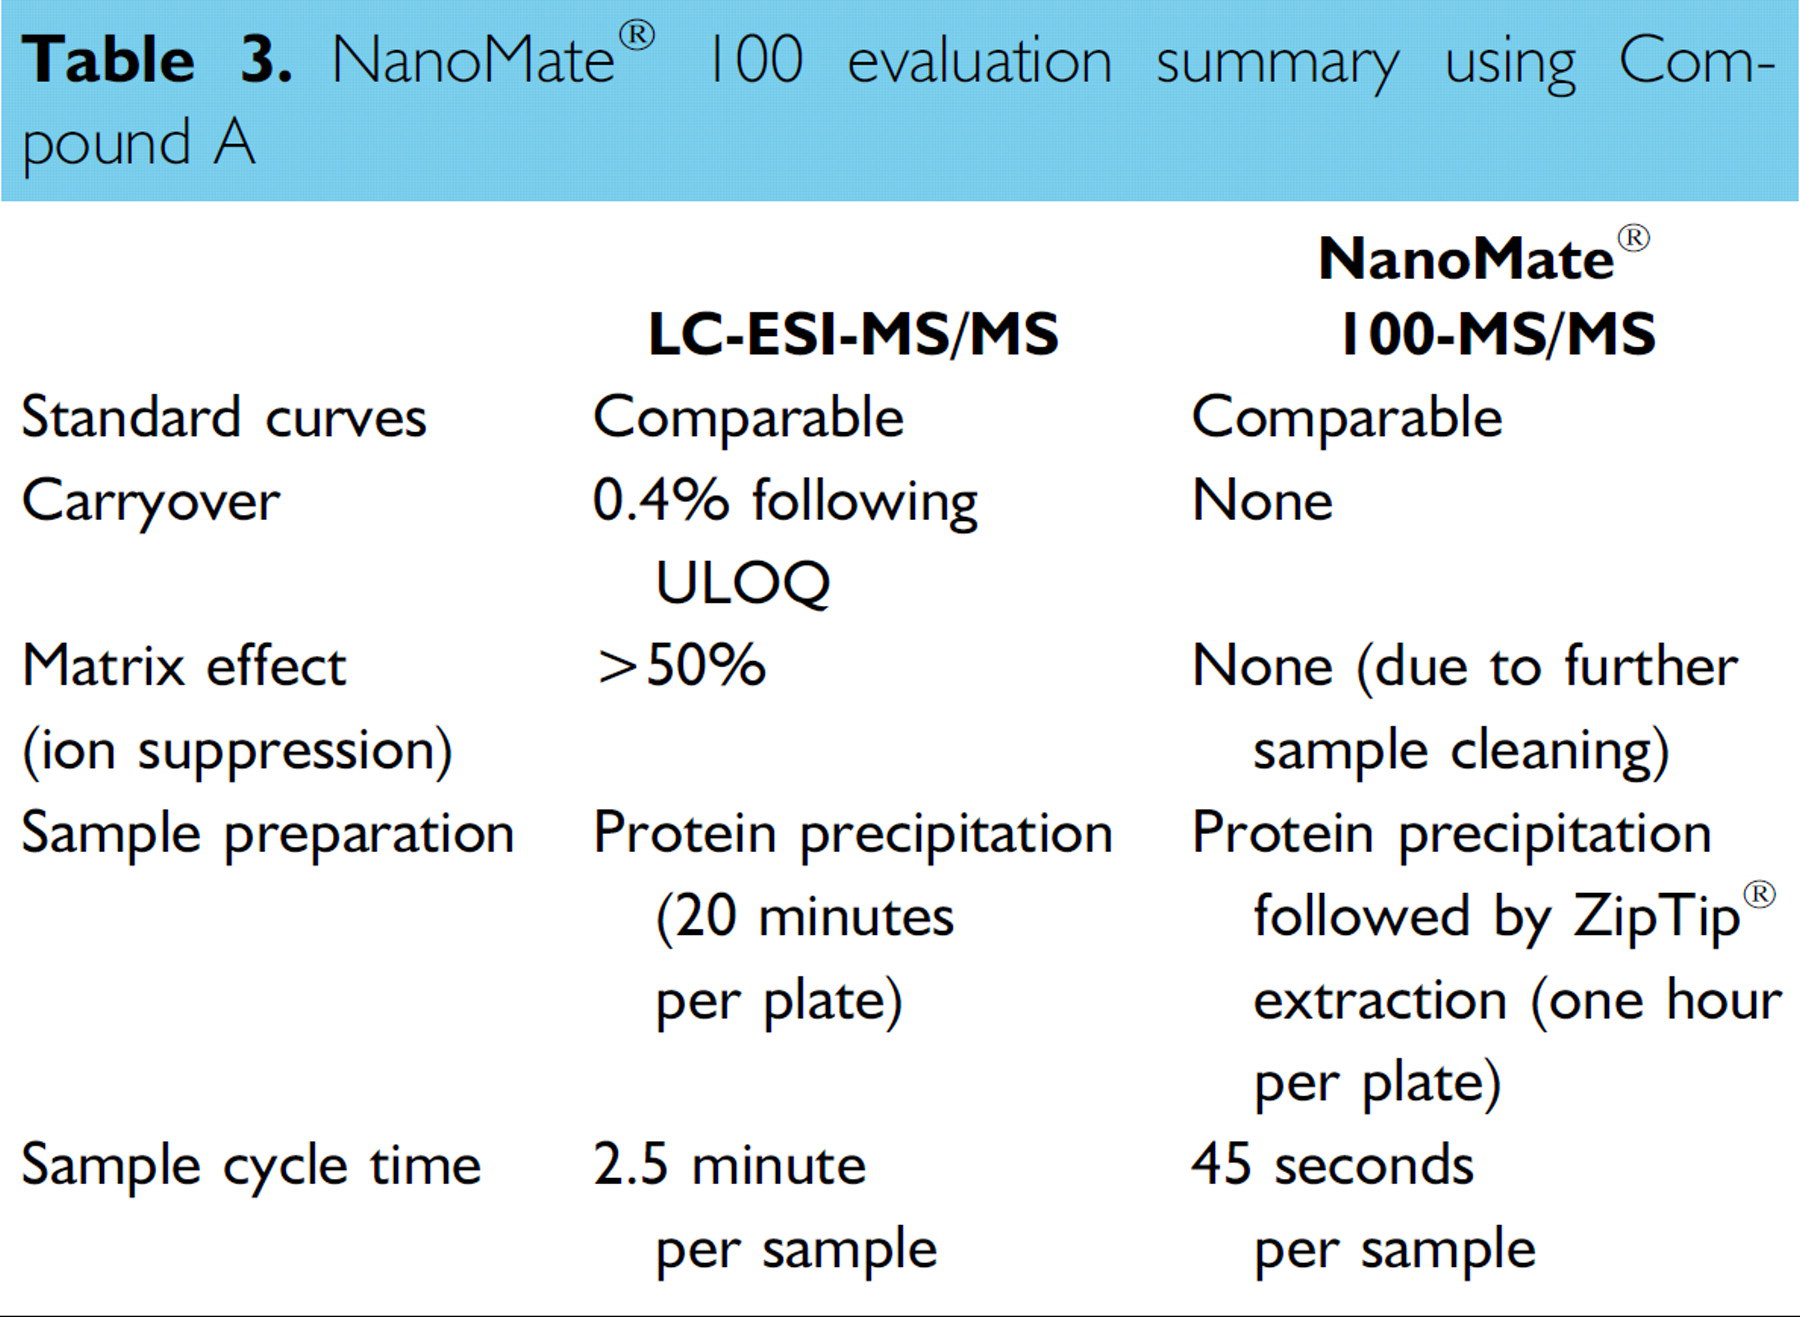
High carryover of 0.4% after the upper limit of quantitation (ULOQ) was observed using the LC-ESI-MS/ MS system (Figure 9). This carryover was completely avoided by the “one injection per nozzle” nature of the NanoMate® 100 ESI chip (Figure 10). Overall evaluation of the NanoMate® 100-MS/MS is summarized in Table 3.
NanoMate® 100 evaluation summary using Compound A
Carryover of Compound A in plasma standards analyzed on the LC-ESI-MS/MS.
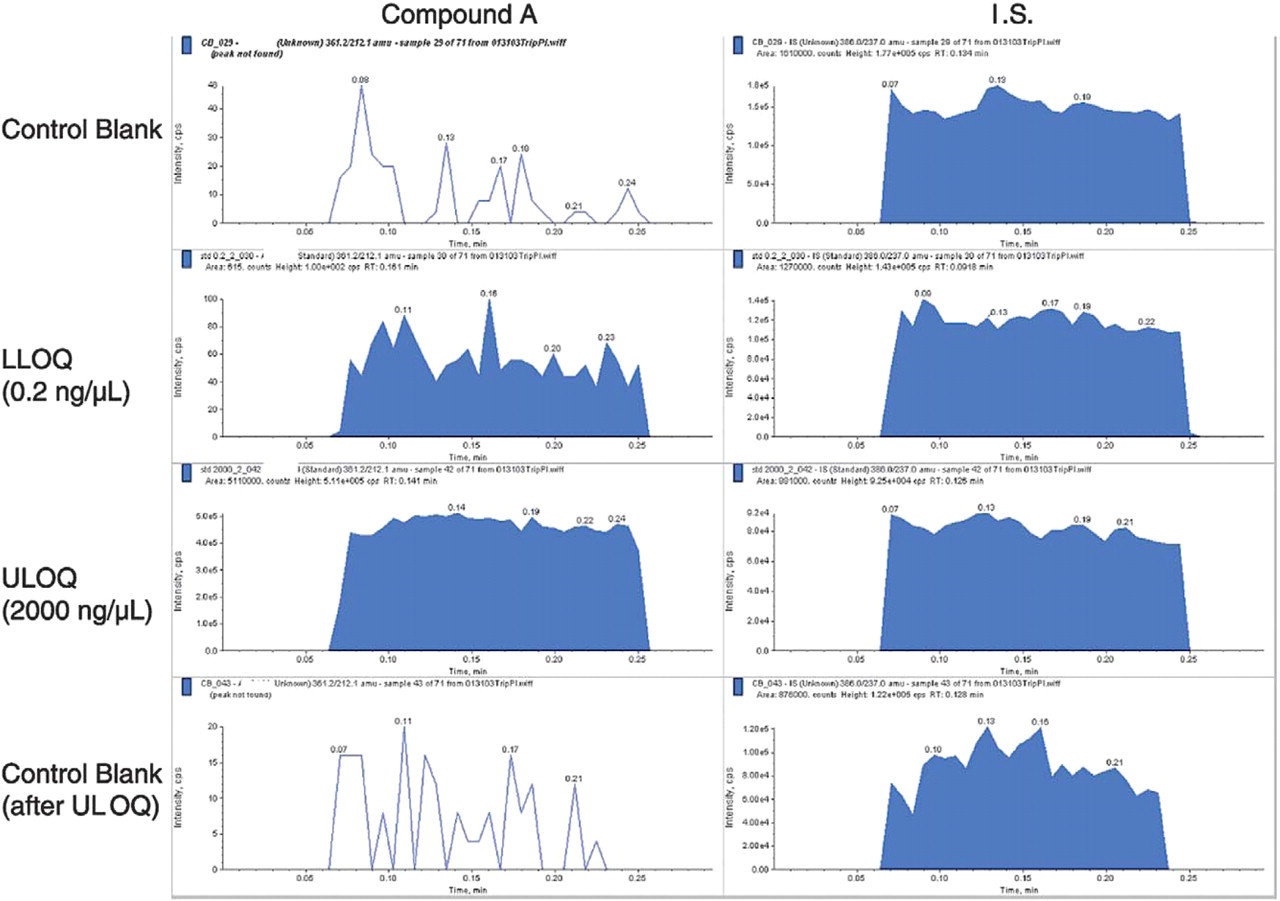
Carryover of Compound A plasma standards analyzed on the NanoMate® 100-MS/MS.
ZipTip® extraction using a multichannel pipette is very laborious and was not applied during the sample preparation in this study. This was because a large number of repetitions (10 times or more) are required for sample application, wash, and elution steps in order to ensure complete extraction. In addition, due to the different physical-chemical properties of compounds B-F, development of individual ZipTip® extraction methods for each compound would have been required. Overall, ZipTip® does not lend itself to high throughput multiple-analyte analysis in exploratory PK studies. Instead, protein precipitation with additional clean up via centrifugation was developed for sample preparation. The LLOQ was 0.5 ng/mL for four out of the five compounds with an exception of compound B, which had a LLOQ of 1 ng/mL. All standard curves were fitted linearly with 1/
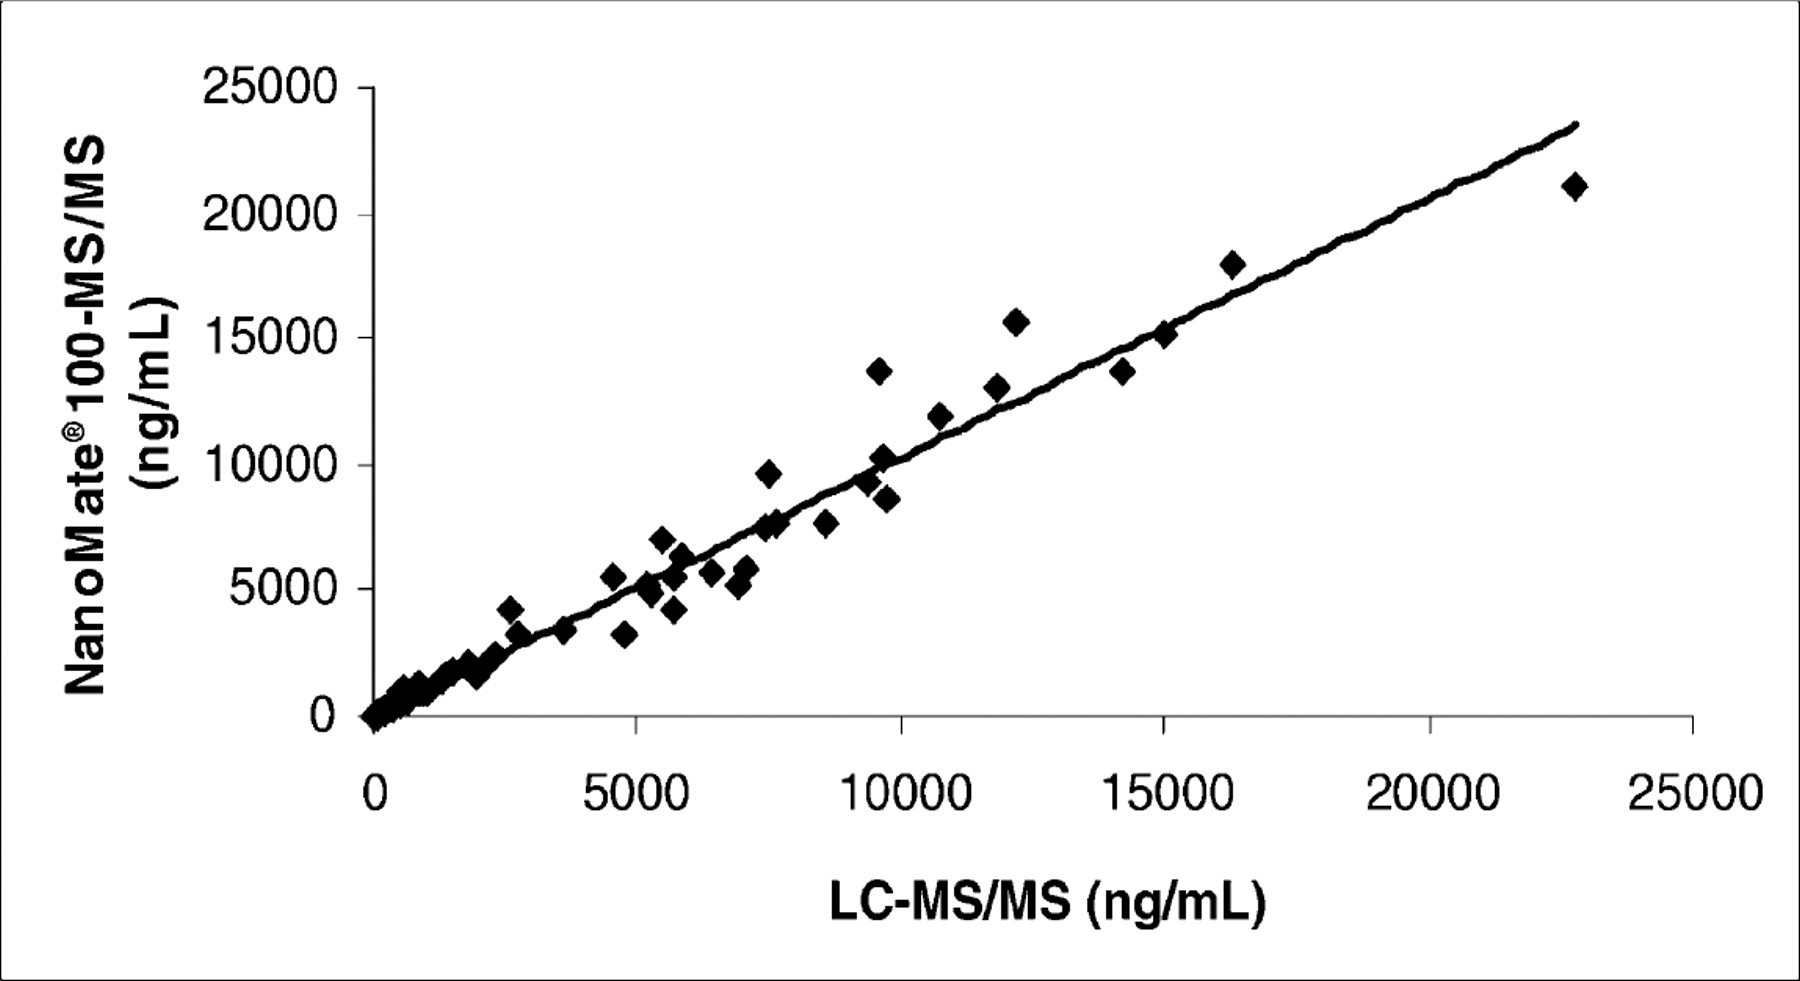
Concentration correlation between data obtained on the LC-ESI-MS/MS and data obtained on the NanoMate® 100-MS/MS. (Slope=1.0299, Intercept=0,
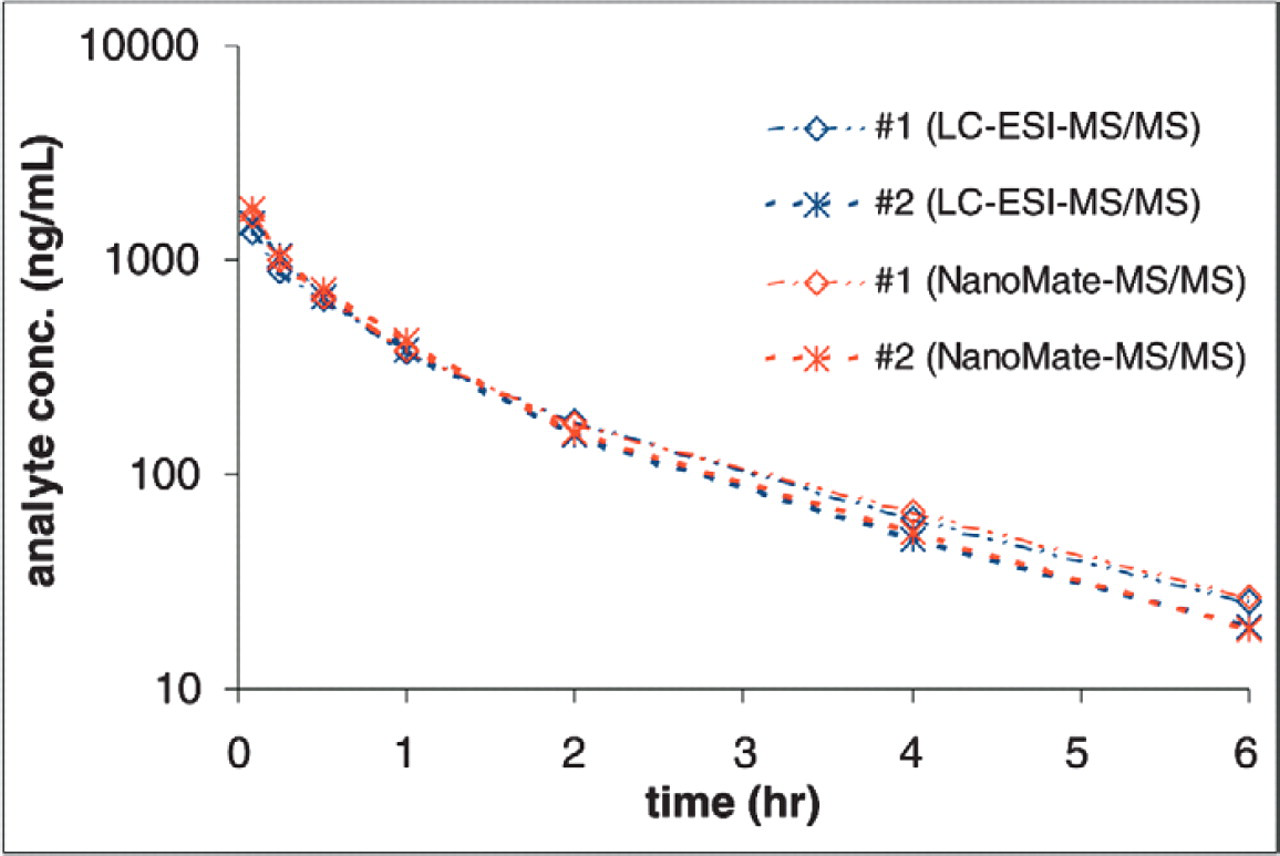
Plasma concentration profiles of Compound E in Sprague-Dawly rats (#1 and #2) after i.v. administration.
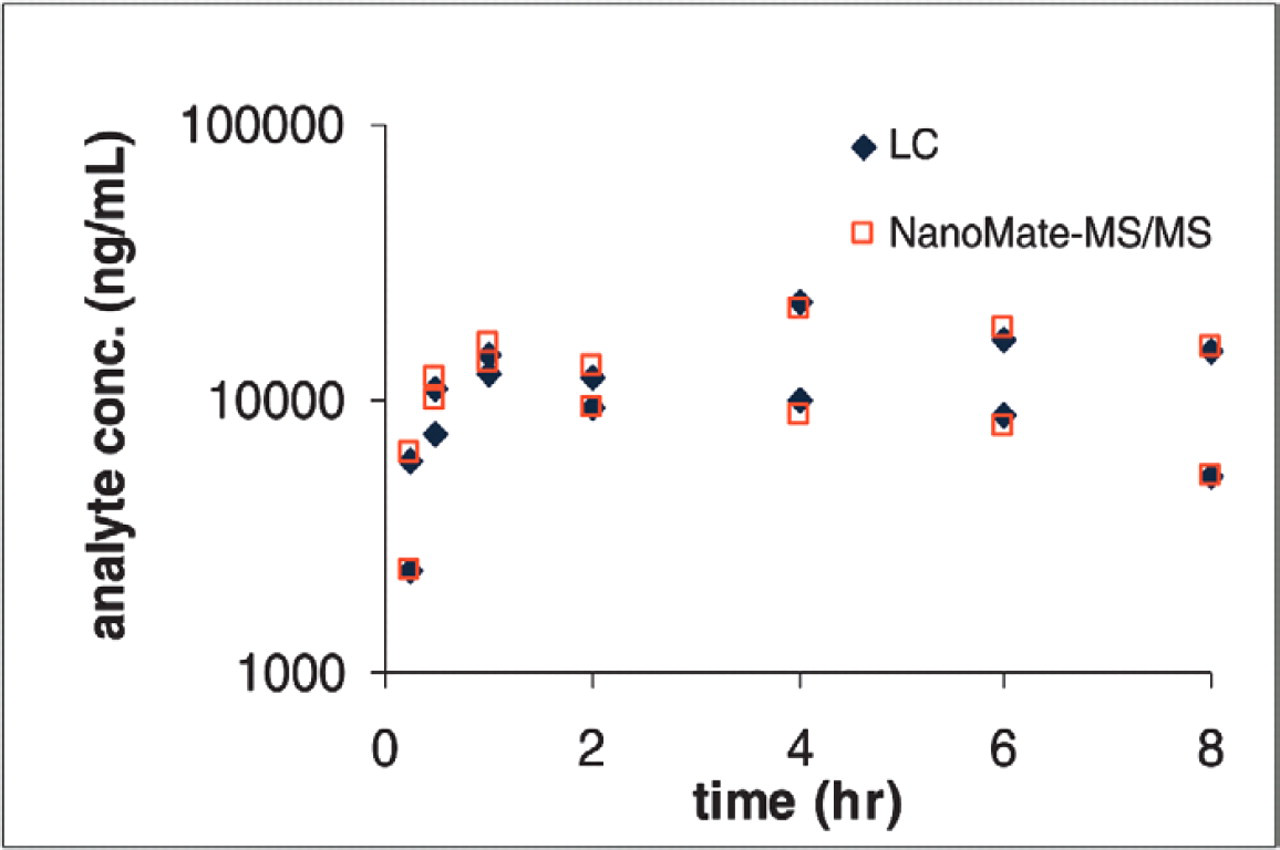
Plasma concentration profiles of Compound D in CD-1 mice after p.o. administration.
Current Limitations and Future Enhancements of the NanoMate® 100
During tuning of Compound B (0.5 μg/mL in 50/50 of ACN/water) on the NanoMate® 100-MS/MS system, gradual deterioration of [M + H]+ signal was observed (panel A in Figure 14) during the 5-minute infusion. When the standard carbonized tip was replaced with the aluminum-coated tip, the signal became stable during the 2.5-minute infusion (panel B in Figure 14). The [M + H]+ signal deterioration in the carbonized tip was attributed to compound oxidation on the tip surface. The aluminum coating prevented the compound from being oxidized, and therefore maintained steady response during tuning. However, this phenomenon has not been observed in plasma extract, and therefore it is not a concern to use standard carbonized tips for plasma extract analysis. The NanoMate® 100 offers improved electrospray ionization efficiency attributed to its stable spray at nL/min flow rate. The NanoMate® 100 typically requires 2–5 μL of sample for analysis, which helps to preserve sample as well as to extend sample analysis time to obtain maximal information on the sample. With the absence of LC pump, external autosampler, solvent waste containers, and other peripherals associated with LC and sample introduction, a NanoMate® 100-MS/MS system takes approximately half of the space a conventional LC-MS/MS system would normally require. Currently, prior to introduction to the NanoMate® 100, biological samples need to be extracted via solid phase extraction (SPE) or ZipTip® in order to obtain clean extracts with reasonably low matrix effect. 5 This requires additional method development on SPE or ZipTip® extraction procedure as well as added sample preparation time and effort. The current version of NanoMate® 100 has capacity of analyzing 96 samples without manually exchanging sample plate. The adhesive aluminum plate mat is not resealable, and it is crucial to apply a new mat to the sample plate promptly in order to prevent solvent evaporation and to enable re-analysis in the future. The adhesive material adds concerns on possible reaction with the high organic content in sample extract, especially when samples are stored long-term. In the near future, the next version of NanoMate® will have a quadrupled sample capacity (i.e., one 384-well plate). In addition, an “E-Tip” version of NanoMate® will enable on-line ZipPlate® extraction with 5–10 fold added concentrating power. Last, the manufacture of NanoMate® expects to integrate the currently stand-alone ChipSoft® software into major mass spectrometer software such as Analyst® and Xcalibur® in the future.
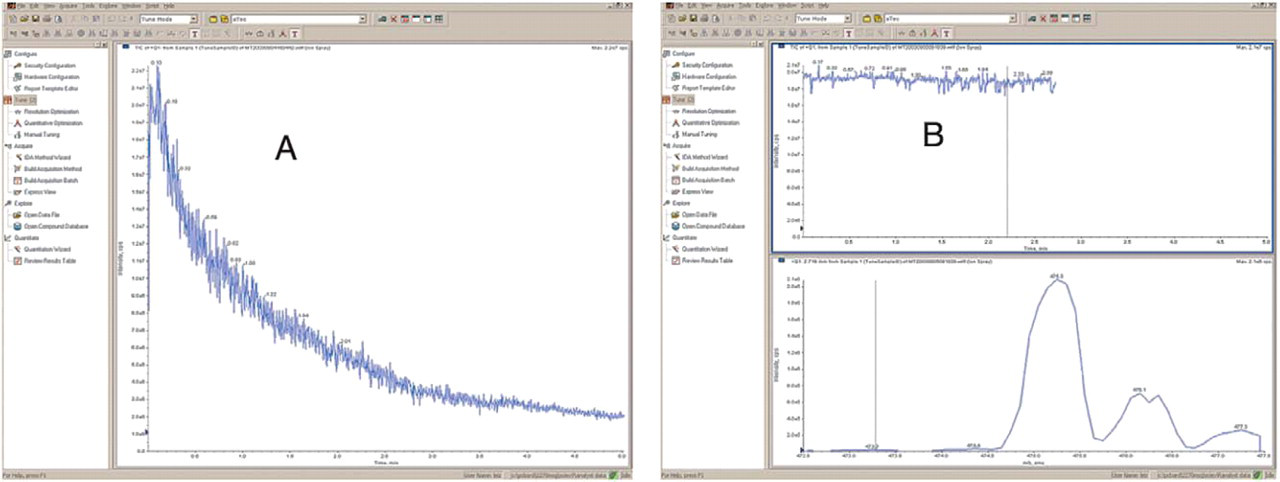
Compound B (0.5 μg/mL in 50/50 ACN/H2O) signal profile ([M + H]+) during tuning on the NanoMate® 100-MS/MS system. (A: carbonized tip; B: aluminum-coated tip).
Conclusions
The chip-based nanoESI instrument, NanoMate® 100, has been evaluated and compared with the conventional LC-ESI-MS/MS on applications such as small molecule quantitation in biological matrices. The NanoMate® 100 offers nano-electrospray ionization in a fully automated fashion with advantages such as minimal cross contamination, minimal sample consumption, and extended sample analysis time. Due to the more-strict sample cleanliness requirement, the NanoMate® 100 is not best suited for subnanogram per milliliter quantitation in discovery mode for exploratory PK screening, which involves multiple compounds and requires rapid turnaround with minimal sample manipulation. However, the NanoMate® 100 has great potential in qualitative work as well as in high-throughput quantitation of compounds at later development stage. In the near future, the NanoMate® 100 applications on metabolite identification as well as quantitation of lead candidate in biological matrices will be evaluated. Also, automated ZipTip® extraction with robotic liquid handler will be investigated to streamline the ZipTip® sample preparation.
Acknowledgments
The authors thank Advion Biosciences Inc. for performing sample analysis on its NanoMate® 100-MS/MS system during the evaluation period. The authors also thank M. Rose and T. Hartmann for their valuable feedback. Last, the authors thank R. Dawson for the help on preparing all the figures.