
Abstract
The article examines causalities between sovereign, most important quasi-sovereign CDS prices (Gazprom, VTB, Sberbank) for Russia and the global volatility factor embedded in the VIX index dynamics. The analysis refers to the post-bailout period in this major emerging economy (May 2009–July 2013). The causalities are assessed in the time (the Hong test) and frequency (the Breitung–Candelon test) domains. The VIX index dynamics has a strong impact on all Russian CDS, but also receives a non-negligible feedback from them. The sovereign and quasi-sovereign CDS prices exhibit a strong causal connectedness in both domains, with the impact of the quasi-sovereigns (in particular, that of banks) getting more pronounced in the longer run, i.e. over longer time horizons and at lower frequencies. High foreign exposure of the quasi-sovereigns, explicit/implicit public guarantees and the holdings of the Russian sovereign debt on their balances underlie the causalities. Given the systemic role that the government-controlled entities play in the Russian economy, this may lead to the “too big to save” effect with negative implications for financial and fiscal stability.
Keywords
Introduction
One of the salient features of the initial phase of the Great Recession was the credit risk transfer between corporate sector and sovereigns. In autumn 2008, when many national governments announced rescue packages for corporate sector (primarily, financial firms), risk spreads of the corporate sector declined while sovereign spreads increased as investors perceived possible negative effects of these bailouts for public debt sustainability.
The credit risk transfer has been well documented in credit default swap (CDS) markets, 1 especially with respect to the EU countries. However, post-bailout linkages between sovereign and corporate credit risk have received less attention, though the nexus between the two remains tight and is often dubbed “deadly embrace” or “doom loop” (Fahri & Tirole, 2014). The repercussions of the “deadly embrace” are primarily studied for advanced economies while little is known about the post-bailout linkages between sovereign and corporate credit risk in case of the major emerging economies that faced the credit risk transfer. The mechanics of the “deadly embrace” in these countries may be different from the advanced countries’ experience due to lower public indebtedness levels and significant public stakes in systemically important financial and non financial firms.
See Augustin, Subrahmanaym, Tang, and Wang (2014a) for a comprehensive review of recent trends in corporate and sovereign CDS markets.
The paper attempts to partly fill in this gap by examining causal linkages between sovereign and major corporate CDS series (Gazprom, Sberbank and VTB) for Russia from May 2009 to July 2013. It also studies causality between the Russian CDS series and the global volatility factor embedded in the VIX index dynamics. The peculiar feature of such research for Russia is that the mentioned entities are government-controlled. Therefore, the focus is actually on the causality between global volatility, sovereign and quasi-sovereign credit risk. This analysis also appears important as it sheds light on causal linkages between the sovereign and major corporate CDS shortly before the imposition of sanctions. The baseline analysis makes a distinction between two types of causality – causality-in-mean and causality-variance.
The paper uncovers two notable findings. First, global volatility contributes significantly to the Russian CDS prices, both sovereign and quasi-sovereign. This impact is particularly pronounced with respect to causality-in-mean. The causality-in-variance tests reveal a moderate yet statistically significant feedback in the opposite direction – from the sovereign and bank CDS prices to the VIX index. Second, similar to the Eurozone experience, the article provides evidence for causality-in-mean running from the sovereign CDS prices to the bank ones after the Russian government interventions to bail out the financial sector in late 2008 while bi-directional linkages are found regarding causality-in-variance.
Bi-directional linkages between the sovereign and bank CDS prices are confirmed when causal relations are investigated in the frequency rather than time domain by means of the Breitung and Candelon (2006) test. High foreign exposure of the quasi-sovereigns, explicit/implicit public guarantees and the holdings of the Russian sovereign debt on their balances underlie the causal connectedness. In view of the systemic role that the government-controlled entities play in the Russian economy this may lead to the “too big to save” phenomenon with negative implications for financial and fiscal stability.
The remainder of the paper is organized as follows. Section 2 reviews relevant literature, Section 3 presents the data, Section 4 describes econometric methodology. Section 5 discusses the results, Section 6 presents the robustness checks and Section 7 concludes.
The empirical literature on the credit risk transfer observed in CDS markets during the Great Recession hinges around two initial contributions by Acharya, Drechsler, and Schnabl (2014) and Ejsing and Lemke (2011). They provide evidence for the credit risk transfer and subsequent two-way feedback between financial and sovereign credit risk using data on CDS series of the Eurozone countries in 2007–2010 and 2008–2009 respectively.
In line with these studies, Stanga (2011) discovers only a temporary post-bailout drop in the credit risk of Spanish and Irish banks, pointing to a co-movement between bank and sovereign CDS spread dynamics. Alter and Schuler (2012) also focus on Eurozone countries and characterize the pattern of post-bailout sovereign and financial sector CDS price co-movement. They conclude that after the government interventions changes in the sovereign CDS spreads contribute permanently to financial sector CDS spreads, while changes in banks’ default risks affect the sovereign CDS spreads transitorily. They have a strong impact in the very short run (up to 2 days) but this effect becomes insignificant in the long run (up to 3 weeks) with the exception of Italy, Spain and Portugal. Mody and Sandri (2012) track the developments that made sovereign and bank credit risks intertwined and conclude that the outbreak of the Greek crisis in 2010 was as important in strengthening this co-movement as the collapse of Lehman Brothers in September 2008. Similar evidence is provided by Alter and Beyer (2014) who quantify spillovers between bank and sovereign CDS spreads for the Eurozone from October 2009 to July 2012 and compute a special contagion index, showing that the interdependencies between banks and sovereigns had been on the rise throughout the period, though the negative impact of PIIGS began to diminish after the implementation of IMF/EU stabilization programs.
Avino and Cotter (2014) find that sovereign and bank CDS spreads in 6 major EU economies are cointegrated variables at the country level. They also conclude that sovereign CDS play a pivotal role for the price discovery of bank CDS in the most distressed economies (Portugal, Spain) while more resilient economies (Germany, Sweden) show a leading role for the bank CDS. Gross and Kok (2013), Corzo Santamaría, Gómez Biscarri, and Lazcano Benito (2014), López Pascual and Lovreta (2014) provide evidence that the credit risk transmission from the sovereigns to banks has been more pronounced since the outbreak of the European debt crisis than the transmission running in the opposite direction. In line with this evidence, Beckenfelder and Schwaab (2015) assert that by late 2014 there was already no credit risk transmission from banks to respective sovereigns in stressed EU countries. They also find a significant cross-border component in the bank–sovereign nexus as non-stressed economies did bear the risk by providing guarantees to banks in the stressed ones.
De Bruyckere, Gerhardt, Schepens, and Vander Vennet (2013) identify three channels of the “deadly embrace” – public guarantees, asset holdings and collateral channel. Kallestrup, Lando, and Murgoci (2013) confirm the significance of explicit and implicit government guarantees extended to an EU country's banking system as a channel of contagion between sovereign and bank CDS and add an increased foreign exposure of banks to the list of the contagion channels. Bedendo and Colla (2015) find that government guarantees is an important transmission mechanism between sovereign and corporate credit risk in case of non-financial corporate CDS spreads.
Bai and Wei (2012) study the strength of the credit risk transfer from the sovereigns to the private sector for government and corporate CDS series from 30 countries in January 2008–February 2010 and find that on the average a 100 basis points increase in the sovereign CDS spreads results in an increase in corporate CDS spreads by 71 basis points. Interestingly, in light of this research they also assert that this relationship is stronger for government-controlled companies. Bedendo and Colla (2015) arrive at similar findings regarding the adverse role of public ownership. Nevertheless, it may be mitigated by strong property rights that prevent the state facing the risk of debt default from expropriating the private sector. In addition to this argument explaining the intimate interrelation between sovereign and corporate credit risk, a high share of sovereign debt on bank balance sheets contributes to these feedback effects as banks see sovereign bonds appealing as they can be easily used as collateral in interbank markets and central bank emergency lending during hard times. It is discussed, for example, in Merler and Pisani-Ferri (2012).
However, neither of the papers explicitly tackles the problem of causality between sovereign and corporate credit risk in the post-bailouts period. 2 The paper which directly addresses the issue and is the closest in methodology to our research is Tamakoshi and Hamori (2013) who examine causal linkages between Greek CDS spreads and the Eurozone banking CDS index before the crisis (from January 2008 to November 2009) and after its start (from December 2009 to December 2011). Their analysis is based on cross-correlation function techniques that disentangle causality-in-mean and causality-in-variance. It reveals a strong unidirectional causality-in-mean and causality-in-variance from the Eurozone banks to Greek sovereign debt before the crisis and vice versa in regard to causality-in-variance from December 2009 to December 2011. The present research also has something in common with Tamakoshi and Hamori (2014b) who investigate the causal interrelations among CDS indices of the US banking, financial services and insurance sectors based on the same methodology and find that the financial services sector, being the least regulated, constitutes an important transmission mechanism of credit risk across all the sectors.
To be more precise, papers that would rely on (no) causality tests are meant. There are papers that assess the dependence between sovereign and corporate credit risk in a quasi-experimental setting, allowing for causal inference. For example, Augustin, Boustanifar, Breckenfelder, and Schnitzler (2014b) show that after the Greek bailout a one percent increase in sovereign credit risk raised corporate borrowing costs by 0.1 percent. Prior to the event, this relation was insignificant.
Daily 5-year sovereign and corporate CDS prices are used to conduct the research. Gazprom, Sberbank and VTB CDS series are the most liquid among Russian corporate credit default swaps and correspond to the companies that play a crucial role in the Russian economy. 3 The data are sourced from CMAvision, an authoritative international database on credit risk, and contain 1095 observations from May 2009 to July 2013, 4 thereby encompassing the post-bailout period in the Russian economy. 5 The VIX index daily dynamics retrieved from Chicago Board Options Exchange (CBOE) is used to estimate the causal linkage of Russian sovereign and quasi-sovereign credit risks with a measure of global volatility. The higher the VIX index, the more volatile international financial markets are expected to be in the nearest future. This measure of global volatility is reported to be an important fear gauge not only for advanced economies but for the BRICS as well. Moreover, it appears to have forward looking properties in these markets (Sarwar, 2012).
Gazprom is the biggest corporate (quasi-sovereign) entity in the Russian economy by assets, while Sberbank and VTB are the most important banks which are also state-controlled. There are nearly 70 companies in Russia which have launched Eurobonds that may serve as a reference obligation for CDS issuance. Nevertheless, except for the mentioned companies, these CDS are rarely traded and are highly illiquid.
It seems problematic to model the credit risk transfer itself as the corporate CDS series contain multiple breaks that refer to late 2008–early 2009.
Most of the bailouts in Russia were implemented in September–December 2008. In particular, the state contributed to the recapitalization of systemic banks via subordinate loans, including Sberbank and VTB, and the Bank of Russia launched different programs of their direct refinancing.
All the series display a high degree of co-movement, with correlation ratios ranging from 0.49 (between VIX and Sberbank CDS series) to 0.98 (between Russia and Gazprom) (Fig. 1).
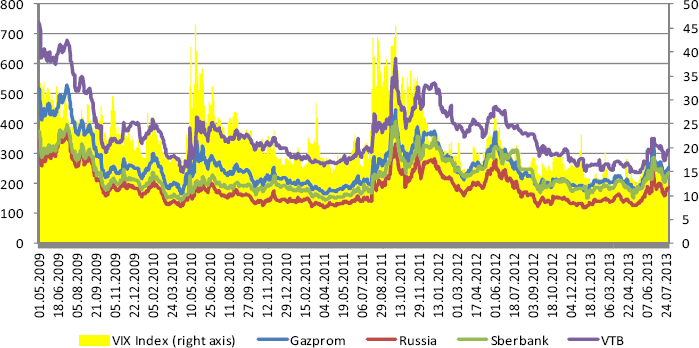
Daily sovereign and quasi-sovereign CDS price dynamics and VIX index, May 2009–July 2013.
The descriptive statistics for all the series are presented in Table 1. The daily mean of CDS price series varies from 184.87 for the sovereign to 367.25 for VTB. The latter also exhibits higher volatility among the series. With the exception of Sberbank, the series show signs of positive skewness and excess kurtosis. The Jarque–Bera test strongly rejects the normality of the CDS price and the VIX index series.
Descriptive statistics.
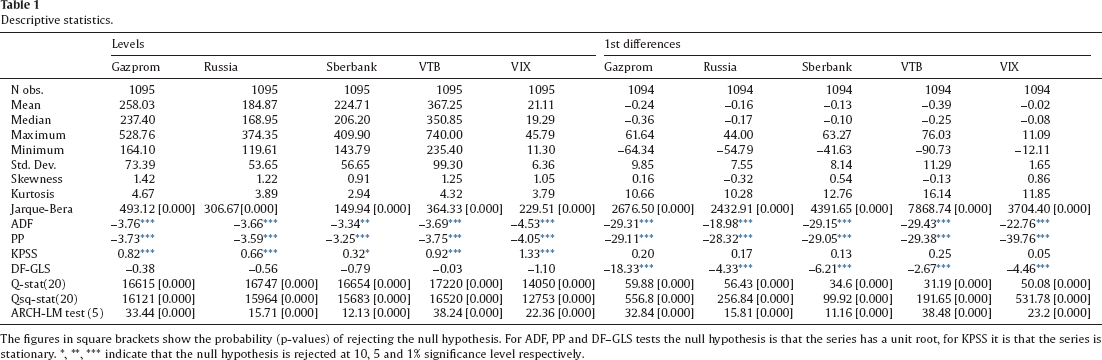
The figures in square brackets show the probability (p-values) of rejecting the null hypothesis. For ADF, PP and DF–GLS tests the null hypothesis is that the series has a unit root, for KPSS it is that the series is stationary. *, **, *** indicate that the null hypothesis is rejected at 10, 5 and 1% significance level respectively.
Standard unit root tests (Augmented Dickey–Fuller test (ADF) and Phillips–Perron test (PP)) suggest that the series are stationary, which is not corroborated by Kwiatkowski–Phillips–Schmidt–Shin (KPSS) test and Dickey–Fuller–GLS (DF–GLS) test that have more power in comparison with ADF and PP tests. To ensure stationarity of the series they are first-differenced. The baseline and first-differenced series and their squares (both levels and 1st differences) exhibit serial correlation (up to 20 lags) and ARCH effects (up to 5 lags) judging by Ljung–Box Q-statistic and LM conditional variance test.
The two-stage cross-correlation function (CCF) approach proposed by Cheung and Ng (1996) and modified by Hong (2001) is used. It has become widespread in analyzing causality between stock market returns (Korkmaz, Cevik, & Atukeren, 2012; Xu & Hamori, 2012), sovereign bond yields (Tamakoshi, 2011) and different segments of the financial sector (Tamakoshi & Hamori, 2014a).
At the first stage GARCH models should be fitted to univariate series in question. Usually Autoregressive, Generalized Autoregressive Conditional Heterodoskedasticity (AR–GARCH) or Autoregressive, Exponential Generalized Autoregressive Conditional Heterodoskedasticity (AR–EGARCH) specifications are considered. Autoregressive-moving-average (ARMA) models for mean equations are also possible.
At the second stage special statistics to study causality-in-mean and causality-in-variance are computed on the basis of standardized residuals and squared standardized residuals derived from the fitted AR/ARMA–GARCH model. The standardized residuals 


The shortcoming of this S-statistic is that each lag is weighted uniformly, making no difference between recent and distant cross-correlations. It is inconsistent with an intuitive expectation that more recent information should play a primary role, with cross-correlations decreasing to 0 as the lag order increases. Hong (2001) proposed a new Q-statistic to overcome this weakness of the S-statistic. The Q-statistics to test causality-in-mean and causality-in-variance are given as follows:


Q-statistic is designed to test one-sided causality; upper-tailed standard normal distribution critical values must be used. If the Q-statistic is larger than the critical value of the normal distribution, the null hypothesis of no causality during the first
According to the CCF approach, at the first stage adequate GARCH models have been fitted to the first-differenced CDS price series and VIX index. For all the variables ARMA(k,m)–GARCH(p,q) models have been selected. The general specification is represented as follows:


Generalized error distribution (GED) is assumed in our specification.
Empirical results of ARMA(k,m)–GARCH(1,1) models.
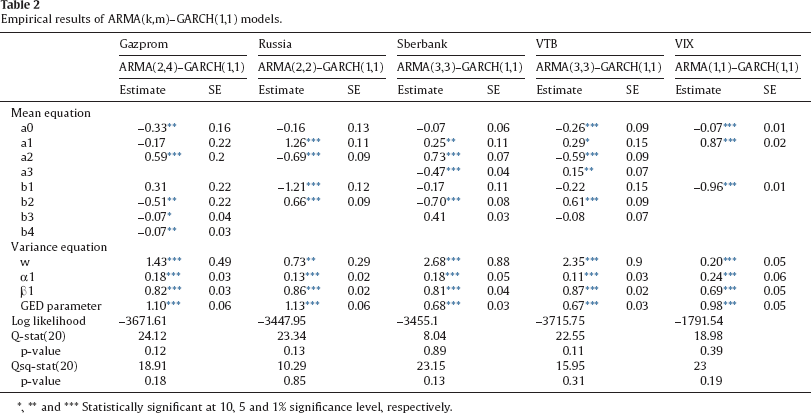
, ** and *** Statistically significant at 10, 5 and 1% significance level, respectively.
ARMA(k, m)–EGARCH(1,1) specifications that account for a possible asymmetry in volatility dynamics have also been considered but they do not outperform standard GARCH (1,1) by their statistical quality, namely, by the values of maximum likelihood estimators of the equations and Schwartz Bayesian information criterion (SBIC).
All ARCH (
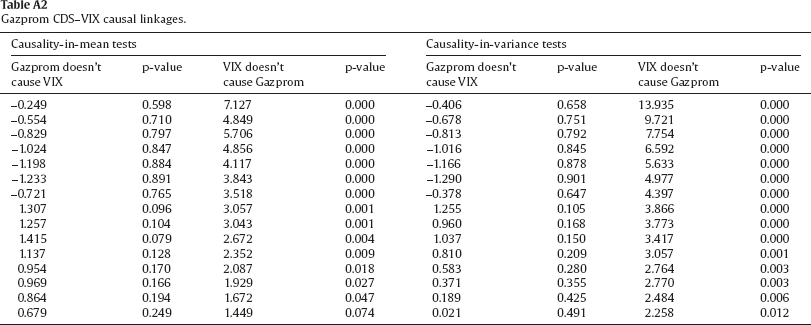
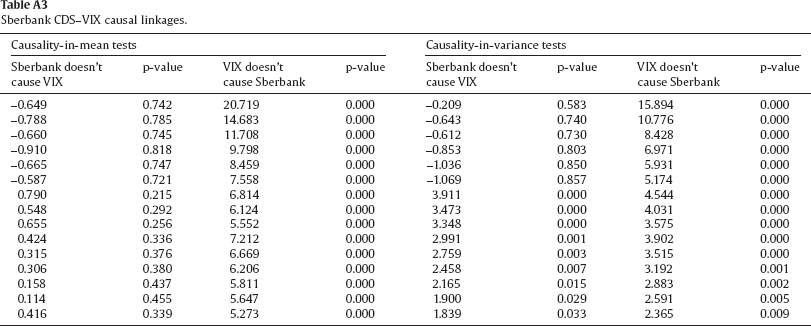
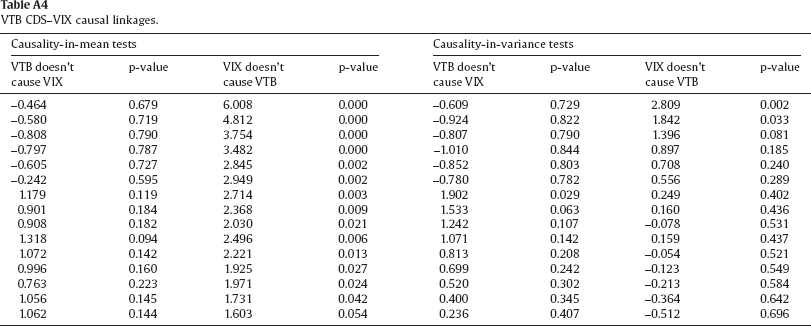
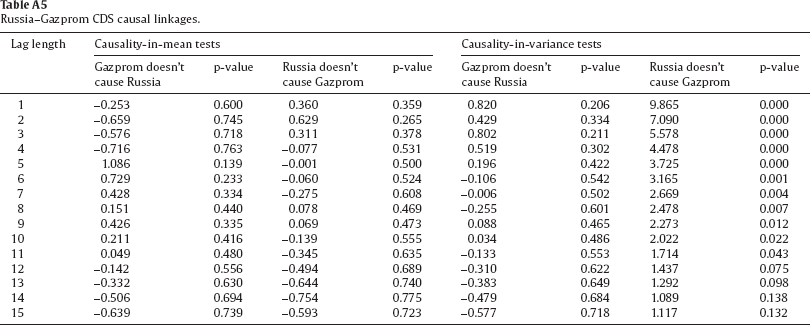
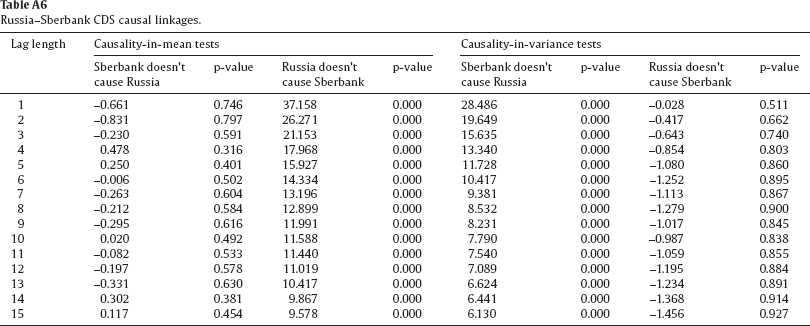
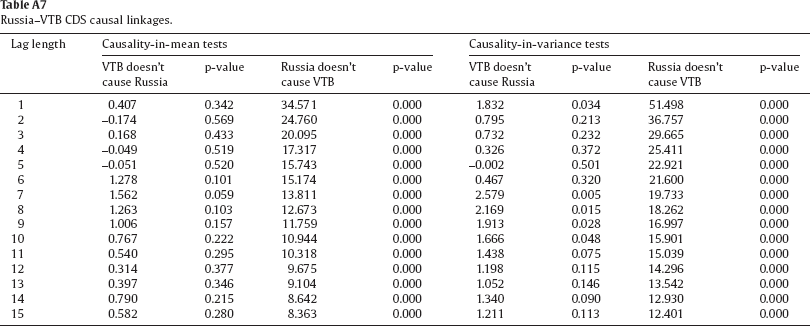
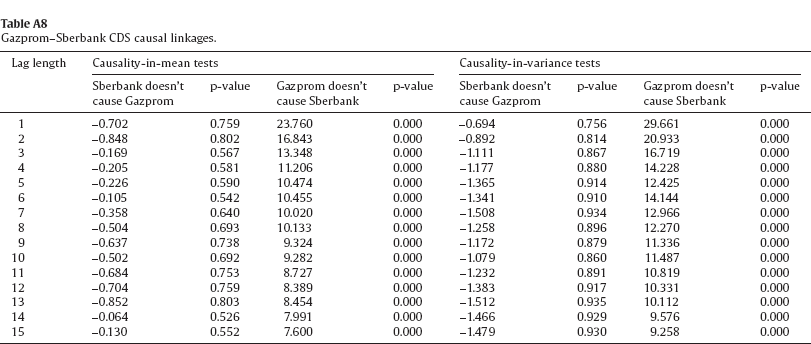
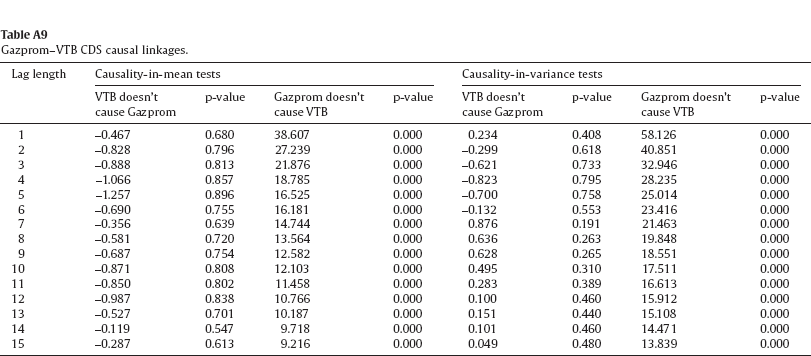
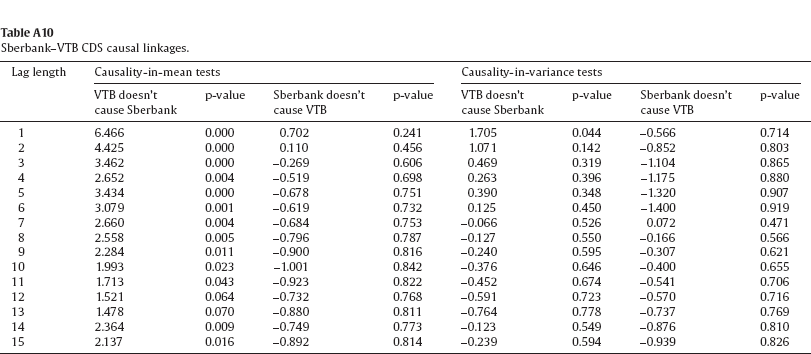
Appendix reports empirical results of the CCF analysis to test for the null hypothesis of no causality up to lag
Causality-in-mean between Gazprom, Russia, Sberbank, VTB CDS prices and VIX index, daily data, May 2009–July 2013.
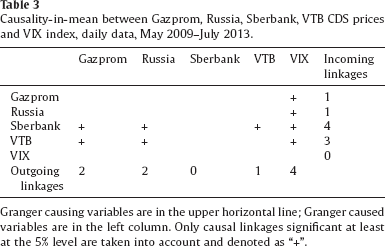
Granger causing variables are in the upper horizontal line; Granger caused variables are in the left column. Only causal linkages significant at least at the 5% level are taken into account and denoted as “+”.
Causality-in-variance between Gazprom, Russia, Sberbank, VTB CDS prices and VIX index, daily data, May 2009–July 2013.
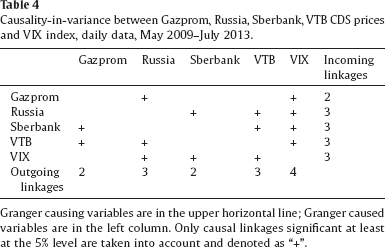
Granger causing variables are in the upper horizontal line; Granger caused variables are in the left column. Only causal linkages significant at least at the 5% level are taken into account and denoted as “+”.
The intensity of linkages between Russian sovereign and quasi-sovereign CDS prices in regard to causality-in-mean is not very high (only 5 out of 16 possible causal linkages), which is an unexpected finding, taking high pairwise correlations between the series into account. Thus, these high correlations should be attributed to the VIX index dynamics, a third factor driving means of Russian sovereign and quasi-sovereign CDS prices. The VIX index has the highest number of outgoing causal linkages as it influences all the Russian CDS series and its impact with respect to causality-in-mean is unidirectional. The result is consistent with the findings by Longstaff, Pan, Pedersen, and Singleton (2011) who conducted a comprehensive study of sovereign risk determinants and concluded that CDS spreads are more related to global factors such as the US stock market and the volatility risk premium embedded in the VIX index. The impact of global volatility on sovereign and corporate CDS spreads of developing and emerging economies is also corroborated by several studies at national and regional levels (Eyssell, Fung, & Zhang, 2013; Fender, Hayo, & Neuenkirch, 2012; Wang, Yang, & Yang, 2013). Among the Russian CDS series the sovereign CDS prices Granger cause Sberbank and VTB CDS series without any feedback effects. The result meshes well with the described post-bailouts pattern of CDS price co-movement for the Eurozone countries. However, there are no signs of any causality-in-mean running from quasi-sovereign CDS prices to the sovereign one. Surprisingly, no causality-in-mean is observed between the sovereign and Gazprom CDS. Of the two bank CDS, Sberbank is the most susceptible to incoming causality-in-mean as it is Granger caused by the rest of the CDS without exerting any influence itself.
As for causality-in-variance, the intensity of linkages between Russian sovereign and quasi-sovereign CDS prices appears more significant (10 out of 16 potential connections). The VIX index exerts influence on all the CDS series but also receives feedback from the sovereign, Sberbank and VTB. The causality-in-variance running from the Russian CDS to the VIX index is much weaker than in the opposite direction but statistically significant. Thus, Russian sovereign and quasi-sovereign credit risk contributed to the global volatility during May 2009–July 2013. In case of Sberbank and VTB, the finding is consistent with their multinational status and an extensive exposure to cross-border capital flows. 7 Besides, there is evidence for a feedback from the bank to sovereign CDS prices. Gazprom CDS prices are driven by the sovereign but Granger cause those of Sberbank and VTB. Again, Sberbank has a negative balance of outgoing and incoming causal linkages.
According to the 2013 ranking of Top 1000 by The Banker magazine, Sberbank is ranked 34th among the biggest world banks. It operates in 20 countries including the CIS, CEE and Turkey. VTB occupies 70th position in. It has subsidiaries in more than 20 countries, including the CIS, EU, Asia and Africa.
The significant causal feedback which the sovereign CDS prices receive from the quasi-sovereign CDS is consistent with the data on open positions in this market. The cumulative net notional position 8 of the quasi-sovereign CDS (Gazprom, Sberbank, VTB) is comparable or at some instants exceeds that of the sovereign CDS in May 2009–July 2013 (Table 5).
Net notional open positions on Gazprom, Russia, Sberbank, VTB CDS, bln US dollars, May 2009–July 2013.
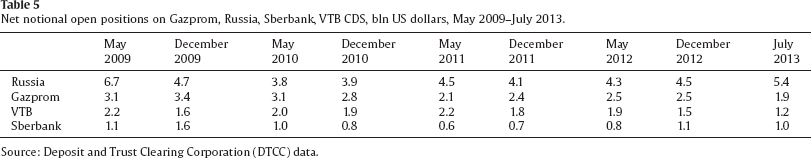
Source: Deposit and Trust Clearing Corporation (DTCC) data.
Net notional positions in the CDS market are proxies for the maximum possible net funds transfers between sellers and buyers of CDS contracts that could be required upon the occurrence of a credit event. Thus, this indicator is instrumental in assessing “tangible” risk that CDS contracts incur.
By comparing the net notional to gross notional positions (Table 6) one can also conclude that Russia and Gazprom CDS bear a significantly lower risk than the bank CDS and among the banks VTB CDS tends to be riskier than Sberbank. These facts enable to hypothesize that the bank CDS may have had an important potential for the price discovery of the sovereign CDS as it was found in case of the resilient EU economies by Avino and Cotter (2014). However, this hypothesis is left for future research.
Net notional to gross notional open positions ratio for Gazprom, Russia, Sberbank, VTB CDS, %, May 2009–July 2013.
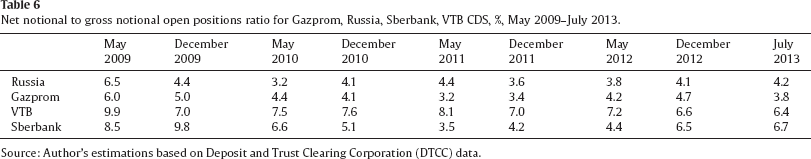
Source: Author's estimations based on Deposit and Trust Clearing Corporation (DTCC) data.
Overall, there is a tight causal connectedness between the sovereign and quasi-sovereign CDS prices. The impact of the quasi-sovereign CDS, in particular, those of banks, on the sovereign is channeled via increased foreign exposure. It is noteworthy that banks have an enormous share of the total international debt of the Russian Federation, with government-controlled entities playing the primary role. This indicator was 31.5% as of June 2009 and 29.9% in June 2013, showing no deleveraging by the banking sector in light of the total debt increase from 466 to 708 bln US dollars during this period. This results in massive contingent liabilities for the Russian government which will materialize in case of external shocks to the banking sector. These shocks need not be purely economic but may also be driven by political issues such as the sanctions on the state-affiliated banks imposed in 2014. Non-financial state-affiliated companies are in the same situation.
Meanwhile, the systemic role of Gazprom, VTB and Sberbank in the domestic market strengthened over 2009–2013 (Fig. 2) and the “too big to save” effect is likely to emerge as a result. This effect is definitely not immediate and can gradually emanate from the “too big-to fail” phenomenon aggravated by deteriorating fiscal balance of a country. 9 The link between the two effects is discussed by Barth and Schnabel (2013) and Demirguc-Kunt and Huizinga (2013).
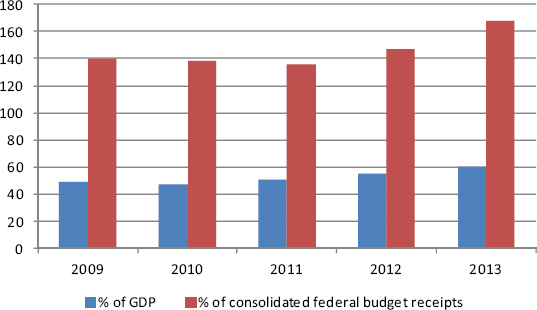
Total assets of Gazprom, VTB and Sberbank to GDP and consolidated federal budget receipts, %, 2009–2013.
By now the fiscal balance of Russia has generally remained sustainable. However, in the longer run there are at least two concerns identified by domestic and international experts – the above mentioned contingent liabilities and burdensome increases in health and pension spending. See, for example, IMF (2014).
The burdensome contingent liabilities and the overwhelming shares of the government-controlled companies reduce the likelihood of efficient bail-ins of these entities in case of another financial turmoil while the shift from bailouts to bail-ins is one of the main trends in financial supervision and regulation after the 2007–2009 global crisis. In this context, it is no surprise that state-owned companies and banks requested the Russian government for another wave of re-capitalization in late 2014. Of the three entities in question, VTB Group was the first to solicit the bailout up to 5 bln US dollars.
Another channel through which the “deadly embrace” may work in Russia is the sovereign-corporate credit rating link. There is empirical evidence that sovereign credit rating downgrades have a strong adverse impact on the bank ratings in advanced economies and emerging markets (Adelino & Ferreira, 2014; Alsakka, ap Gwilym, & Nhung Vu, 2014; Huang & Shen, 2015; Williams, Alsakka, & ap Gwilym, 2013). Interestingly, Aktug, Nayar, and Vasconcellos (2013) also find an inverse relation between sovereign credit ratings and national bank concentration ratios. Cantero-Saiz, Sanfilippo-Azofra, Torre-Olmo, and López-Gutiérrez (2014) find that increased sovereign risk significantly curbs loan supply under tight monetary policy regimes. Since the sanctions were imposed, the downgrades have occurred indeed, further barring the banks from access to international capital markets.
Sizeable sovereign bond holdings by the banking sector may exacerbate this effect as indicated by De Marco (2013), Popov and van Horen (2013), Albertazzi, Ropele, and Sene (2014), Gennaioli, Martin, and Rossi (2014). Higher sovereign risk leads to value losses on banks’ holdings of sovereign debt, thus impairing their balance sheets and entailing a limited access to wholesale funding. It may eventually offset the cushioning effect of explicit and implicit government guarantees (Schich & Lindh, 2012). While VTB Group held a negligible share of its assets (0–0.3%) in the national sovereign bonds in 2009–2013, sovereign debt holdings totaled a significant share of Sberbank assets (up to 8%). Moreover, Sberbank appears to be the key market maker, accounting for up to 70% of total sovereign debt holdings by the Russian banking sector (Fig. 3).
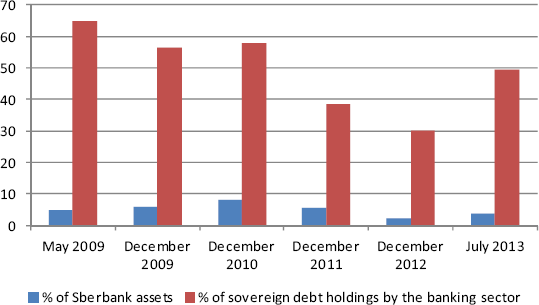
Sovereign debt holdings by Sberbank, %, 2009–2013.
Therefore, the credit risk of the Russian banking sector and non-financial firms is likely to rise along with an increase in the sovereign risk. 10 This is a manifestation of the causal connectedness between the sovereign and quasi-sovereign CDS prices that has been uncovered in the paper. It may involve negative repercussions for financial and fiscal stability given the geopolitical challenges that Russia is facing.
Though there has been evidence that corporate CDS prices may be lower than those of the corresponding sovereign (Lee, Naranjo, & Sirmans, 2013), the Russian quasi-sovereign CDS prices were strictly above the sovereign benchmark over 2009–2013.
Two robustness checks are conducted to verify the validity of the findings presented above. First, the CCF approach is implemented on weekly data. It is legitimized by the fact that when tested on daily data, there are contemporaneous information flows between the variables that may create “noise” and even mask robust causal linkages. The econometric methodology to conduct Granger causality tests on weekly data is the same as described in Section 4. The results are presented in Tables 7 and 8. 11
A detailed econometric output underlying the causality tests is not included for brevity but available from the author upon request.
Causality-in-mean between Gazprom, Russia, Sberbank, VTB CDS prices and VIX index, weekly data, May 2009–July 2013.
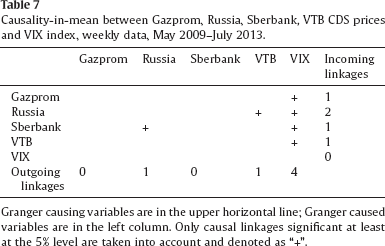
Granger causing variables are in the upper horizontal line; Granger caused variables are in the left column. Only causal linkages significant at least at the 5% level are taken into account and denoted as “+”.
Causality-in-variance between Gazprom, Russia, Sberbank, VTB CDS prices and VIX index, weekly data, May 2009–July 2013.
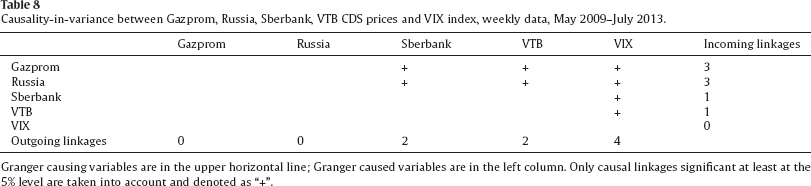
Granger causing variables are in the upper horizontal line; Granger caused variables are in the left column. Only causal linkages significant at least at the 5% level are taken into account and denoted as “+”.
The number of causal linkages revealed on weekly data is significantly lower than on daily data regarding both causality-in-mean and causality-in-variance. Global volatility embedded in the VIX index has retained its pivotal role for the sovereign and quasi-sovereign Russian CDS series. Besides, on weekly data the impact of bank CDS (Sberbank and VTB) on the sovereign becomes more tangible, in particular, with respect to causality-in-variance.
The second robustness check is based on the Breitung and Candelon (2006) test for causality in the frequency domain. This test is motivated by the fact that causality may vary not only along the time scale but also over different frequencies. For example, causal linkages that are present over 2 or 3-day long intervals may then disappear at lower frequencies, e.g. over 7-day long intervals. To gauge the frequency dimension of causality, Breitung and Candelon (2006) proposed a specific test of (no) causality at a given frequency
The causality test in the frequency domain involves estimating bivariate VAR models and Fourier transform of the data. Though this test does not distinguish between causality-in-mean and causality-in-variance, it has two attractive properties which make it a plausible extension to the CCF approach which is at the heart of this paper. First, it allows the identification of causality even if the true interdependence between the two variables is non-linear; second, the Breiting–Candelon test is valid in terms of volatility clusters. In addition to these general advantages of testing for causal linkages in the frequency domain, the implementation of this test is legitimized by the fact that the null hypothesis in the Hong test cannot be tested at all possible lags. Thus, the null hypothesis of no causality is accepted if it holds at all the lags under examination (p-value > 0.05 at all the lags from 1 to N, where N normally is between 1 and 15). This cannot exclude the situation that the null may be violated at a more distant lag length.
Below the results of the Breitung–Candelon test conducted on daily and weekly data are presented (Tables 9 and 10). 12
For theoretical basis and technical details of the test see the original Breitung and Candelon paper (2006). The corresponding GRETL routines are available upon request from the author but only final results are presented here for brevity.
Causality in the frequency domain between Gazprom, Russia, Sberbank, VTB CDS prices and VIX index, daily data, May 2009–July 2013.
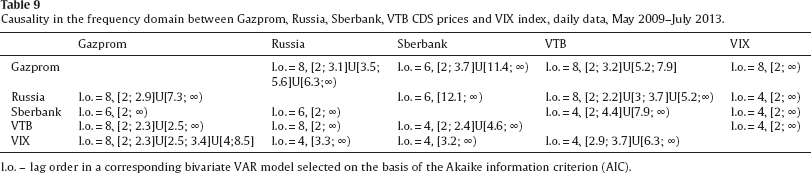
l.o. – lag order in a corresponding bivariate VAR model selected on the basis of the Akaike information criterion (AIC).
Causality in the frequency domain between Gazprom, Russia, Sberbank, VTB CDS prices and VIX index, weekly data, May 2009–July 2013.
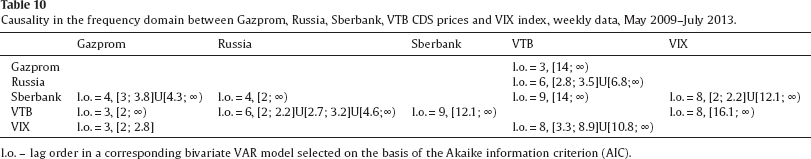
l.o. – lag order in a corresponding bivariate VAR model selected on the basis of the Akaike information criterion (AIC).
As for daily data, the Breitung–Candelon test shows a high degree of mutual dependence of all the CDS series and the VIX index. The sovereign and bank CDS are characterized by bi-directional causality almost across all the frequency bands. The VIX index dynamics also appears to be sensitive to the major Russian CDS prices and only in the case of Gazprom CDS this impact is confined to very high frequencies (over 2–8.5 day horizons). The sovereign and bank CDS prices exert influence over the VIX index at high and lower frequencies.
There are fewer causal linkages using weekly data. However, at these lower frequencies causality between the sovereign and bank CDS prices also holds. The sovereign CDS prices Granger cause Sberbank and VTB CDS series, receiving a strong feedback from VTB. The linkages between the VIX index, the sovereign and Gazprom CDS have disappeared but they are mediated by the bank CDS prices, especially by those of VTB which Granger causes and is Granger caused by the rest of the series. Thus, at lower frequencies the sovereign Russian CDS becomes indirectly vulnerable to global volatility dynamics embedded in the VIX index as the volatility is transmitted via the credit risk of the major state-affiliated banks.
In a nutshell, the robustness checks generally corroborate the findings based on the CCF approach. The sovereign and quasi-sovereign CDS series are highly sensitive to the global volatility factor, though, to a certain extent, they produce a feedback. There is also a significant causal co-movement between the sovereign and bank CDS prices, with VTB (not Sberbank) playing the most important role among the quasi-sovereign CDS.
Using the robust CCF approach the article has studied causal linkages between sovereign, most important quasi-sovereign CDS prices for Russia and the global volatility factor embedded in the VIX index dynamics. The analysis refers to the post-bailouts period in Russia and distinguishes between causality-in-mean and causality-in-variance.
Two major findings are documented. First, global volatility contributes significantly to the Russian CDS prices, both sovereign and quasi-sovereign. This impact is particularly pronounced with respect to causality-in-mean. The causality-in-variance tests point to a moderate yet statistically significant feedback in the opposite direction – from the sovereign and bank CDS prices to the VIX index. Second, similar to the Eurozone experience, the article provides evidence for causality-in-mean running from the sovereign CDS prices to the bank ones after the Russian government interventions to bail out the financial sector in late 2008 while bi-directional linkages are found with regard to causality-in-variance. The overall intensity of linkages between the series is significant for causality-in-variance which aggravates the risk of volatility spillovers and their amplification.
The robustness checks based on weekly data and the Breitung–Candelon test for causality in the frequency domain confirm these findings. High foreign exposure of the quasi-sovereigns, public guarantees and the holdings of the Russian sovereign debt on their balances underlie the causalities. Given the systemic role that the government-controlled entities play in the Russian economy this may lead to the “too big to save” effect. Overall, the quantitative analysis helps understand the effects that undermine financial and fiscal sustainability of the Russian economy while the latter is facing a tough period of sanctions.
The policy implications of the paper are two-fold. First, the results matter for policymakers who are keen to monitor credit risk associated with the most important Russian CDS and better understand potential channels of contagion in this volatile and insufficiently regulated market. In this regard, the findings of the paper emphasize the perils of the potential “too big to save” effect for the Russian economy and hint at the advantage of downsizing the major government-controlled entities via gradual privatization to counter this effect. Second, the research is marked by special value added in light of the recent Russian government initiative to develop a domestic CDS market. At a more applied level, the participants of the CDS market may also find the results useful to improve their trading strategies.
Footnotes
Appendix
Russia CDS–VIX causal linkages. Gazprom CDS–VIX causal linkages. Sberbank CDS–VIX causal linkages. VTB CDS–VIX causal linkages. Russia–Gazprom CDS causal linkages. Russia–Sberbank CDS causal linkages. Russia–VTB CDS causal linkages. Gazprom–Sberbank CDS causal linkages. Gazprom–VTB CDS causal linkages. Sberbank–VTB CDS causal linkages.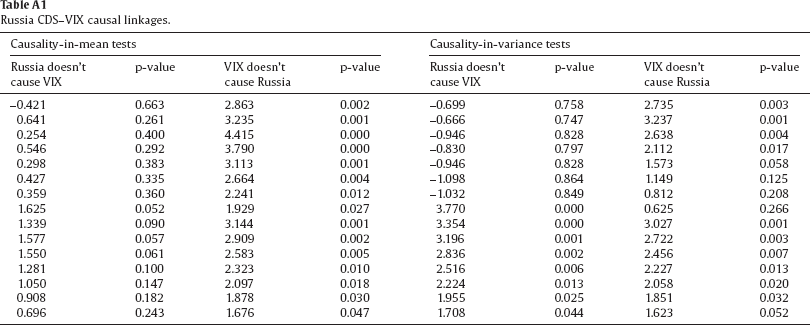
Causality-in-mean tests
Causality-in-variance tests
Russia doesn't cause VIX
p-value
VIX doesn't cause Russia
p-value
Russia doesn't cause VIX
p-value
VIX doesn't cause Russia
p-value
−0.421
0.663
2.863
0.002
−0.699
0.758
2.735
0.003
0.641
0.261
3.235
0.001
−0.666
0.747
3.237
0.001
0.254
0.400
4.415
0.000
−0.946
0.828
2.638
0.004
0.546
0.292
3.790
0.000
−0.830
0.797
2.112
0.017
0.298
0.383
3.113
0.001
−0.946
0.828
1.573
0.058
0.427
0.335
2.664
0.004
−1.098
0.864
1.149
0.125
0.359
0.360
2.241
0.012
−1.032
0.849
0.812
0.208
1.625
0.052
1.929
0.027
3.770
0.000
0.625
0.266
1.339
0.090
3.144
0.001
3.354
0.000
3.027
0.001
1.577
0.057
2.909
0.002
3.196
0.001
2.722
0.003
1.550
0.061
2.583
0.005
2.836
0.002
2.456
0.007
1.281
0.100
2.323
0.010
2.516
0.006
2.227
0.013
1.050
0.147
2.097
0.018
2.224
0.013
2.058
0.020
0.908
0.182
1.878
0.030
1.955
0.025
1.851
0.032
0.696
0.243
1.676
0.047
1.708
0.044
1.623
0.052
Causality-in-mean tests
Causality-in-variance tests
Gazprom doesn't cause VIX
p-value
VIX doesn't cause Gazprom
p-value
Gazprom doesn't cause VIX
p-value
VIX doesn't cause Gazprom
p-value
−0.249
0.598
7.127
0.000
−0.406
0.658
13.935
0.000
−0.554
0.710
4.849
0.000
−0.678
0.751
9.721
0.000
−0.829
0.797
5.706
0.000
−0.813
0.792
7.754
0.000
−1.024
0.847
4.856
0.000
−1.016
0.845
6.592
0.000
−1.198
0.884
4.117
0.000
−1.166
0.878
5.633
0.000
−1.233
0.891
3.843
0.000
−1.290
0.901
4.977
0.000
−0.721
0.765
3.518
0.000
−0.378
0.647
4.397
0.000
1.307
0.096
3.057
0.001
1.255
0.105
3.866
0.000
1.257
0.104
3.043
0.001
0.960
0.168
3.773
0.000
1.415
0.079
2.672
0.004
1.037
0.150
3.417
0.000
1.137
0.128
2.352
0.009
0.810
0.209
3.057
0.001
0.954
0.170
2.087
0.018
0.583
0.280
2.764
0.003
0.969
0.166
1.929
0.027
0.371
0.355
2.770
0.003
0.864
0.194
1.672
0.047
0.189
0.425
2.484
0.006
0.679
0.249
1.449
0.074
0.021
0.491
2.258
0.012
Causality-in-mean tests
Causality-in-variance tests
Sberbank doesn't cause VIX
p-value
VIX doesn't cause Sberbank
p-value
Sberbank doesn't cause VIX
p-value
VIX doesn't cause Sberbank
p-value
−0.649
0.742
20.719
0.000
−0.209
0.583
15.894
0.000
−0.788
0.785
14.683
0.000
−0.643
0.740
10.776
0.000
−0.660
0.745
11.708
0.000
−0.612
0.730
8.428
0.000
−0.910
0.818
9.798
0.000
−0.853
0.803
6.971
0.000
−0.665
0.747
8.459
0.000
−1.036
0.850
5.931
0.000
−0.587
0.721
7.558
0.000
−1.069
0.857
5.174
0.000
0.790
0.215
6.814
0.000
3.911
0.000
4.544
0.000
0.548
0.292
6.124
0.000
3.473
0.000
4.031
0.000
0.655
0.256
5.552
0.000
3.348
0.000
3.575
0.000
0.424
0.336
7.212
0.000
2.991
0.001
3.902
0.000
0.315
0.376
6.669
0.000
2.759
0.003
3.515
0.000
0.306
0.380
6.206
0.000
2.458
0.007
3.192
0.001
0.158
0.437
5.811
0.000
2.165
0.015
2.883
0.002
0.114
0.455
5.647
0.000
1.900
0.029
2.591
0.005
0.416
0.339
5.273
0.000
1.839
0.033
2.365
0.009
Causality-in-mean tests
Causality-in-variance tests
VTB doesn't cause VIX
p-value
VIX doesn't cause VTB
p-value
VTB doesn't cause VIX
p-value
VIX doesn't cause VTB
p-value
−0.464
0.679
6.008
0.000
−0.609
0.729
2.809
0.002
−0.580
0.719
4.812
0.000
−0.924
0.822
1.842
0.033
−0.808
0.790
3.754
0.000
−0.807
0.790
1.396
0.081
−0.797
0.787
3.482
0.000
−1.010
0.844
0.897
0.185
−0.605
0.727
2.845
0.002
−0.852
0.803
0.708
0.240
−0.242
0.595
2.949
0.002
−0.780
0.782
0.556
0.289
1.179
0.119
2.714
0.003
1.902
0.029
0.249
0.402
0.901
0.184
2.368
0.009
1.533
0.063
0.160
0.436
0.908
0.182
2.030
0.021
1.242
0.107
−0.078
0.531
1.318
0.094
2.496
0.006
1.071
0.142
0.159
0.437
1.072
0.142
2.221
0.013
0.813
0.208
−0.054
0.521
0.996
0.160
1.925
0.027
0.699
0.242
−0.123
0.549
0.763
0.223
1.971
0.024
0.520
0.302
−0.213
0.584
1.056
0.145
1.731
0.042
0.400
0.345
−0.364
0.642
1.062
0.144
1.603
0.054
0.236
0.407
−0.512
0.696
Lag length
Causality-in-mean tests
Causality-in-variance tests
Gazprom doesn't cause Russia
p-value
Russia doesn't cause Gazprom
p-value
Gazprom doesn't cause Russia
p-value
Russia doesn't cause Gazprom
p-value
1
−0.253
0.600
0.360
0.359
0.820
0.206
9.865
0.000
2
−0.659
0.745
0.629
0.265
0.429
0.334
7.090
0.000
3
−0.576
0.718
0.311
0.378
0.802
0.211
5.578
0.000
4
−0.716
0.763
−0.077
0.531
0.519
0.302
4.478
0.000
5
1.086
0.139
−0.001
0.500
0.196
0.422
3.725
0.000
6
0.729
0.233
−0.060
0.524
−0.106
0.542
3.165
0.001
7
0.428
0.334
−0.275
0.608
−0.006
0.502
2.669
0.004
8
0.151
0.440
0.078
0.469
−0.255
0.601
2.478
0.007
9
0.426
0.335
0.069
0.473
0.088
0.465
2.273
0.012
10
0.211
0.416
−0.139
0.555
0.034
0.486
2.022
0.022
11
0.049
0.480
−0.345
0.635
−0.133
0.553
1.714
0.043
12
−0.142
0.556
−0.494
0.689
−0.310
0.622
1.437
0.075
13
−0.332
0.630
−0.644
0.740
−0.383
0.649
1.292
0.098
14
−0.506
0.694
−0.754
0.775
−0.479
0.684
1.089
0.138
15
−0.639
0.739
−0.593
0.723
−0.577
0.718
1.117
0.132
Lag length
Causality-in-mean tests
Causality-in-variance tests
Sberbank doesn't cause Russia
p-value
Russia doesn't cause Sberbank
p-value
Sberbank doesn't cause Russia
p-value
Russia doesn't cause Sberbank
p-value
1
−0.661
0.746
37.158
0.000
28.486
0.000
−0.028
0.511
2
−0.831
0.797
26.271
0.000
19.649
0.000
−0.417
0.662
3
−0.230
0.591
21.153
0.000
15.635
0.000
−0.643
0.740
4
0.478
0.316
17.968
0.000
13.340
0.000
−0.854
0.803
5
0.250
0.401
15.927
0.000
11.728
0.000
−1.080
0.860
6
−0.006
0.502
14.334
0.000
10.417
0.000
−1.252
0.895
7
−0.263
0.604
13.196
0.000
9.381
0.000
−1.113
0.867
8
−0.212
0.584
12.899
0.000
8.532
0.000
−1.279
0.900
9
−0.295
0.616
11.991
0.000
8.231
0.000
−1.017
0.845
10
0.020
0.492
11.588
0.000
7.790
0.000
−0.987
0.838
11
−0.082
0.533
11.440
0.000
7.540
0.000
−1.059
0.855
12
−0.197
0.578
11.019
0.000
7.089
0.000
−1.195
0.884
13
−0.331
0.630
10.417
0.000
6.624
0.000
−1.234
0.891
14
0.302
0.381
9.867
0.000
6.441
0.000
−1.368
0.914
15
0.117
0.454
9.578
0.000
6.130
0.000
−1.456
0.927
Lag length
Causality-in-mean tests
Causality-in-variance tests
VTB doesn't cause Russia
p-value
Russia doesn't cause VTB
p-value
VTB doesn't cause Russia
p-value
Russia doesn't cause VTB
p-value
1
0.407
0.342
34.571
0.000
1.832
0.034
51.498
0.000
2
−0.174
0.569
24.760
0.000
0.795
0.213
36.757
0.000
3
0.168
0.433
20.095
0.000
0.732
0.232
29.665
0.000
4
−0.049
0.519
17.317
0.000
0.326
0.372
25.411
0.000
5
−0.051
0.520
15.743
0.000
−0.002
0.501
22.921
0.000
6
1.278
0.101
15.174
0.000
0.467
0.320
21.600
0.000
7
1.562
0.059
13.811
0.000
2.579
0.005
19.733
0.000
8
1.263
0.103
12.673
0.000
2.169
0.015
18.262
0.000
9
1.006
0.157
11.759
0.000
1.913
0.028
16.997
0.000
10
0.767
0.222
10.944
0.000
1.666
0.048
15.901
0.000
11
0.540
0.295
10.318
0.000
1.438
0.075
15.039
0.000
12
0.314
0.377
9.675
0.000
1.198
0.115
14.296
0.000
13
0.397
0.346
9.104
0.000
1.052
0.146
13.542
0.000
14
0.790
0.215
8.642
0.000
1.340
0.090
12.930
0.000
15
0.582
0.280
8.363
0.000
1.211
0.113
12.401
0.000
Lag length
Causality-in-mean tests
Causality-in-variance tests
Sberbank doesn't cause Gazprom
p-value
Gazprom doesn't cause Sberbank
p-value
Sberbank doesn't cause Gazprom
p-value
Gazprom doesn't cause Sberbank
p-value
1
−0.702
0.759
23.760
0.000
−0.694
0.756
29.661
0.000
2
−0.848
0.802
16.843
0.000
−0.892
0.814
20.933
0.000
3
−0.169
0.567
13.348
0.000
−1.111
0.867
16.719
0.000
4
−0.205
0.581
11.206
0.000
−1.177
0.880
14.228
0.000
5
−0.226
0.590
10.474
0.000
−1.365
0.914
12.425
0.000
6
−0.105
0.542
10.455
0.000
−1.341
0.910
14.144
0.000
7
−0.358
0.640
10.020
0.000
−1.508
0.934
12.966
0.000
8
−0.504
0.693
10.133
0.000
−1.258
0.896
12.270
0.000
9
−0.637
0.738
9.324
0.000
−1.172
0.879
11.336
0.000
10
−0.502
0.692
9.282
0.000
−1.079
0.860
11.487
0.000
11
−0.684
0.753
8.727
0.000
−1.232
0.891
10.819
0.000
12
−0.704
0.759
8.389
0.000
−1.383
0.917
10.331
0.000
13
−0.852
0.803
8.454
0.000
−1.512
0.935
10.112
0.000
14
−0.064
0.526
7.991
0.000
−1.466
0.929
9.576
0.000
15
−0.130
0.552
7.600
0.000
−1.479
0.930
9.258
0.000
Lag length
Causality-in-mean tests
Causality-in-variance tests
VTB doesn't cause Gazprom
p-value
Gazprom doesn't cause VTB
p-value
VTB doesn't cause Gazprom
p-value
Gazprom doesn't cause VTB
p-value
1
−0.467
0.680
38.607
0.000
0.234
0.408
58.126
0.000
2
−0.828
0.796
27.239
0.000
−0.299
0.618
40.851
0.000
3
−0.888
0.813
21.876
0.000
−0.621
0.733
32.946
0.000
4
−1.066
0.857
18.785
0.000
−0.823
0.795
28.235
0.000
5
−1.257
0.896
16.525
0.000
−0.700
0.758
25.014
0.000
6
−0.690
0.755
16.181
0.000
−0.132
0.553
23.416
0.000
7
−0.356
0.639
14.744
0.000
0.876
0.191
21.463
0.000
8
−0.581
0.720
13.564
0.000
0.636
0.263
19.848
0.000
9
−0.687
0.754
12.582
0.000
0.628
0.265
18.551
0.000
10
−0.871
0.808
12.103
0.000
0.495
0.310
17.511
0.000
11
−0.850
0.802
11.458
0.000
0.283
0.389
16.613
0.000
12
−0.987
0.838
10.766
0.000
0.100
0.460
15.912
0.000
13
−0.527
0.701
10.187
0.000
0.151
0.440
15.108
0.000
14
−0.119
0.547
9.718
0.000
0.101
0.460
14.471
0.000
15
−0.287
0.613
9.216
0.000
0.049
0.480
13.839
0.000
Lag length
Causality-in-mean tests
Causality-in-variance tests
VTB doesn't cause Sberbank
p-value
Sberbank doesn't cause VTB
p-value
VTB doesn't cause Sberbank
p-value
Sberbank doesn't cause VTB
p-value
1
6.466
0.000
0.702
0.241
1.705
0.044
−0.566
0.714
2
4.425
0.000
0.110
0.456
1.071
0.142
−0.852
0.803
3
3.462
0.000
−0.269
0.606
0.469
0.319
−1.104
0.865
4
2.652
0.004
−0.519
0.698
0.263
0.396
−1.175
0.880
5
3.434
0.000
−0.678
0.751
0.390
0.348
−1.320
0.907
6
3.079
0.001
−0.619
0.732
0.125
0.450
−1.400
0.919
7
2.660
0.004
−0.684
0.753
−0.066
0.526
0.072
0.471
8
2.558
0.005
−0.796
0.787
−0.127
0.550
−0.166
0.566
9
2.284
0.011
−0.900
0.816
−0.240
0.595
−0.307
0.621
10
1.993
0.023
−1.001
0.842
−0.376
0.646
−0.400
0.655
11
1.713
0.043
−0.923
0.822
−0.452
0.674
−0.541
0.706
12
1.521
0.064
−0.732
0.768
−0.591
0.723
−0.570
0.716
13
1.478
0.070
−0.880
0.811
−0.764
0.778
−0.737
0.769
14
2.364
0.009
−0.749
0.773
−0.123
0.549
−0.876
0.810
15
2.137
0.016
−0.892
0.814
−0.239
0.594
−0.939
0.826