
Abstract
It is estimated that about 18 million people worldwide suffer from dementia and it is projected to increase to about 35 million by the year 2025. All types of dementia occur due to an aberration in memory retention and development, caused by malfunctioning neurons. Experimental investigation of the dynamics of biological networks is a fundamental step towards understanding how the nervous system works. Activity-dependant modification of synaptic strength is widely recognized as cellular basis of learning, memory and developmental plasticity. Understanding memory formation and development, thus translates to changes in the electrical activity of the neurons. It is not possible to achieve this understanding at a cellular level by in vivo studies. To map the changes in the electrical activity it is essential to conduct in-vitro studies on individual neurons. Hence there is an enormous need to develop novel ways for assembly of highly controlled neuronal networks. To this end, we used a 5 × 5 multiple microelectrode array system to spatially arrange neurons, by combination of applied DC and AC fields We characterized electric field distribution inside our test platform by using two dimensional finite element modeling (FEM). As the first stage in the formation of a neural network dielectrophoretic AC fields were used to position the neurons over the electrodes. We used DC electric field to control axon growth direction within the network. Applied electric field direction is found to be an important parameter for axon growth. Electrical impulses were recorded from the individual neurons in the network during positioning and network formation.
Materials and Methods
We employed dielectrophoretic forces in our experiment to achieve the separation of neurons from glial cells. Dielectrophoretic cell separation exploits dielectrophoretic forces that are created on cells when a non uniform electrical field interacts with the field-induced electrical polarization on the cells. Depending on the dielectric properties of the cells relative to the suspending medium, these forces can be either positive or negative and can direct the cells toward strong or weak electrical field regions, where cells with distinct intrinsic dielectric properties can be controlled. Figure 1 depicts the principle of action of dielectrophoretic forces on mammalian cells. The Force equation for dielectrophoresis and the cross over frequency (fCM) are also shown. The cross over frequency is that frequency at which a particle does not experience any dielectrophoretic force for a given solution conductivity, applied amplitude and applied frequency.
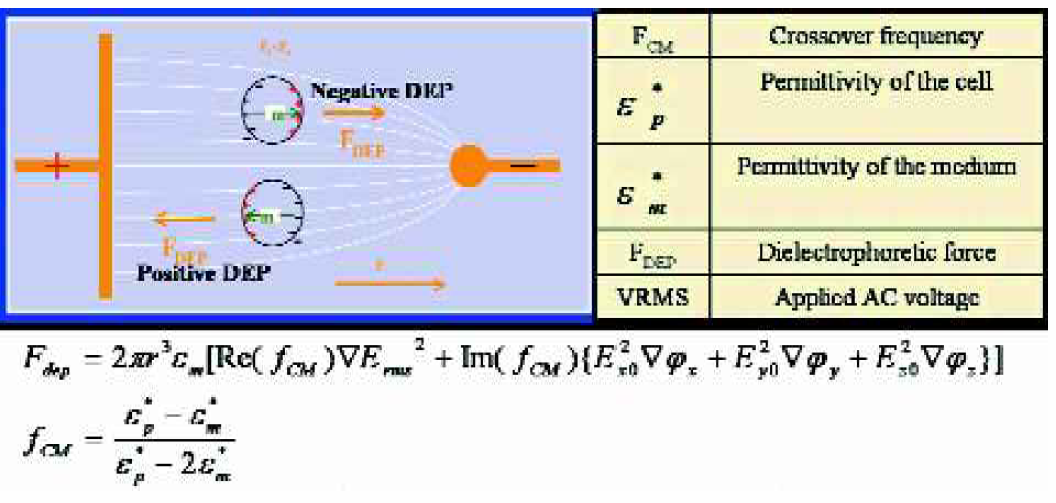
Representation of the principle of action of dielectrophoretic forces on mammalian cells.
The substrate has a 5×5 electrode array pattern, with electrode diameter of 80mm with a 200μm center to center spacing and covering an area of 0.8×0.8 mm2. Two platinum plated leads (6mm, thick) from each electrode terminate at two separate electrode pads. The dimension of the electrode pads are 100μm × 20μm. The electrode array is shown in figure 2.
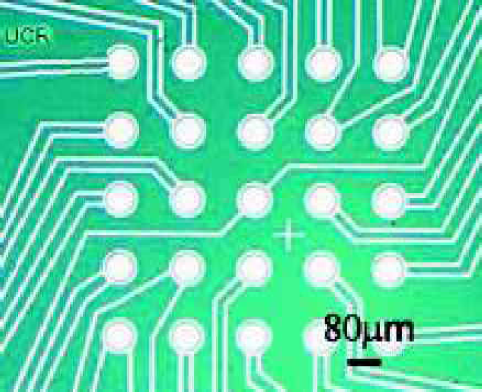
Optical micrograph of the 5×5 electrode array. 80 μm 80 μm Neurons.
CHIP ASSEMBLY
The electrode array chip was coated with Bovine Serum Albumin with a volume of 200 μL (BSA, 1mg/mL, Sigma, St Louis). The chip with the aqueous coating of BSA permeation layer is incubated for 12 hours prior to the experiment at 37°C and 5% CO2. The purpose of the BSA permeation layer is to improve the cell adhesiveness to the chip substrate. The chip was then covered with a silicone chamber (16mmx16mmx2.5mm). The silicone chamber had an opening at the center (1.2mmx1.2mmx2.5mm). The silicone chamber was covered by a glass cover slip (500μm thick). The volume of the silicon chamber was 25 μL. The silicone chamber and the glass cover slip were required to maintain a constant local environment for the cell culture in order to obtain reliable measurements. Figure 3(A) gives a schematic representation of the entire chip assembly.

Schematic representation of the chip assembly. The chip is covered by a transparent silicone chamber 2.5mm thick with a volume of 25mL. The entire chip system was covered by a coverslip 2.5mm thick to prevent any change to the local environment.
MEASUREMENT SYSTEM
Figure 3(B) shows a schematic representation of the measurement system. It comprises of extracellular positioning, stimulating and recording units. The neurons were separated from the glial cells and positioned over the electrodes by setting up a gradient AC field using an extracellular positioning system comprising of a pulse generator (HP 33120A) and micromanipulators (Signatone, Gilroy, CA). The signal from the pulse generator was fed to the electrode pads of the selected electrodes using the micromanipulators. The extracellular recordings from the cells were amplified and recorded on an oscilloscope (HP 54600B, 100 MHz). For directed network formation studies, a DC electric field from a voltage source/measure unit (Keithley 237, Keithley Instruments, Cleveland, OH) was applied through the micromanipulators. The data was recorded on a 4 channel digitizing oscilloscope (Tektronix TDS 420A, 200 MHz). The supply and measurement systems are integrated using general purpose interface bus (GPIB) control and controlled through LabVIEW (National Instruments, Austin, TX).

Schematic representation of the measuring system. The system comprises of extra cellular positioning, stimulating and recording systems. The AC potential is applied through a pulse generator. The DC potential is applied through a voltage source/measurement unit. The electrical activity is recorded using a multi channel data acquisition oscilloscope. The entire setup is integrated to the computer using LabVIEW.
Cell Culture
The cell culture solution comprised of neuron and glial cells obtained from the hippocampus of 18 day old rattus norvegicus embryos. The confluence of the cells was 7500 cells in 1mL. In order to achieve the patterning of a single cell over a single electrode, a 10 μL of cell culture solution was mixed with 250 μL Dulbeco modified eagle medium (DMEM; Gibco, Grand Island NY) supplemented with 10% fetal bovine serum, 100μg/mL penicillin, and 100 μg/mL streptomycin and incubated for 2 hours at 5% CO2 and 37°C. The cells were centrifuged and re-suspended in 1mL of separation buffer consisting of 1:9 dilutions of 250 mM sucrose/ 1640 RPMI (Sigma, St. Louis) and water (w/v). The conductivity of the separation buffer was 1.2 mS/cm and with a pH of 7.66. The separation buffer is suitable for the initial stages of neurite growth. The separation buffer was replaced by a high conductance media ((DMEM)/ Fetal Bovine Serum (FBS)/Phosphate Buffer Saline (PBS)) with conductivity of 250 mS/cm and a pH of 8.06 for long term maintenance of the neuronal network.
Results
MODELING RESULTS
The optimum range of the various parameters involved in setting up the dielectrophoretic forces for cell separation and the DC field strength for directed process growth were determined using two dimensional finite element modeling. The software used for this purpose was the CFD-ACE+ package (CFDRC™, San Diego, CA). Using this package the fluid flow on the electrode array is modeled. The structural dynamics of the various cell types, the electro kinetics and the bio-chemistry of the cell types and their effects on the electric fields are also modeled.
The frequency range at which the neurons are expected to move to the electrode edges, while the glial cells move to the region between the electrodes was between 3–5 MHz for peak to peak voltage (Vpp) of 8V and conductivity between 1–3mS/cm. This is depicted in figure 4(A). The frequency range at which the glial cells are expected to move to the electrode edges while the neurons move to the areas between the electrodes was modeled to be between 130–160 kHz at 2Vpp for a conductivity of 6mS/cm which is shown in figure 4(B). Figure 4(C) gives the electro kinetic flow of the cell types in the separation buffer is modeled. The red areas show the flow loop for the cell type moving to the high field region, while the small blue arrows indicate the flow direction for the cell type moving to the low field region.
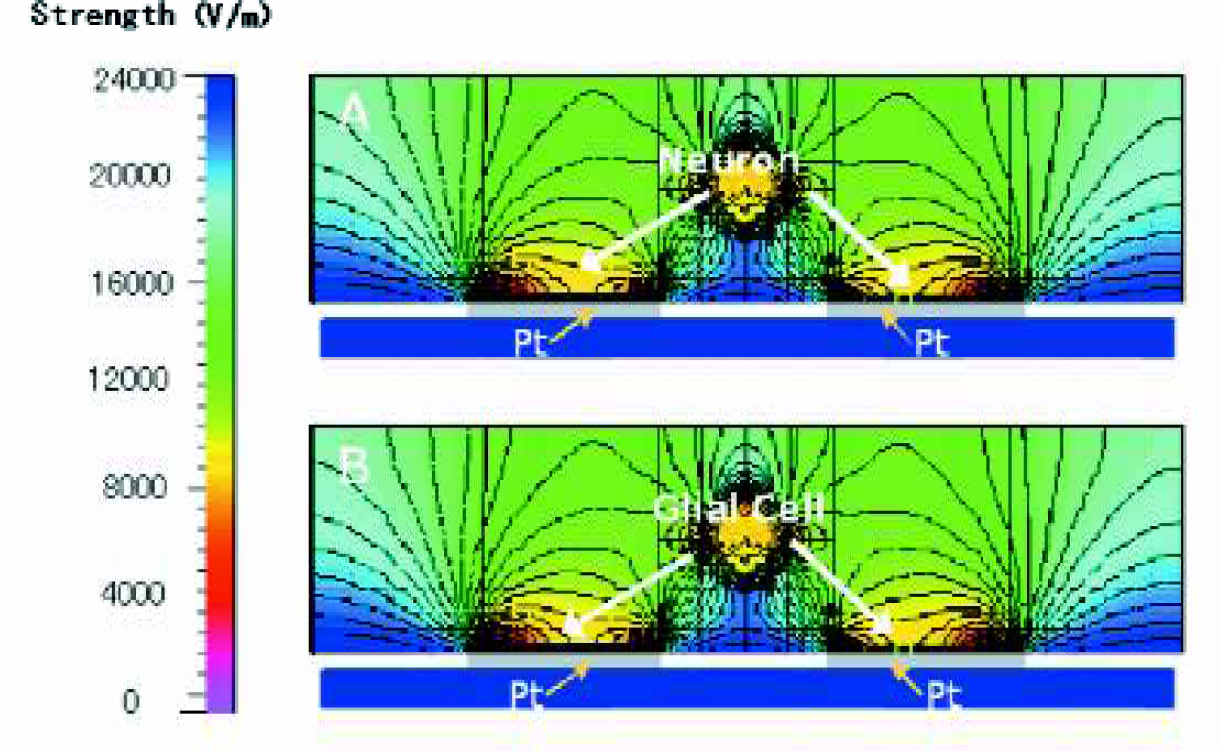
The frequency range at which the neurons are expected to move to the electrode edges, while the glial cells move to the region between the electrodes was between 3–5 MHz for peak to peak voltage (Vpp) of 8V and conductivity between 1–3mS/cm. (

The electro kinetic flow of the cell types in the separation buffer is modeled. The red areas show the flow loop for the cell type moving to the high field region, while the small blue arrows indicate the flow direction for the cell type moving to the low field region.
Modeling of the DC electric field distribution along the cross section
(
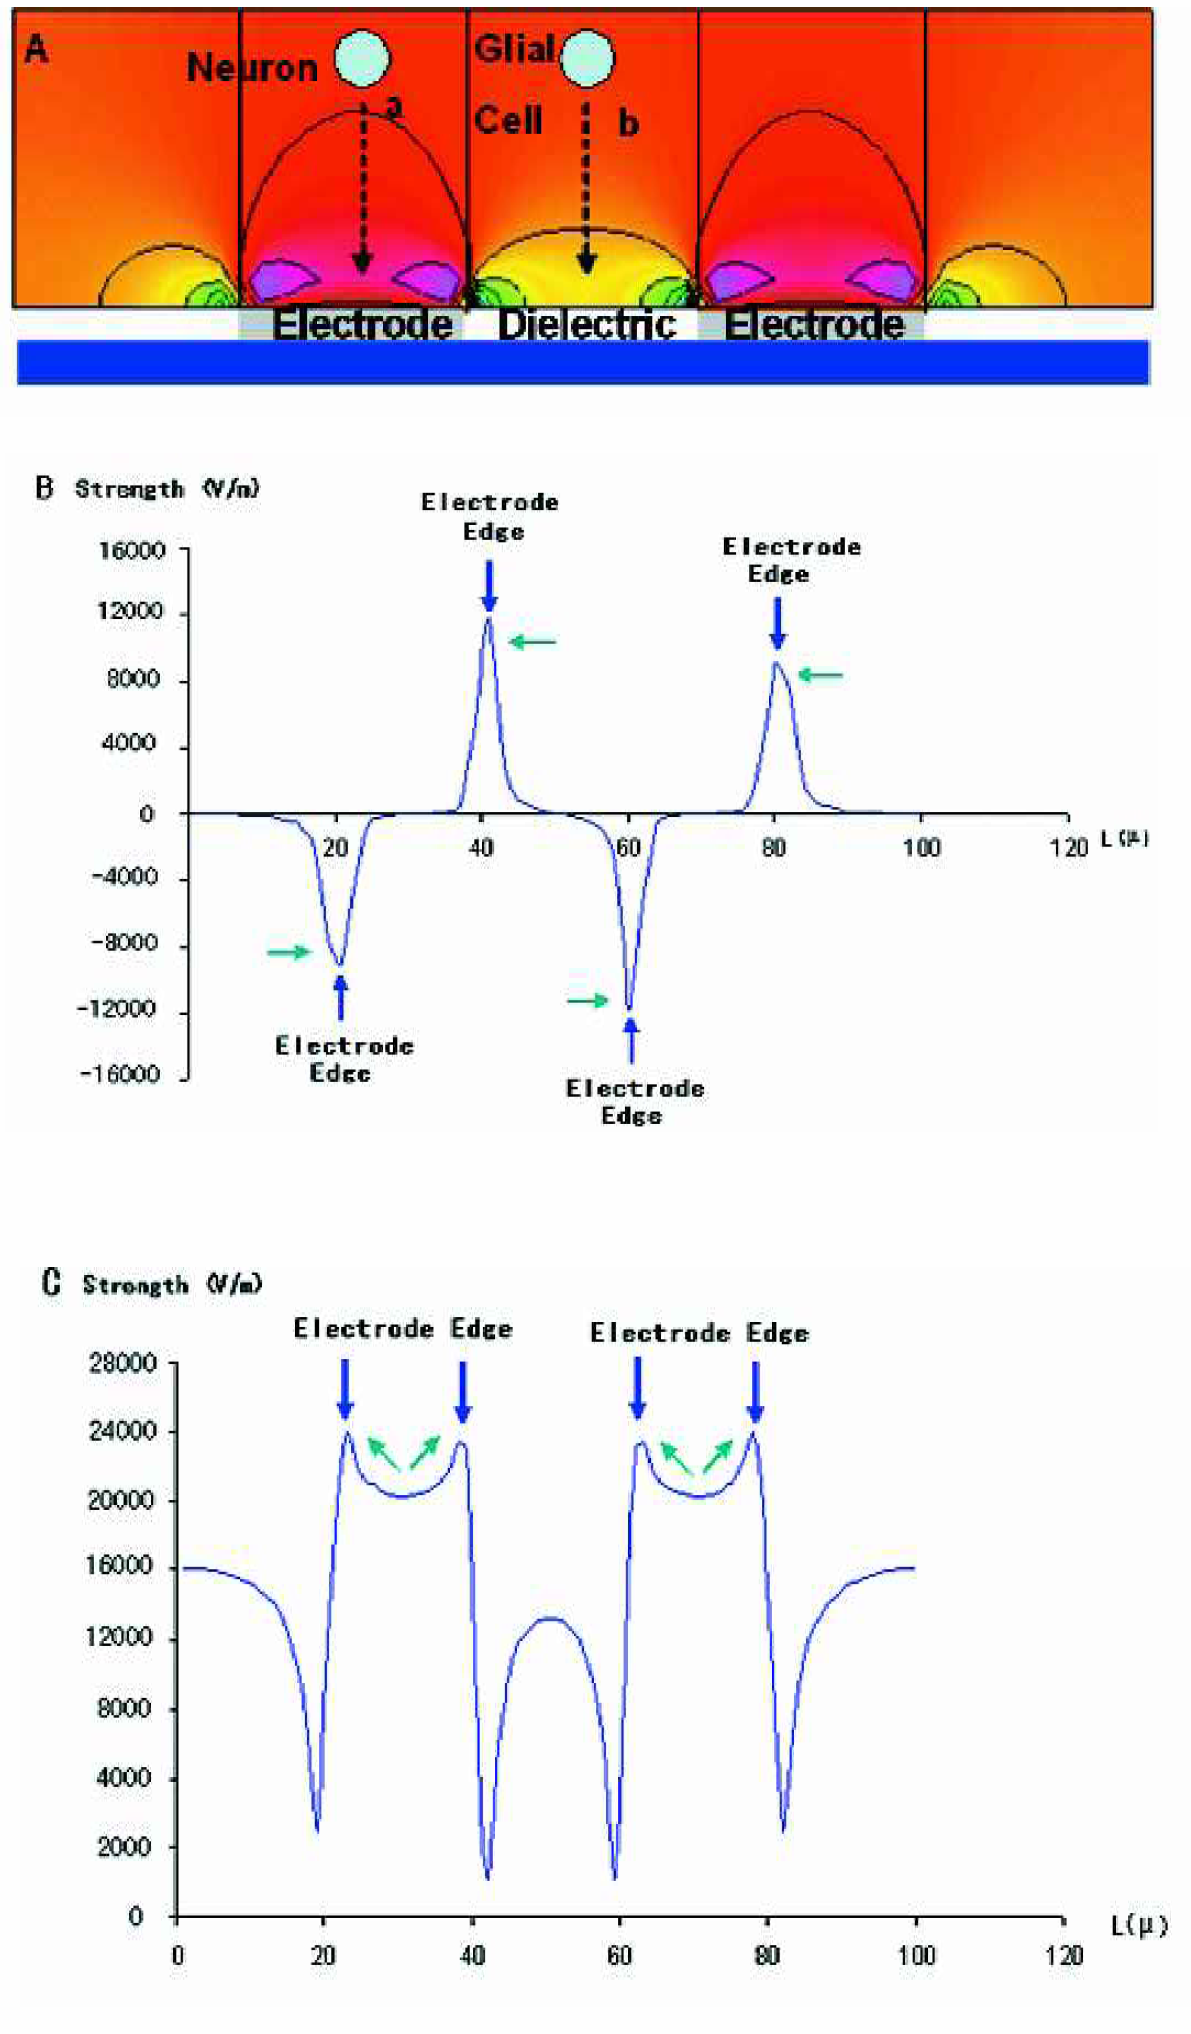
Figure 6(A) represents the modeling of the velocity profile of the neuron and glial cells at buffer conductivity between 1–3mS/cm. The modeling indicates the effect of electro osmosis to be greater than electrophoresis on glial cells, resulting in them retaining their positions between the electrodes (cross section profile b). In the case of neurons the effect of electrophoresis dominates (cross section profile a). Figure 6 (B) indicates that there is acceleration in the lateral velocity due to strong lateral electrical field Ex deceleration in the vertical velocity due to weak vertical electric fields Ey for cells along cross section profile b. Figure 6(C) indicates that the effect of electrophoresis dominates in the region corresponding to the height of the chip assembly, hence the electrophoretic velocity dominates over electro osmotic force along cross section profile a.

Modeling of the velocity profile of the neuron and glial cells at buffer conductivity between 1–3mS/cm. The modeling indicates the effect of electro osmosis to be greater than electrophoresis on glial cells, resulting in them retaining their positions between the electrodes (cross section profile b). In the case of neurons the effect of electrophoresis dominates (cross section profile a).

(
Experimental Results
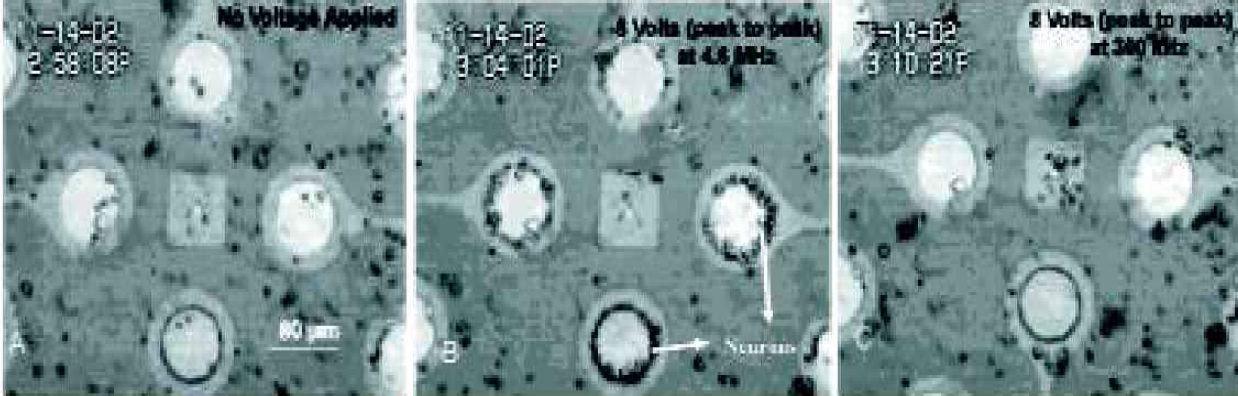
Figure 7 (A) shows the random distribution of the various cell types in the culture over the chip surface in the absence of applied AC potential. Figure 7(B) shows the patterned arraying of neurons on electrode edges on applying an AC field of 8Vpp at 4.6 MHz due to positive dielectrophoresis. Figure 7(C) indicates shows the movement of neurons away from electrodes due to negative dielectrophoresis at 8Vpp and 300 kHz.
(
Figure 8(A) shows the positioning of glial cells on the electrodes on applying an AC potential of 152 kHz and 2 V peak to peak. Glial cells exhibit movement towards the electrodes due to positive dielectrophoresis.

Positioning of glial cells on the electrodes on applying an AC potential of 152 kHz and 2 V peak to peak. Glial cells exhibit movement towards the electrodes due to positive dielectrophoresis.
Figure 8(B) shows the movement of glial cells away from the electrode at 14.7 kHz and 2 V peak to peak. Glial cells exhibit movement away from the electrode due to negative dielectrophoresis.

Movement of glial cells away from the electrode at 14.7 kHz and 2 V peak to peak. Glial cells exhibit movement away from the electrode due to negative dielectrophoresis.
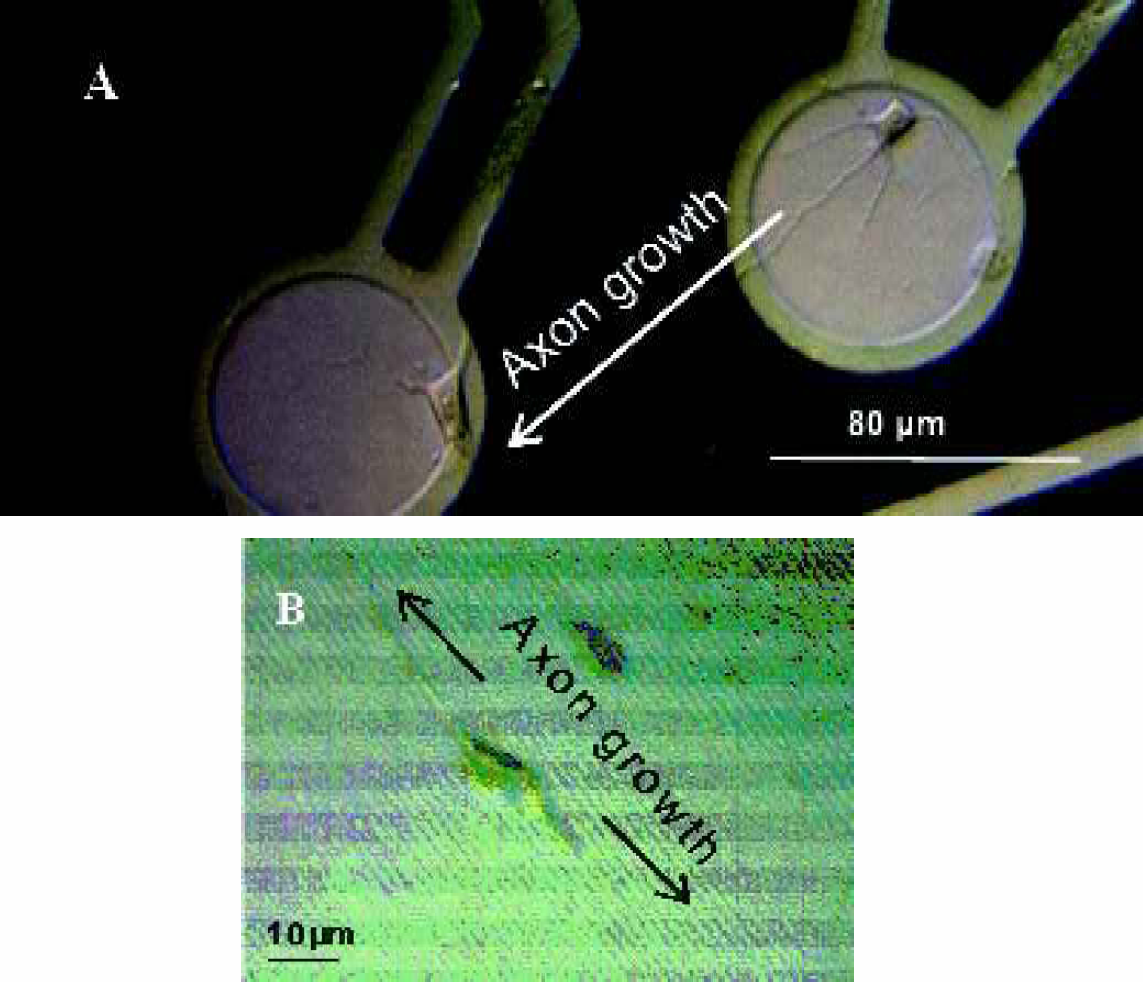
Figure 9(A) shows the directed growth of neurites on applying DC potential of 0.8 V. Growth direction is along decreasing field. Figure 9(B) shows the control experiment, neurites growing along micro trenches in direction of decreasing electric field strength.
(
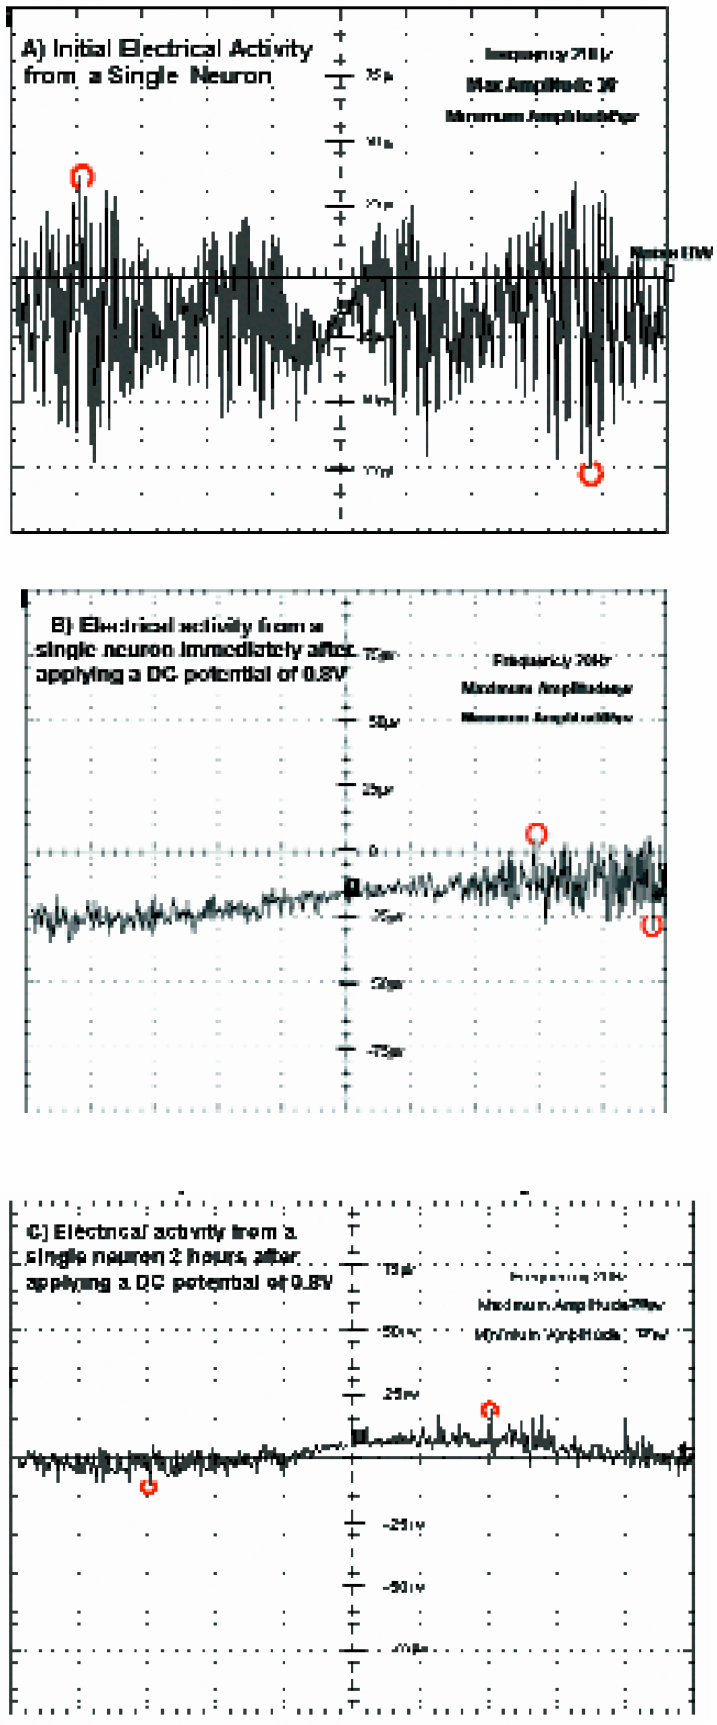
Figure 10 (A) represents a plot of the initial electrical activity from single neuron. Periodicity of the signal varies between 3s to 10s. Figure 10 (B) indicates a plot of the electrical activity from single neuron immediately after applying DC potential of 0.8V. Periodicity of signal remains unchanged. Figure 10 (C) indicates the electrical activity from single neuron two hours after applying DC potential of 0.8V.
(
Summary
A novel technique, to pattern neurons and to form neuronal networks, using electrical fields on the planar micro electrode array platforms, has been presented. The planar electrode arrays are fabricated by applying the existing semiconductor fabrication technology. Neurons are separated from the glial cells and positioned over the electrodes using dielectrophoretic forces. Controlled network formation is induced by applying low DC fields. We correlate the experimental results with the modeling results.
Conclusions
The technique of using a combination of DC and AC electric fields to achieve network formation has implications in neural engineering, elucidating a new and simpler method to develop and study neuronal networks as compared to conventional microelectrode array techniques. Finally in addition to its application as a tool in memory development analysis, this type of patterned neuronal network can be used as biosensors as well as toxic screens.
Footnotes
Acknowledgments
We thank Dr. Vladimir Parpura (Cell Biology and Neuroscience, University of California Riverside) and Dr. Iryna Ethell (Biomedical Sciences, University of California Riverside) for providing us with the neuron cell cultures. We also thank Dr. Ying Huang (Nanogen, San Diego) and Andre Morgan (University of California Riverside) for helpful discussions. Funding for this work was provided by DOD/DARPA/ DMEA under grant number