
Abstract

Why is Fuzzy logic classification of mass spectra needed?
Automated imaging instrument acquires up to 7200 spectra per hour.
Identifying mineral, soil, or microbe types requires more than just the presence or absence of specific peaks.
Desorption/ionization techniques have a slight, inherent variability to ion abundances produced.
Instrumentation
Our laser-based optical and chemical imager (LOCI) incorporates an imaging Fourier transform mass spectrometer (FTMS) that has been described in the literature. 1 LOCI is depicted in Figure 1.
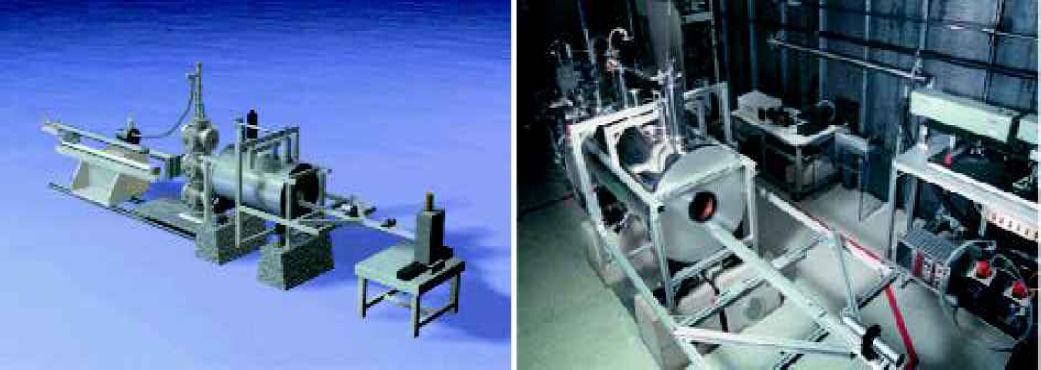
3D rendering and photo of LOCI.
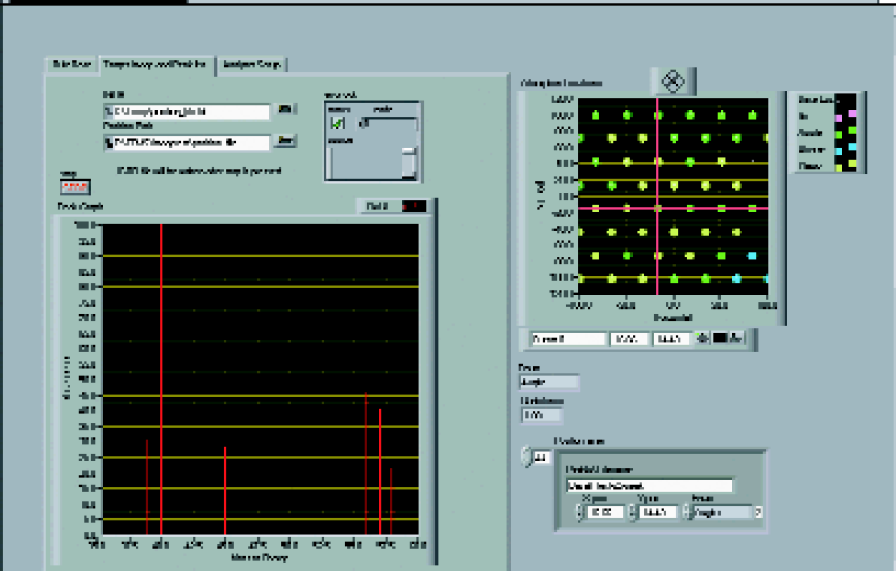
Automation of the instrument has also been described in the lit-erature. 2 It includes a Fuzzy-logic inference engine that color codes ‘pixels’ according to classification. A user friendly graphical interface (Figure 2) allows the user to check the cursor from one spot to the next; the user can see the line spectrum the inference engine used to generate that pixel. Data can then be displayed directly in the program or exported in formats compatible with commercial graphics programs.
Experimental
Thin slices of basalt cored from the INEEL's subsurface were mounted and inserted into LOCI. For chemical imaging, spectra were obtained by laser desorption FTMS.
Figure 3 is a chemical image of basalt produced using LOCI. (a) Micrograph of basalt thin section. (B) Image of ∼ 1 × 1 mm area. Typical spectra of mineral types: (C) Olivine, (D) Plagioclase, (E) Ilmenite, (F) Augite, and (G) Augite with chromium. All FTMS spectra are from single shots with mass accuracy of ± 0.0004 amu and average resolution of 30,000.
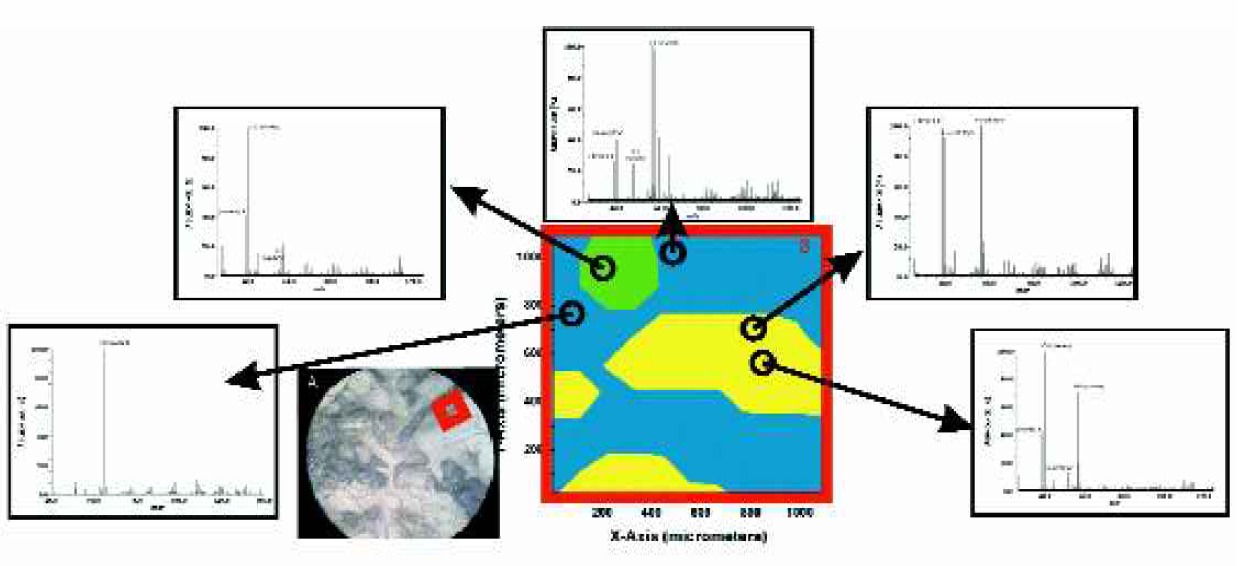
Chemical image of basalt produced by LOCI.
Fuzzy Logic
The steps to computing the fuzzy membership value of a sampled location in a given classification are described here:
find the peak abundance for each m/z that affects the classification as illustrated in
Figure 4. Illustration of how inference engine identifies peaks of interest and their
abundances.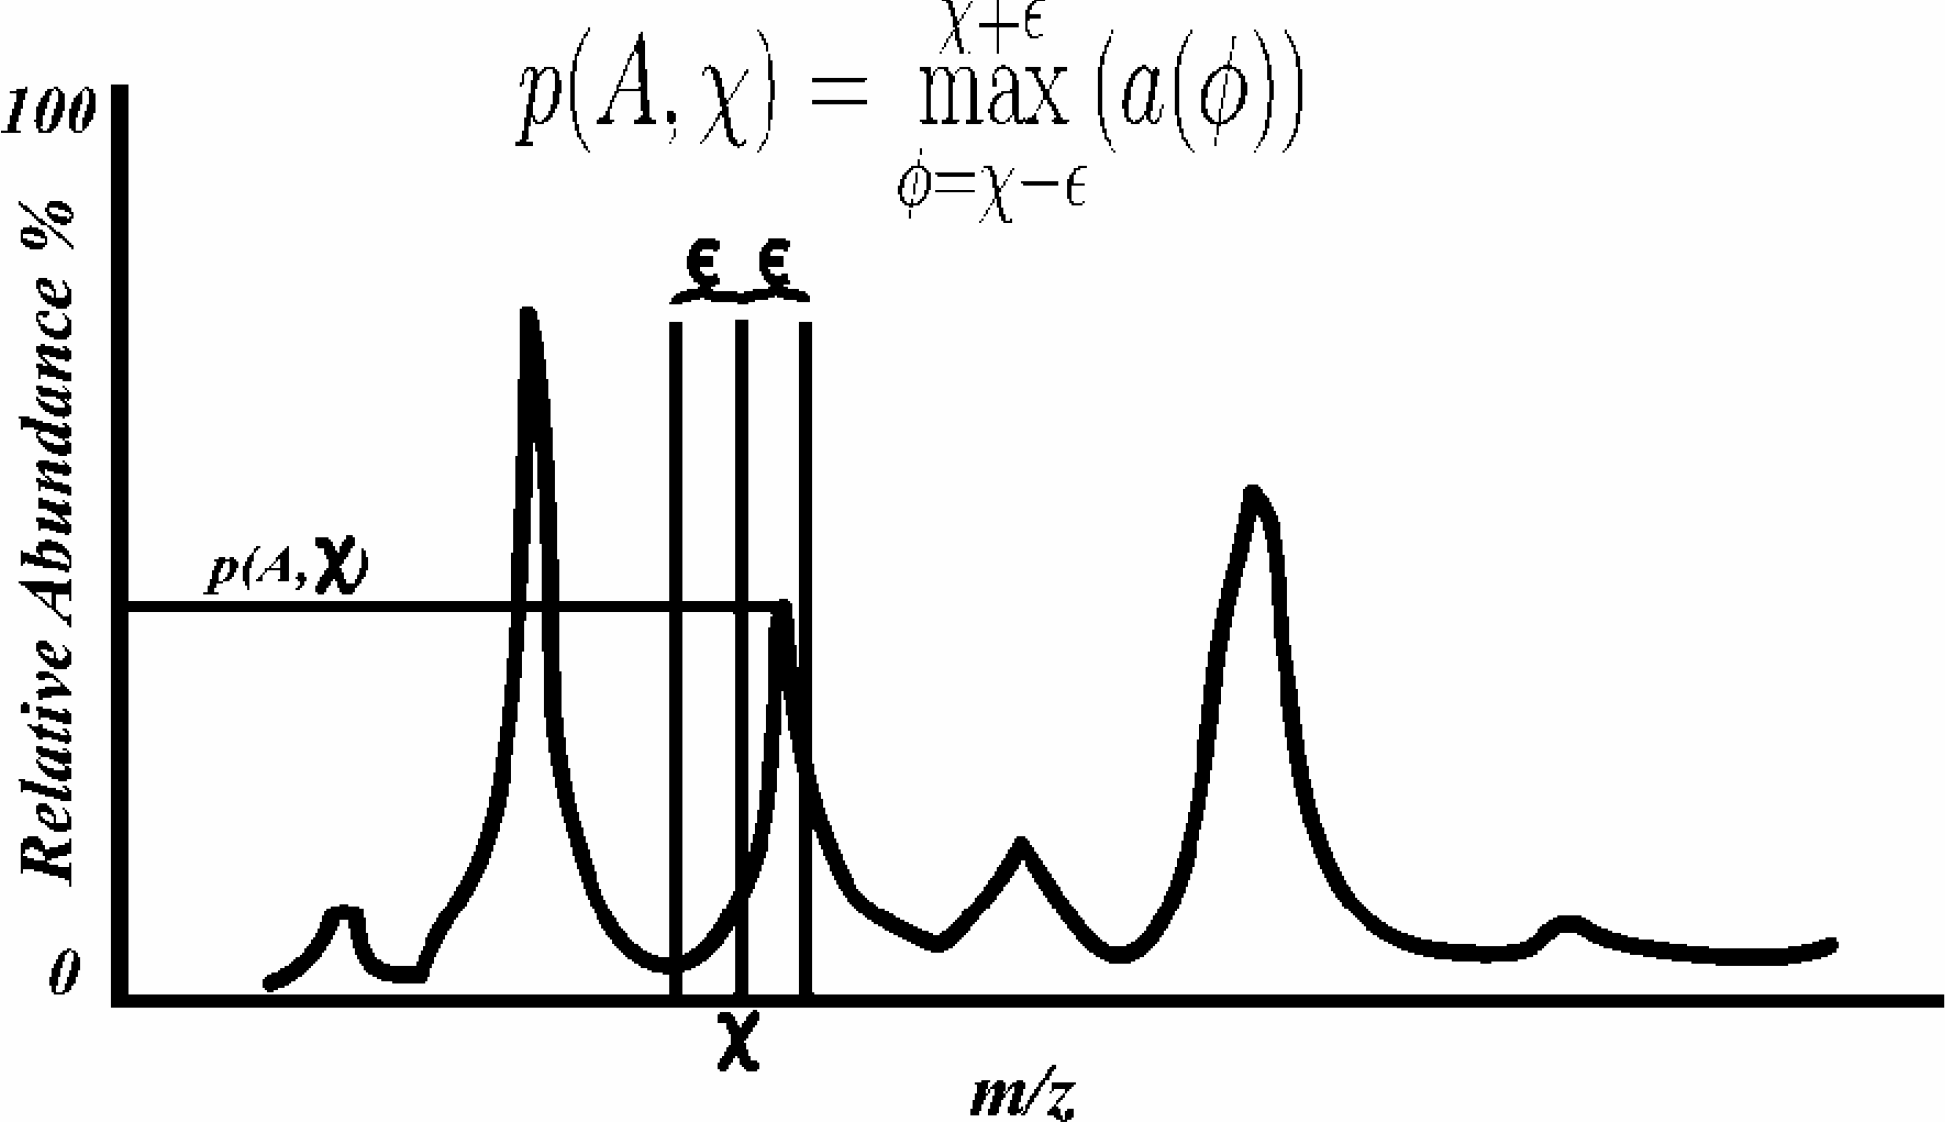
find the membership value for that peak based on a membership function that is defined
to reflect the necessary abundance levels to consider the m/z present or absent as
required (Figure 5). Illustration of Fuzzy logic for membership truth.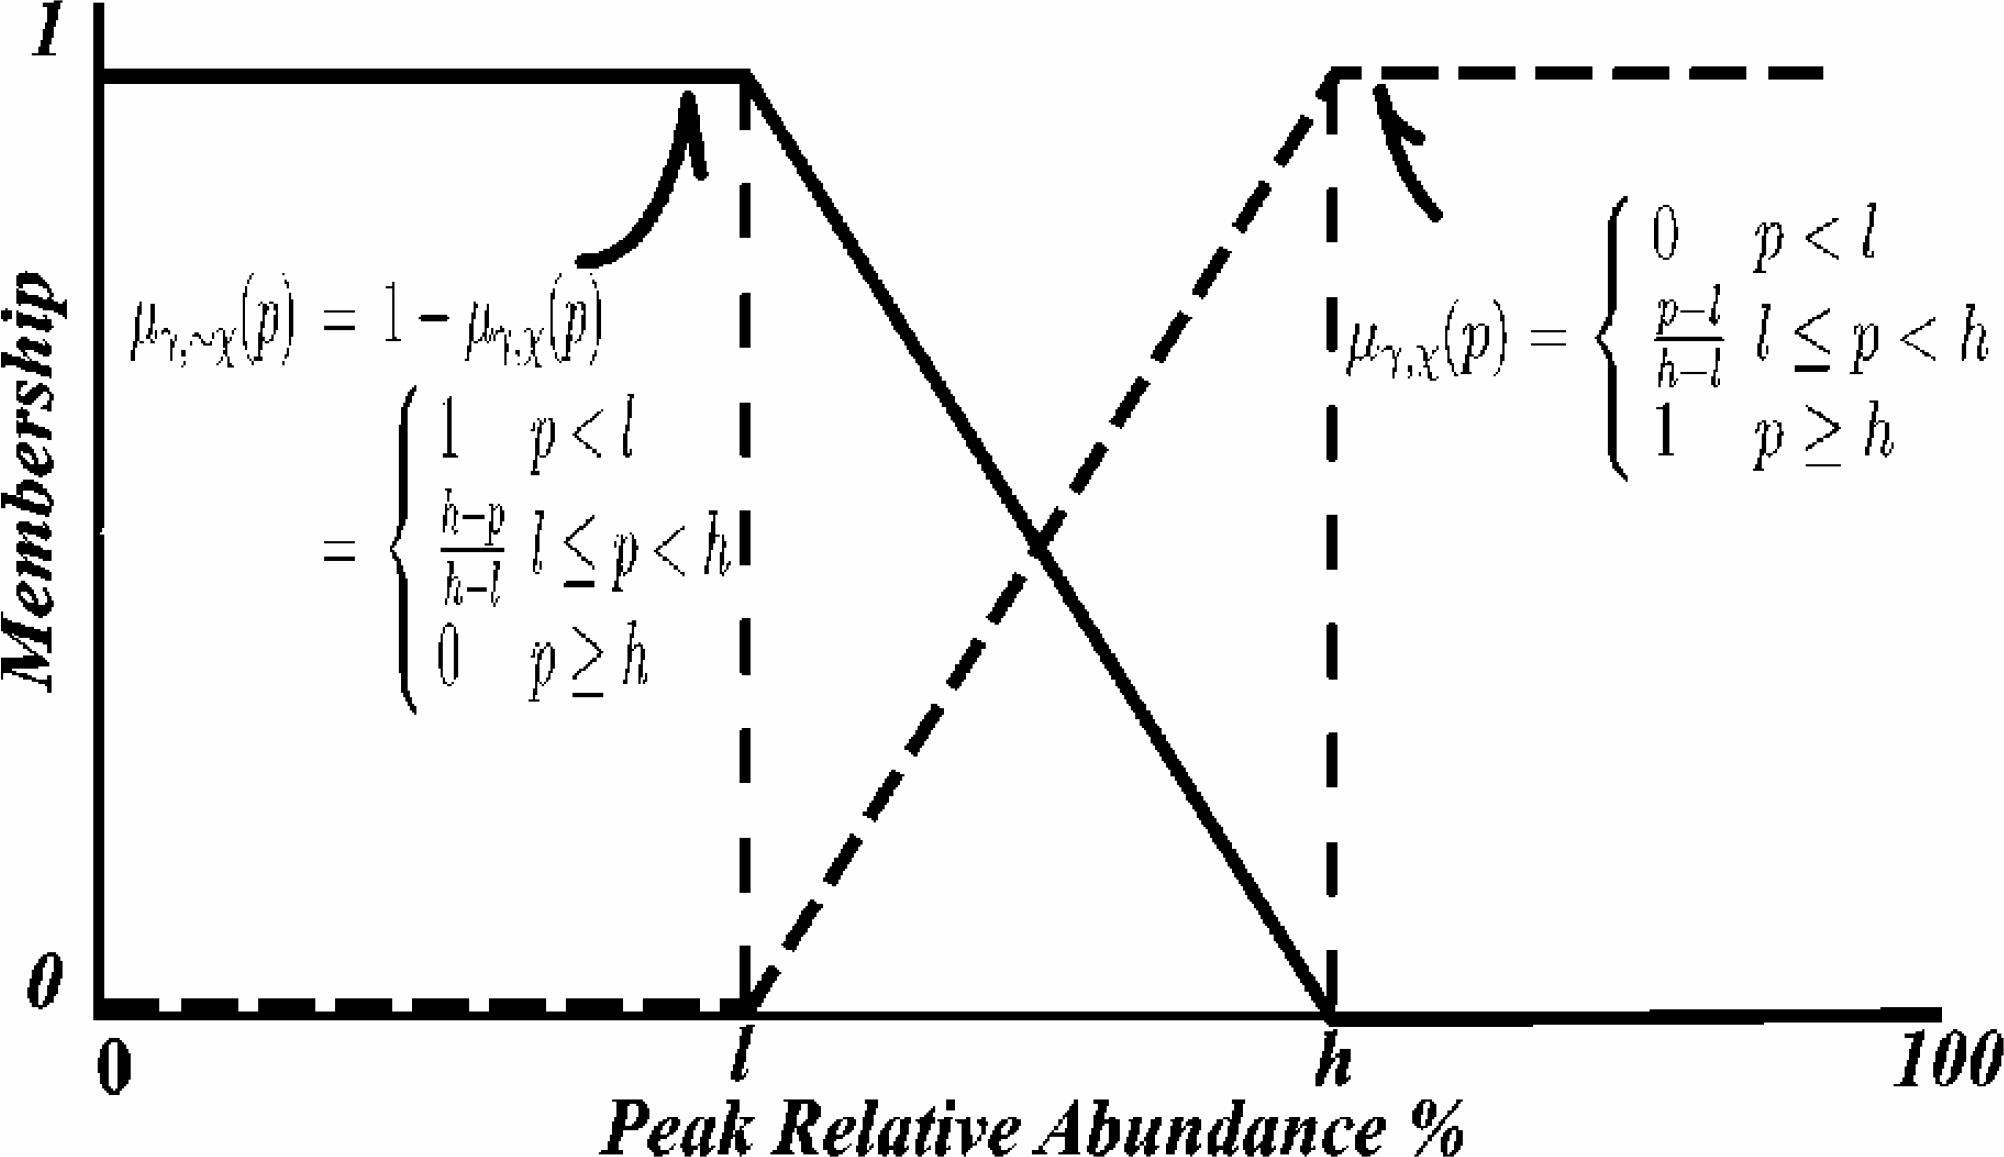
Combine the required peaks membership using fuzzy logic “AND”s (^) and “OR”s (V). A ^ B -> u(A) X u(B) A V B -> u(A) + u(B) - u(A) X u(B).
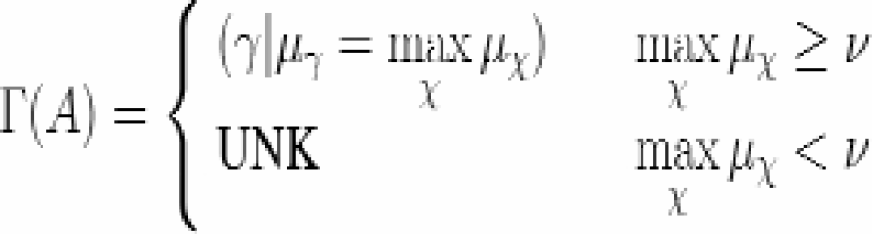
A hard classification is found by determining the maximum membership classification if
it is over the a minimum threshold. If it is below the threshold it is considered
unknown. (Equation 1)
A rule base for classifying mineral phases of basalt is shown below in Table 1.

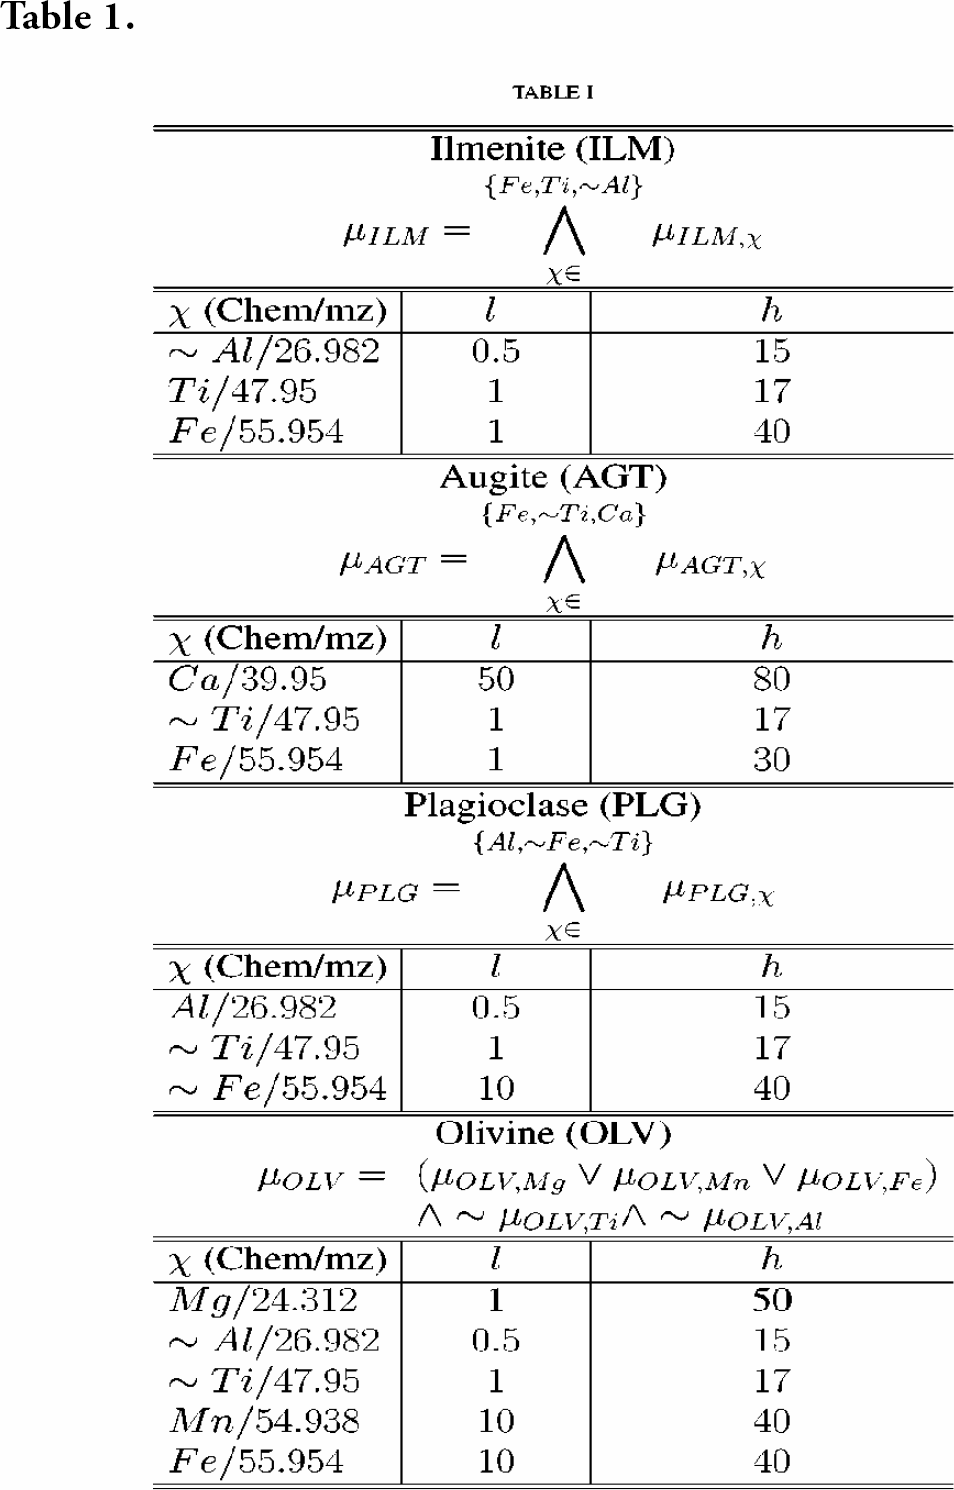
Typical threshold value is 0.5.
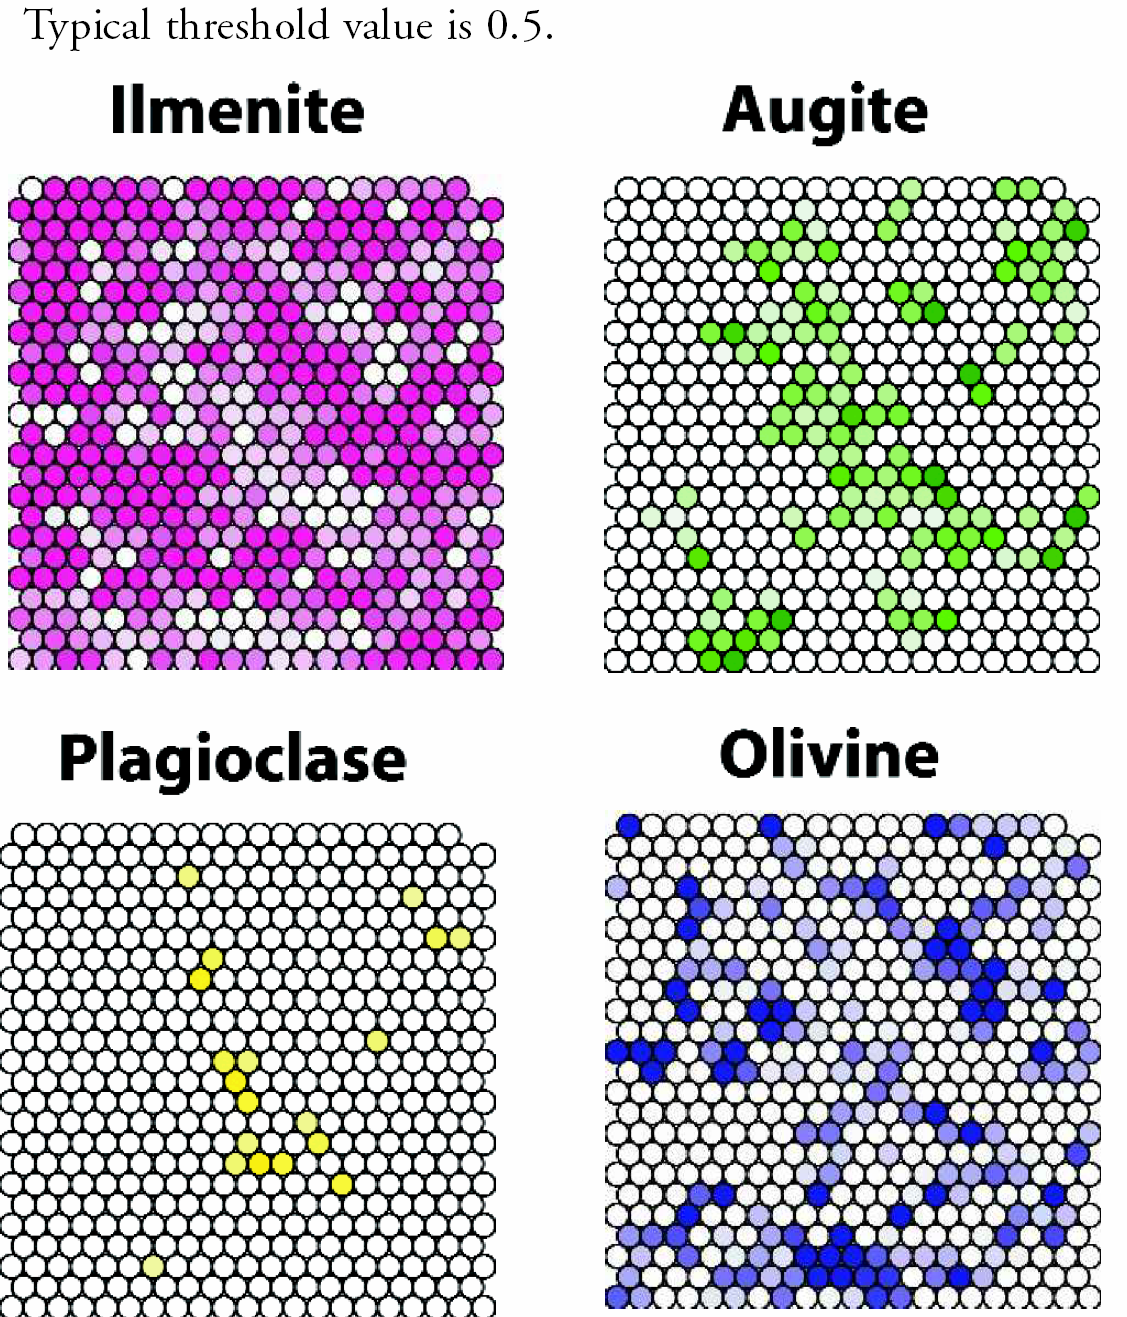
Results for individual mineral memberships are given in Figure 6. Combined hard classification results presented in Figure 7.
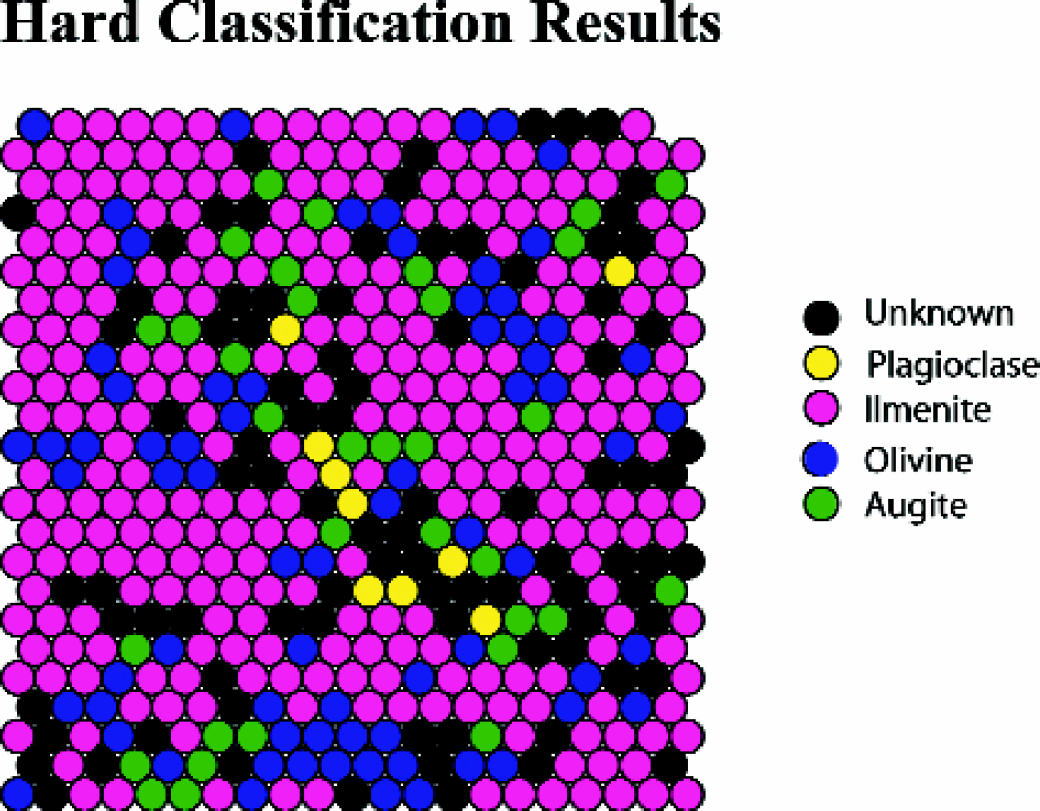
Inference engine results for hard classification.
NEAREST NEIGHBOR METHOD
For applications where unknowns are not permissible, we use neighbors to help determine membership.
A membership value of the spot plus the average of the adjacent spots is used to find an alternate membership. (Figure 8)
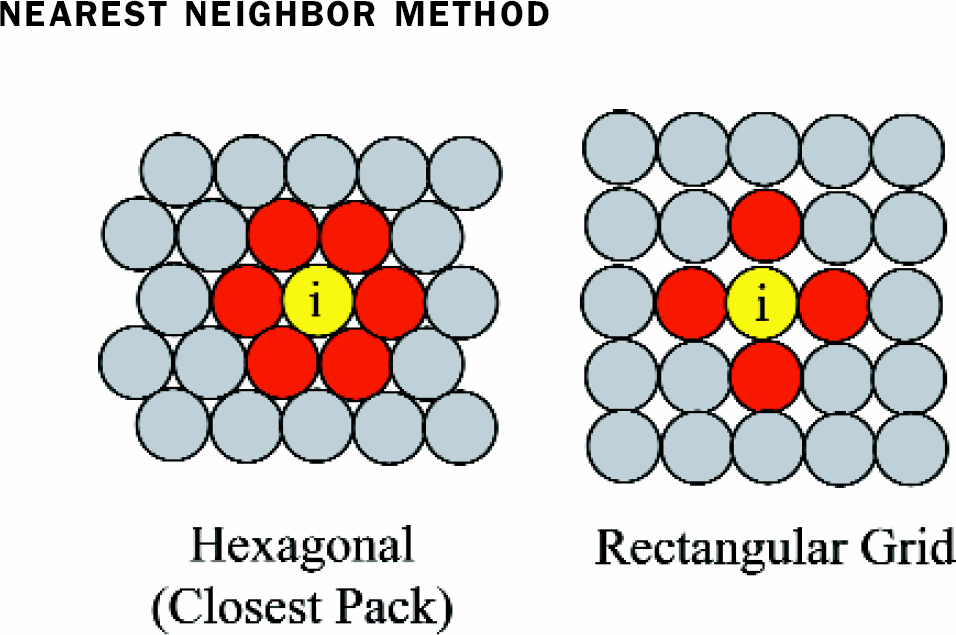
Illustration of possible neighbors around indeterminate spot.
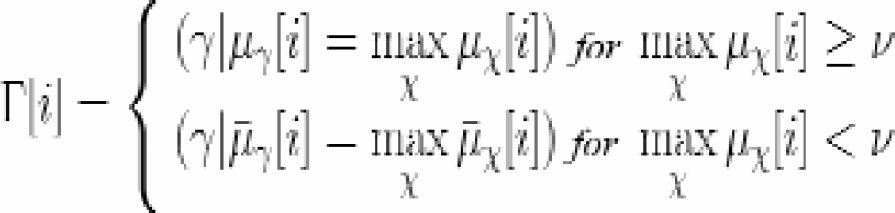
The maximum membership then determines the classification according to Equation 2.
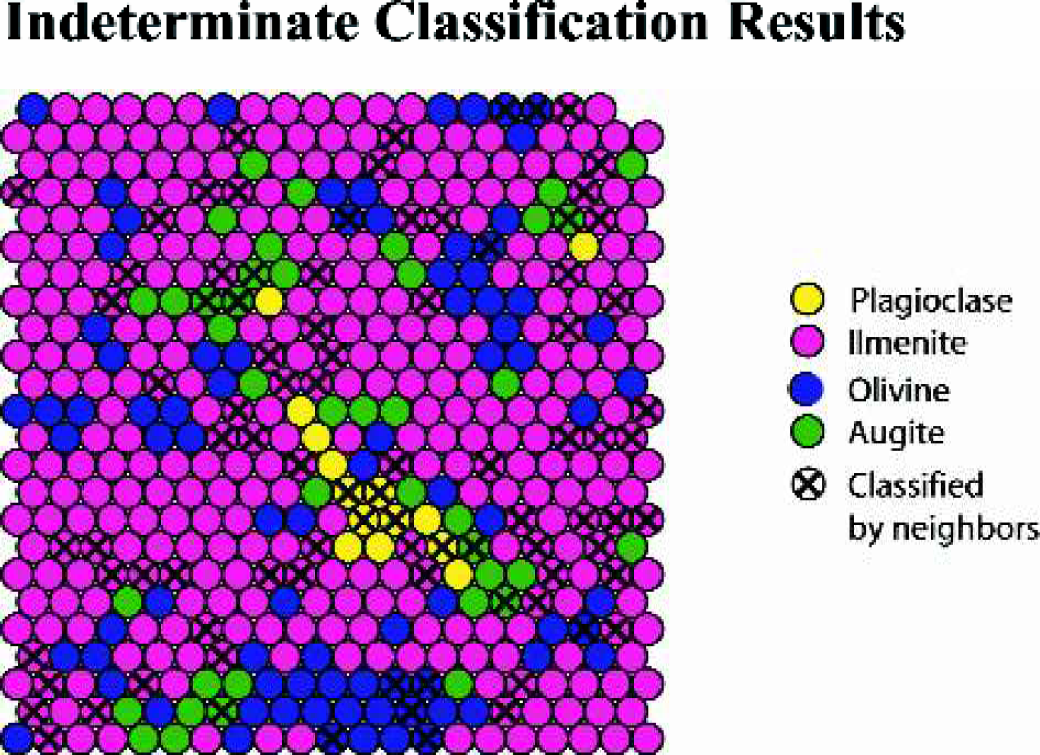
Inference engine results using nearest neighbor method.
Figure 9 shows the results after including nearest neighbor classification of unknowns.
Conclusions
Simple, user friendly method for classifying large volumes of mass spectra.
Includes flexibility for handling “don't care” ions for individual classifications.
Nearest neighbor method used to assign indeterminate pixels.
Automatic interpretation of mass spectra provides time and cost savings.
Future Directions
Addition of a second inference engine that generates the fuzzy rule base from knowns is in development.
Footnotes
Acknowledgments
The authors gratefully acknowledge funding from the United States Department of Energy under contract number DE-AC-07-99ID13727 BBWI.