
Abstract
Evaluating changes in gene expression is essential when identifying and validating new drug targets, however, the methods used to measure transcription are laborious, time-consuming and expensive (e.g., RT-PCR, microarray or northern blot). High Performance Signal Amplification (HPSA™) gene expression assays quantitate particular mRNA targets directly in cell lysate samples using DNA probe hybridization and fluorescent signal amplification. The assay format eliminates the need for RNA purification prior to testing and does not require RT-PCR amplification. The HPSA™ protocol involves three steps carried out at 37°C in 96- or 384-well plates, making the technique amenable to automation. Cellular mRNA levels are quantitated relative to a standard curve consisting of purified in vitro RNA transcripts derived from cDNA clones. Assay sensitivity is in the low attomole range and can detect mRNA expressed at twenty copies per cell. A number of HPSA™ assays have been developed for cytokine, housekeeping and cytochrome P450 messages. Gene induction profiles were monitored in cell lines or peripheral blood mononuclear cells (PBMC) treated with activators such as phorbol 12-myristate-13-acetate (PMA), ionomycin or phytohemagglutinin (PHA). Recent validation studies demonstrated IL-9 mRNA induction in primary cultures of T-cells treated with PMA and anti-CD3. Similar testing with PBMCs showed significant IL-13 mRNA induction after 48 hours of treatment with PMA, thymosin and staphylococcal enterotoxin. Cytokine STATE® panels are being constructed according to functional categories such as innate or adaptive immunity to better characterize changes in transcription patterns during an immune response. The HPSA™ gene expression assays offer a rapid and convenient alternative to more cumbersome, expensive methods.
Introduction
Rapid, reproducible methods to quantitate the expression of certain families of genes can facilitate drug development efforts in target selection and validation, toxicity and metabolism studies and compound library screening. 1 To address this need, cytokine and chemokine gene families and the cytochrome P450 (CYP) drug metabolizing enzyme (DME) genes have been the focus of the development of HPSA™ gene transcription assays.
HPSA™ assays have been developed in single target formats and as functional panels that measure multiple mRNA targets simultaneously (Simultaneous Transcriptome Analysis of Target Expression, STATE®). HPSA™ assays utilize specific DNA probes and fluorescent signal amplification to specifically quantitate the transcription of genes from cell lysates without prior RNA purification. The simplicity of the sample preparation and the assay procedure allows for use in high throughput screening. See Figure 1.
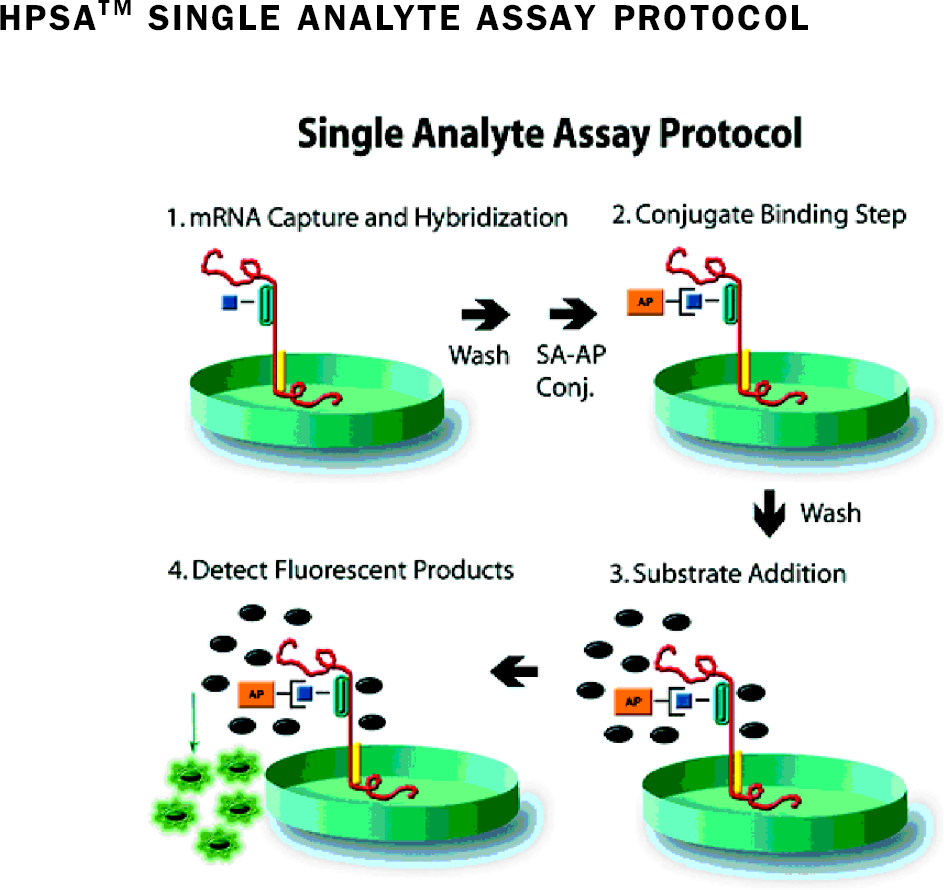
HPSA™ Gene Expression Assay Protocol mRNA is released from cultured cells and hybridized to a capture probe covalently attached to wells of a 96- or 384- well plate. Biotinylated detection probe, specific for the target mRNA, is added and the reaction is incubated for one hour at 37°C. After washes to remove nonhybridized probe, the captured, specific probe is detected using a streptavidin alkaline phosphatase and Starbright™ Green™ fluorogenic substrate. Flourescence is measured using a microplate fluorometer equipped with an appropriate filter set.
STATE® arrays have been developed to measure the induction of rat and human CYP genes in primary hepatocytes in response to xenobiotics. Drug metabolism data collected early in the drug development process can lead to insights regarding promising candidates that could alter the progression of a candidate to the next phase of development.
Panels of cytokine targets for STATE® arrays have been designed according to the cytokine's involvement in the innate and/or adaptive immunity response and whether the cytokines are involved in Th1 or Th2 response. 2 Several cytokine arrays have been used to measure gene induction in primary PBMCs and in established cell lines. Cytokine gene expression profiles are of interest not only in the research community but also for developing new therapeutics to treat pathological conditions of the immune response such as inflammation, allergy, infection and autoimmune diseases. 2 –5
Results
HIL-9 STANDARD CURVE
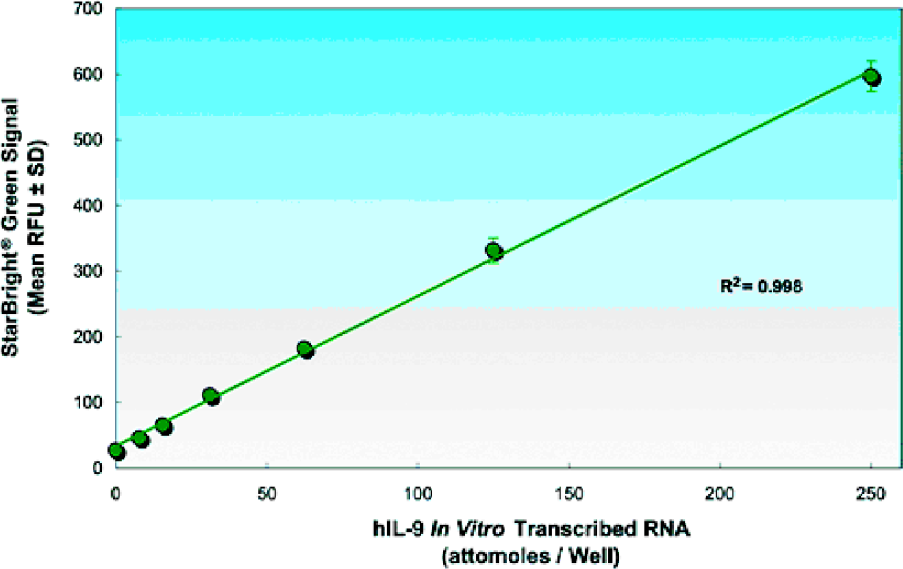
The IL-9 standard curve was generated by measuring known concentrations of in vitro transcribed (IVT) IL-9 RNA in the HPSA™ assay. Sensitivities in the low attomole (10–18 mole) range are routinely achieved.
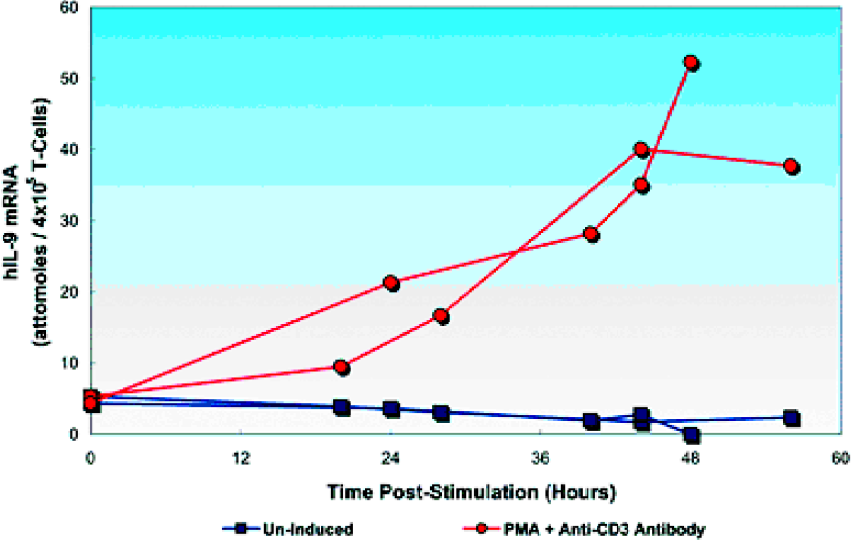
HIL-9 INDUCTION
To measure the induction of the human Interleukin 9 gene (IL- 9), primary, normal human PBMCs were isolated by density sedimentation of fresh “buffy coat” cells (San Diego Blood Bank) through Histopaque 1077 medium. PBMCs were cultured overnight and CD4+ T-cells were isolated using a T-cell isolation kit (Miltenyi Biotec MACS, Auburn, CA). Enriched T-cells were untreated, or stimulated with 5 ng/mL PMA and 10 μg/mL anti- CD3 antibody (Clone #UCHTI MAB100, R&D Systems, Minneapolis, MN). The cells were harvested at the times indicated and lysed with HPSA™ Hybridization Buffer. Whole cell lysate samples at 4×10⁵ cell equivalents per 100 μL were assayed for hIL-9 mRNA.
The human IL-9 gene was induced over twelve-fold from aproximately 4 to over 50 attomoles per 4×10⁵ cells by PMA and anti- CD3 antibody at 48 hours post-treatment. Results of two separate experiments are shown in Figure 3.
Induction of human interleukin IL-9 in CD4+ T-cells.
Gene expression profiles of multiple targets by HPSA™.
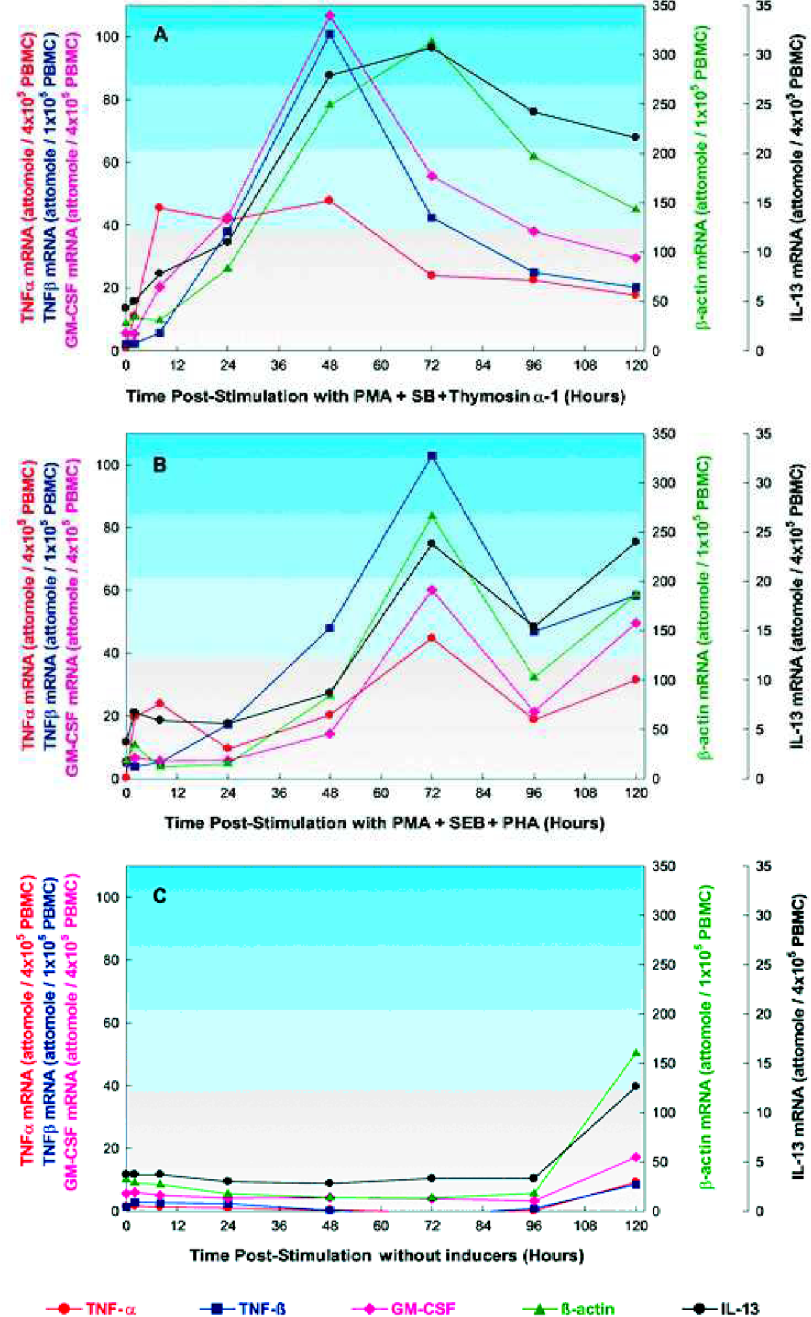
MULTIPLE TARGET INDUCTION PANEL
Primary, normal human PBMCs were isolated as described. Cells were cultured overnight, then stimulated with 10 ng/mL PMA and 1 μg/mL SEB and 1 μg/mL thymosin α-1 (Panel 4A), or stimulated with 25 ng/mL PMA and 1 μg/mL SEB and 2 μg/mL PHA (Panel 4B), or untreated (Panel 4C).
The cells were harvested at the times indicated and lysed with HPSA™ Hybridization Buffer. Lysate samples at 4 ×10⁵ cell equivalents per 100 μL were assayed for TNF-α, GM-CSF, and IL-13 mRNA. Samples at 1×10⁵ cell equivalents per 100 μL were assayed for TNF-β, and β-actin mRNA.
When stimulated with PMA, SEB, and thymosin α-1 (Panel 4A), PBMC expression of TNF-α mRNA reached a maximum by 8 hours and declined by 72 hours post-stimulation. The TNF-β and GM-CSF mRNA reached maximum expression by 48 hours after stimulation and quickly declined. IL-13 and β-actin mRNA reached high levels by 48 hours and didn't decline significantly until 96 hours post-treatment.
When stimulated with PMA, SEB, and PHA (Panel 4B), all of the genes reached maximum expression 72 hours after stimulation. In addition, the TNF-β and IL-13 mRNA levels showed increased expression between 2 and 8 hours post-treatment.
No significant changes in gene expression were evident up to 96 hours in cultures without treatment (Panel 4C).
PROBE SPECIFICITY: HIL-12
The specificity of each probe used in either HPSA™ or STATE® formats is tested by measuring its reactivity in a panel of related IVT RNAs. As an example of a typical specificity analysis, Figure 5 shows the results of testing the IL-12 p40 probe against a panel of cytokine IVT RNAs (500, 250 and 125 attomoles), encoding IL-1b, IL-2, IL-4, IL-6, IL-8, IL-9, IL-12 p35, IL-12 p40, and IL-13. The results show specific hybridization only with the appropriate IVT.
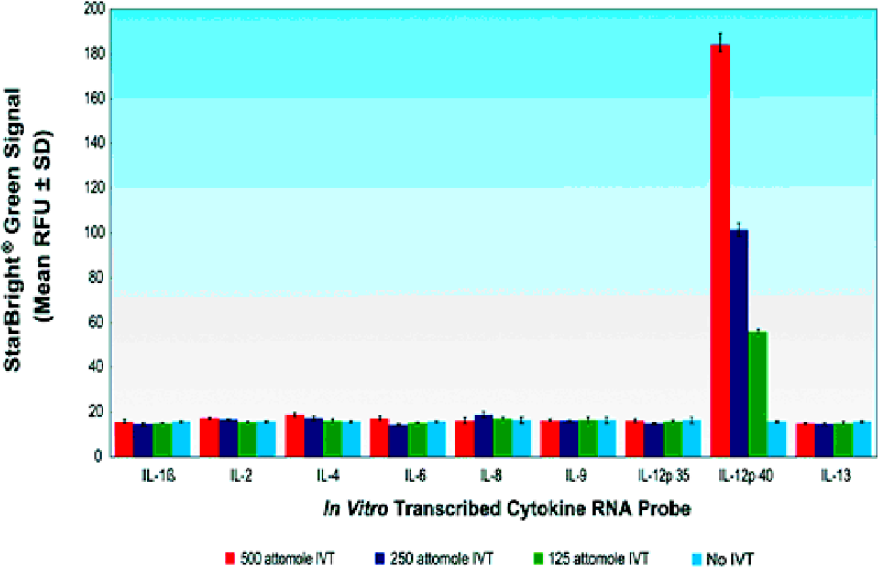
Specificity of IL-12p40 Probe.
TYPICAL HUMAN DME STATE® 96-WELL TEMPLATE
The expression of two “housekeeping” genes (β-Actin and GAPDH) and five cytochrome P450 mRNAs, CYP1A2, CYP2C9, CYP2C19, CYP2E1 and CYP3A4 can be analyzed in this 96-well plate format as shown in Figure 6. Standard curves, located in columns 1 through 4 and rows A through D are used for mRNA quantitation of unknown samples. This plate format permits the quantitation of 7 target mRNAs from 4 duplicate cell lysates simultaneously.
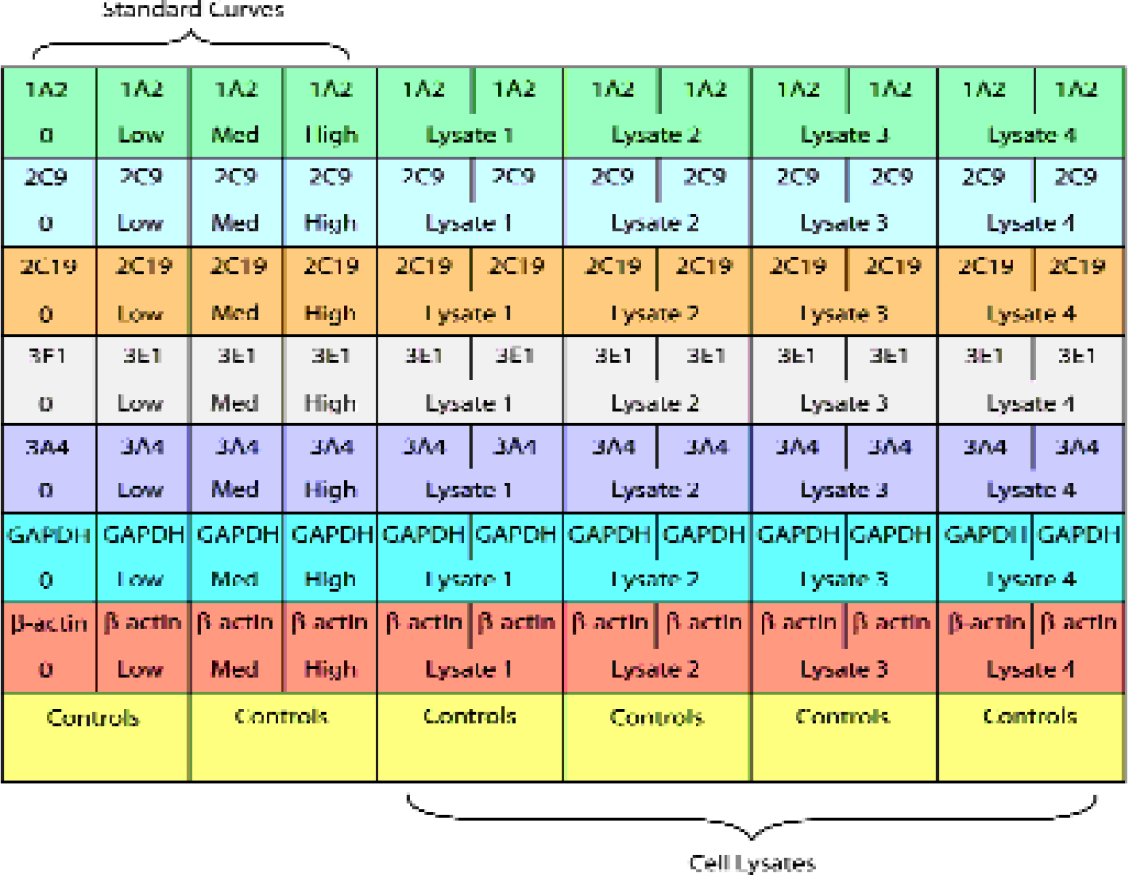
Typical Human DME State® 96-Well Template.
EXPRESSION OF MULTIPLE CYP IN PRIMARY HUMAN HEPATOCYTES IN RESPONSE TO XENOBIOTICS
The mRNA expression of CYP1A2, CYP2C9, CYP2C19, CYP3A4, and β-actin was measured simultaneously using the Human DME STATE® 96-well microplate assay in lysates from primary human hepatocytes treated with 750 μM phenobarbital (PB) or 33 μM rifampicin (RIF). Cells were harvested at the indicated times and lysates were analyzed with the Chromagen Human DME STATE® assay. The mRNA levels for CYP3A4 increased several fold in response to both PB and RIF. Phenobarbital and rifampicin also induced expression of CYP2C9 and CYP2C19. CYP1A2 was not induced under these experimental conditions. The mRNA levels of β-actin were relatively unchanged during the PB and uninduced time course, while treatment with RIF appeared to decrease the level of β-actin mRNA following 24 hours of incubation.
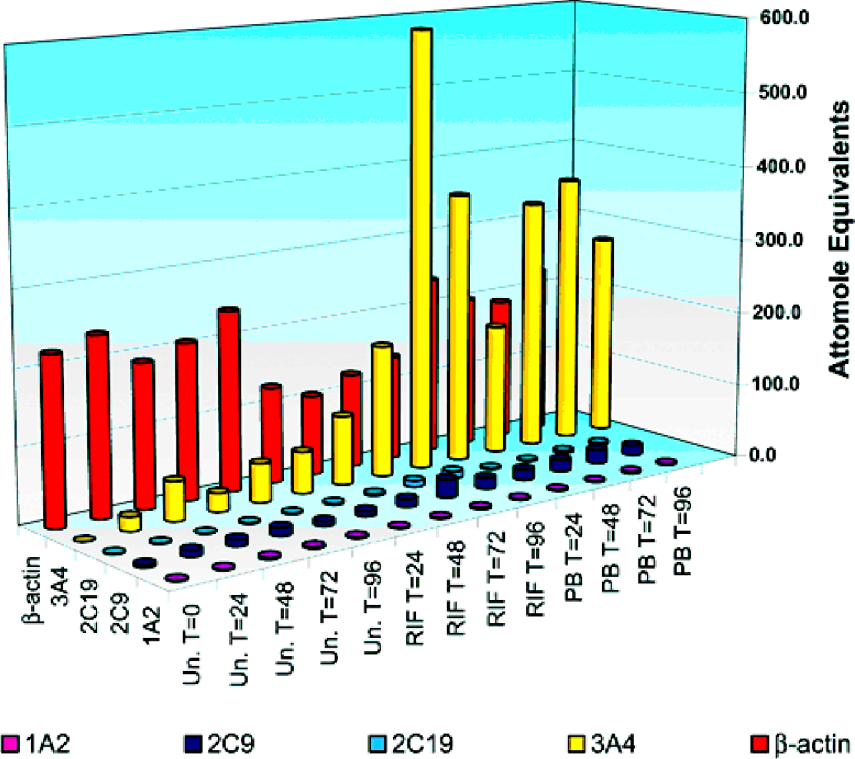
Expression of Multiple CYP in Primary Human Hepatocytes in Response to Xenobiotics.
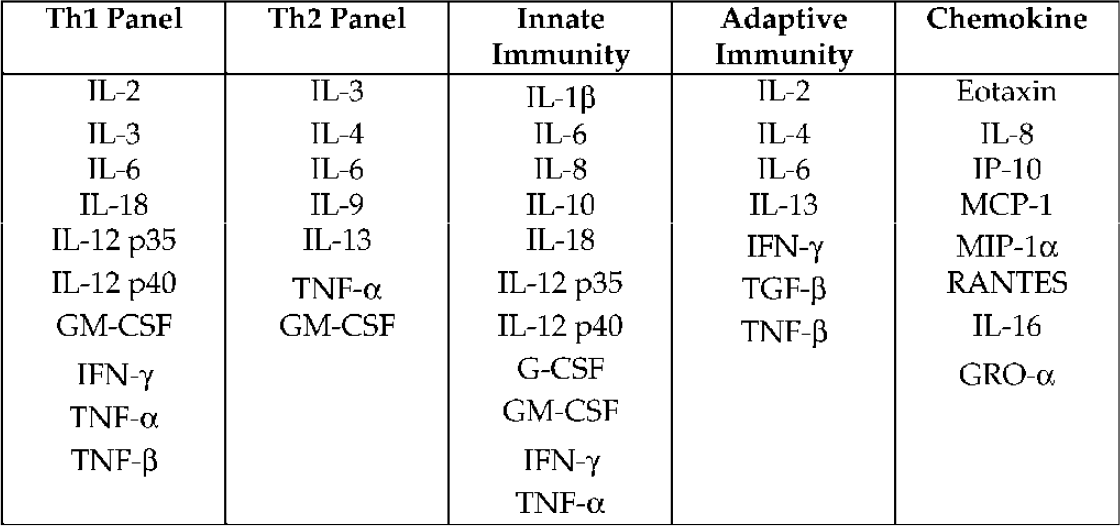
CYTOKINE STATE® PANELS
Table 1s shows cytokines grouped according to their functions as Th1 or Th2 responders, and their involvement in innate (cellular) immunity or adaptive (humoral) immunity. A panel of chemokines is also included. HPSA™ (single target) or STATE® HPSA™ assays (multiple target) can be constructed for each of these panels to monitor the expression of these genes from cell lysates in response to stimuli. Custom arrays can be designed incorporating these or other gene targets. “Housekeeping” or control gene expression assays are also available for measuring GAPDH, β-actin, and 36B4, a ribosomal protein, and can be incorporated into any array.
Summary
Rapid, automatable HPSA™ assays have been developed to measure gene transcription directly from cell lysates.
STATE® arrays of cytokines and drug metabolizing enzymes have been used to measure multiple mRNA targets in the same assay. Custom STATE® panels are easy to construct from existing HPSA™ assays.
HPSA™ and STATE® assays are highly sensitive: Detection of low copy number targets can be achieved.
HPSA™ and STATE® assays are critical tools that can be used for target validation, compound screening, and toxicity testing.