
Abstract
We describe the development of a custom system for reading 2-D DataMatrix bar codes imprinted on the base of tubes stored in a rack. The system software drives a standard flatbed scanner in order to acquire an image, interprets DataMatrix bar codes at predefined locations in the image, and returns in an array the interpreted bar code data along with other associated information. Commercial software components were used for the image acquisition and bar code interpretation portion of the software. An example is given that illustrates how to call the custom software from Microsoft® Excel and insert the returned data directly into a spreadsheet.
Introduction
Tracking a large number of tubes in an automated laboratory is a challenging task. Traditional linear bar codes applied to the side of tubes can be of substantial help when the tubes are not stored in a rack. Unfortunately, when large numbers of tubes are stored and handled in racks, the use of linear bar codes is cumbersome. Scanning a tube's linear bar code requires that one remove the tube from the rack, scan its bar code, and then replace it when the scan is complete. This process is slow, labor-intensive, and can result in errors if a tube is mistakenly placed in the wrong rack location. Another approach widely used for tracking racked tubes is to identify a tube by a combination of the rack's bar code and the position of the tube in the rack. This approach falls apart when the rack is used in an improper orientation or an accident occurs that results in the tubes spilling out.
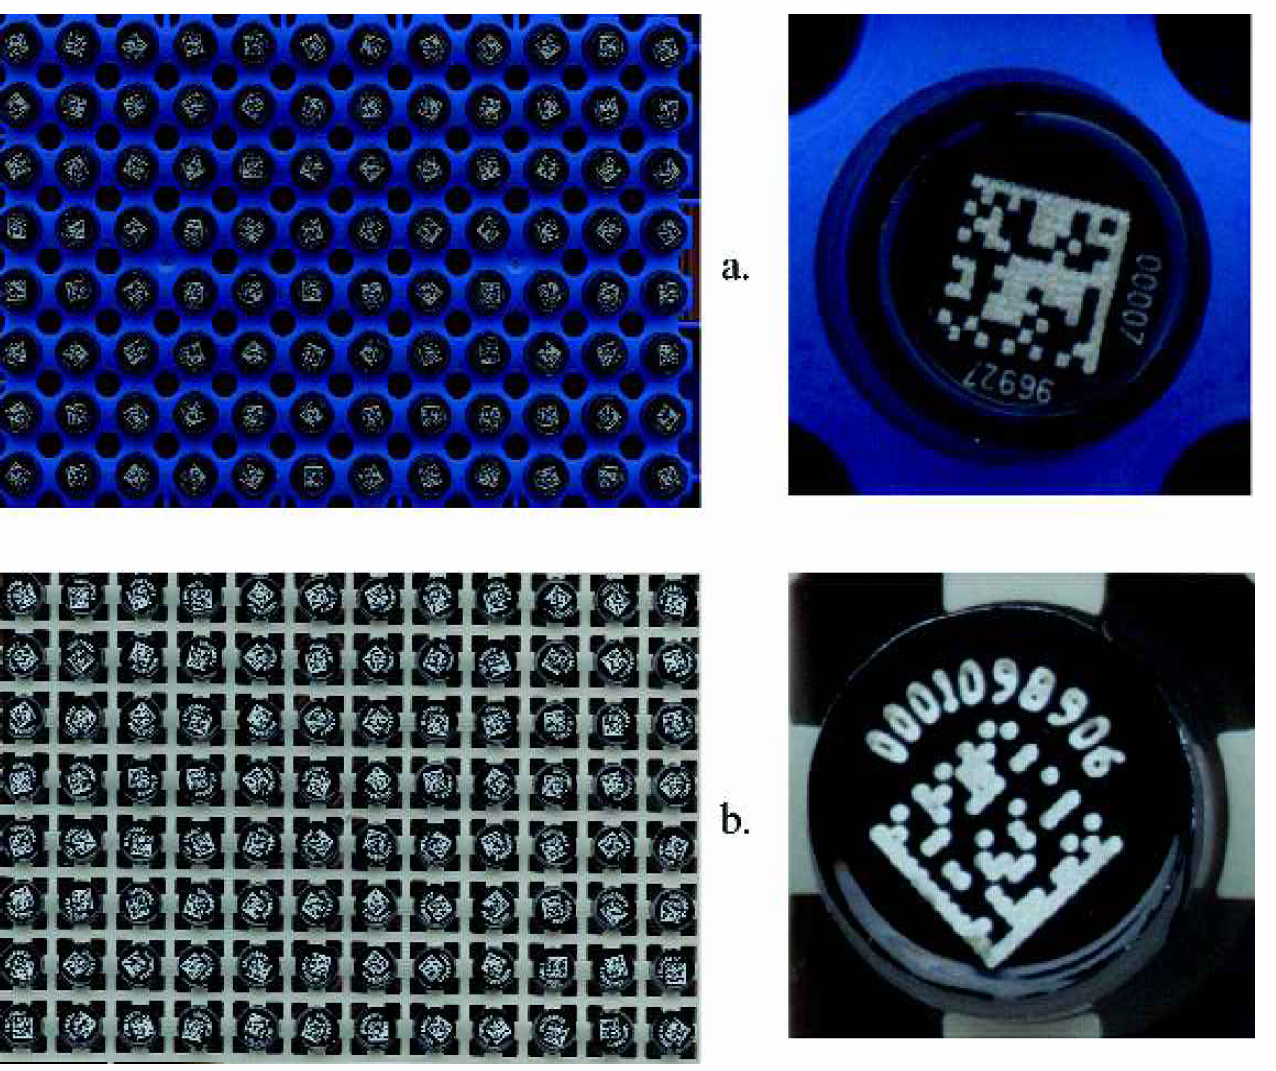
A superior approach to tracking racked tubes in an automated laboratory is to label each tube with a bar code and store them in a rack in such a way that allows all bar codes to be read at once while remaining in the rack. This is possible with several compact two-dimensional (2-D) matrix bar code symbologies, most notably the DataMatrix symbology (see Figure 1). 1 DataMatrix is becoming the de facto standard for labeling the bottom of tubes. For this reason we focussed our efforts exclusively on this symbology. DataMatrix bar codes are sufficiently compact to be applied to the bottom of a single tube, so that when stored in an appropriately configured rack, all bar codes can be read at once without the need to remove them from the rack. This is true even for tubes small enough to be held by a 96-position rack that fits in the footprint of a standard microplate. 2 Several vendors offer such tubes with appropriate racks in a variety of materials and 2-D bar code symbologies. The examples shown in Figure 2 is available from BD Biosciences and Apogent Discoveries.

A DataMatrix Bar Code.
There are very few additional examples of the use of 2-D bar codes in the laboratory. Perhaps the most notable is the use of DataMatrix bar codes by Discovery Partners International as a method for tracking reactors in the IRORI NanoKan Ultra High Throughput Synthesis System. 5
Several vendors manufacture devices that read 2-D bar code symbologies. These devices come in a variety of configurations. For example, WelchAllyn makes a handheld device that can read single DataMatrix bar codes as well as standard linear bar code symbologies. This device easily reads tubes with DataMatrix bar codes printed on the bottom. It will transmit bar code data through an RS-232 port or it can function as a keyboard wedge, transmitting data directly to the keyboard port as if typed on the keyboard. Also available are benchtop 2-D bar code readers capable of reading entire racks of bar coded tubes. Typically, these are comprised of a combination of an image capture device and software to both drive the device and decode bar codes embedded in the resulting image. Image capture devices employed for this purpose include a standard flatbed scanner and a camera.
While it is important to be able to read single 2-D bar coded tubes, from the perspective of an automated laboratory it is more important to have the ability to read entire racks of tubes at once. At the time of our investigation, the available commercial devices for reading racks of 2-D bar coded tubes did not meet our needs. For example, the commercial readers generally were not able to reliably read tubes from other vendors; we did not want to be locked into purchasing tubes from a single vendor. Also, the commercial readers were configured with a fixed number and layout of tube racks to be read; we wanted more flexibility. Finally, the software component of the readers were designed to be run as standalone applications, with little or no ability for integration into larger systems through popular software integration technologies. It is of considerable importance to us that we be able to drive the reader directly from programs such as Microsoft Excel®7 through an ActiveX programming interface. 8 For these and other reasons we decided to build our own 2-D bar code reader for tube racks.
In what follows we describe in detail the custom 2-D bar code reader that we built. Source code, the compiled library, and other information is available for download from http://labautomation.org/JALA/JALA7.6.html.
BAR CODE SYMBOLOGIES
Two-dimensional matrix bar code symbologies have greater data densities and are composed of more complicated patterns than linear bar codes and thus require more sophisticated data encoding and image interpretation technologies. The microtubes we use employ the DataMatrix 2-D symbology, one of more than twenty 2-D symbologies available today. 1 A DataMatrix symbol is a variable-sized symbology capable of encoding all 128 ASCII characters. One to as many as 2,335 alphanumeric characters can be encoded along with error correction information. Six different encoding variants are available, including an efficient numeric method, which stores two numeric characters per byte. The DataMatrix symbol consists of data cell arrays contained within a framing pattern. This pattern is composed of two solid lines and a square-space pattern, which is used to determine the scale and orientation of the symbol. The DataMatrix symbol printed on our microtubes is a 2.5 millimeter square with 12 rows and columns that contain a ten digit number. DataMatrix was invented by RVSI Acuity CiMatrix 9 and placed in the public domain in 1994. It is now an open standard. 10
IMAGE CAPTURE DEVICES
Linear and stacked-linear bar codes are scanned with a moving visible laser beam that is absorbed by the black bars and reflected by the white spaces in a bar code pattern. A single photodetector is used to sense the reflected beam and feed the decode circuitry that interprets the bar code symbol. To read 2-D bar codes it is common to use one of two types of devices, a standard flatbed scanner or a camera.
Flatbed scanners use a linear semi-conductor charge-coupled device (CCD) array that slowly sweeps across the length of the scanner bed capturing many thin image slices. It then assembles these slices into a 2-D image of the entire object plane being scanned. The speed at which the whole image is captured is dependent upon the size of the scanned area and the chosen resolution or number of slices taken per inch. Typical scan speeds using current hardware and common settings run approximately 20 seconds per rack.
Digital cameras use two-dimensional CCD arrays and thus capture images in a single acquisition at rates that can exceed ten frames per second. Although digital cameras are much faster than flatbed scanners, the cost of high speed data interfaces as well as packaging and lighting make digital cameras prohibitively expensive for all but very high throughput applications.
A 2-D bar code imaging device must have sufficient image quality to extract enough detail to accurately decode the square matrix pattern. A typical DataMatrix code printed on the bottom of a tube is composed of a 12 by 12 element square matrix with 12 elements spanning 2.5 millimeters. A theoretical minimum of two pixels is required to image each square in the matrix, which translates into an optical resolution requirement of 240 pixels per inch, also known as dots per inch (DPI). To image a rack of 96 tubes at once, where a row of twelve tubes spans 4.5 inches, more than a 1000 pixels are needed.
Cameras are much faster at capturing images than flatbed scanners. With a camera, an image can be captured in a fraction of a second. Flatbed scanners are much slower, taking several tens of seconds to sweep over a region the size of a standard 8 1/2 by 11 inch sheet of paper.
Limited field of view and resolution make it necessary to use a single high-end camera, or multiple cameras, to capture an image that includes all 2-D bar codes on the bottom of the tubes in a standard 96-position rack, which covers an area of about 3 by 4.5 inches. 2 This limits the use of cameras in 2-D bar code scanning applications to those that require very fast data capture. Flatbed scanners are slower, but they can operate at resolutions that are far in excess of what is adequate to decode a DataMatrix 2-D bar code of a size that is typical for tube labeling applications.
For our design we decided to emphasize affordability over speed. As such, the image capture device we chose was an HP ScanJet 7400C series flatbed scanner. 11 Desktop scanners are in wide use and reasonably priced. Most commercially available scanners would be sufficient for our purposes. Figure 3 shows our HP scanner with a custom designed lid capable of holding simultaneously up to six racks. More detail on the lid's design is available for download from http://labautomation.org/JALA/JALA7.6.html.
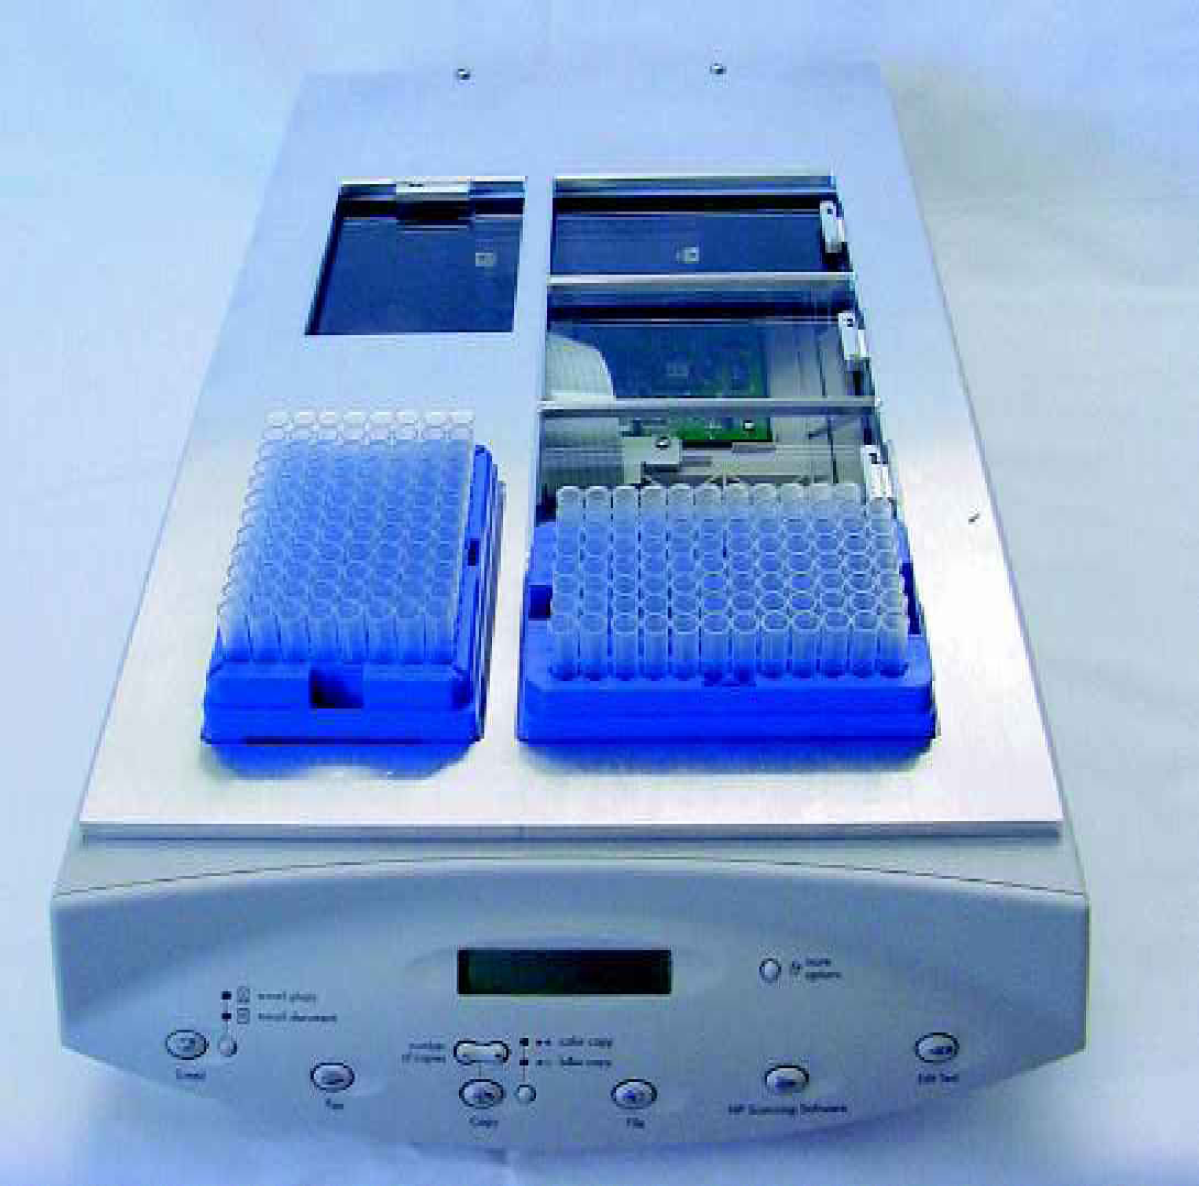
The HP ScanJet 7400C series scanner 11 equipped with a custom fabricated lid that holds six tube racks.
FLATBED SCANNER CONTROL LIBRARY
The vast majority of flatbed scanners can be driven through an electronic interface that implements the TWAIN standard. 12 TWAIN defines a protocol through which software applications can communicate with scanners and other imaging devices.
To drive our scanner we identified a suitable ActiveX 8 library called ObjectTWAIN™ from JFL Peripheral Solutions. 13 The ObjectTWAIN™ ActiveX interface includes routines that can configure and control TWAIN compliant imaging devices as well as save these images to an image buffer or disk file. The ObjectTWAIN™ software development kit (SDK) has a royalty-free run-time license.
BAR CODE INTERPRETATION LIBRARY
Once an image is captured, the next step is to interpret DataMatrix bar codes embedded in the image at locations that correspond to the positions of a 96-well microplate. We chose the ActiveX version of the Matrox Imaging Library (ActiveMIL) by Matrox Electronic Systems Ltd. 14 ActiveMIL includes controls that make it straight-forward to decode DataMatrix and other bar codes embedded in an image. An important feature of ActiveMIL is that it is capable of decoding 2-D bar codes that are imaged in any orientation. This is critical to being able to read bar codes on the bottom of tubes since the orientation of a tube in a rack cannot known be a priori.
The Matrox Imaging Library is far more than a tool for bar code symbol interpretation. It is a full-blown image processing application, including routines for image capture, image display and editing, image analysis including image measurement, optical character recognition, pattern matching, and imaging processing tools such as morphological functions, Fast Fourier transforms, and geometric operations. It is available as a full-featured SDK and a “Lite” version, which offers a subset of the full package. The SDK is primarily used to develop and test an application before compiling into a distributable form. A “hardlock” is required for each computer that will run the SDK. The hardlock is a small device that is used to prevent software piracy. The Matrox Imaging Library will not run unless it finds the device plugged into the computer's parallel or USB port. The compiled application can be installed on an unlimited number of computers, provided that a hardlock is available.
CUSTOM SOFTWARE
While it is possible to use the aforementioned ActiveX controls directly in an appropriate host application, we decided to create a custom software object that hides the majority of the details, but exposes the most important functionality as simplified object methods. Our custom object, called cBarcodeReader, is provided within a custom Microsoft Windows® Dynamic Link Library (DLL), for convenience. The DLL is called DataMatrixBarcodeReader, and can be used by any Windows program that supports the appropriate integration technology. We encoded the DLL using version 6.0 of the Microsoft Visual Basic® programming language. 15
The cBarcodeReader object encapsulates two basic functionalities. The first is to acquire an image using the flatbed scanner, and the second is to read bar codes embedded in the acquired image at predefined locations. It will be no surprise then that the two main cBarcodeReader object methods are named “AcquireImage” and “ReadBarcodes.” The only other method in the custom object is named “CancelAcquireImage,” which can be called in case a malfunction occurs during the image acquisition process. The CancelAcquireImage method was included for completeness; in practice we have never had the occasion to use it. After linking to the DLL and before calling any of the three functions, an instance of the cBarcodeReader object must first be created. This can be accomplished in a way that is appropriate to the programming language in use.
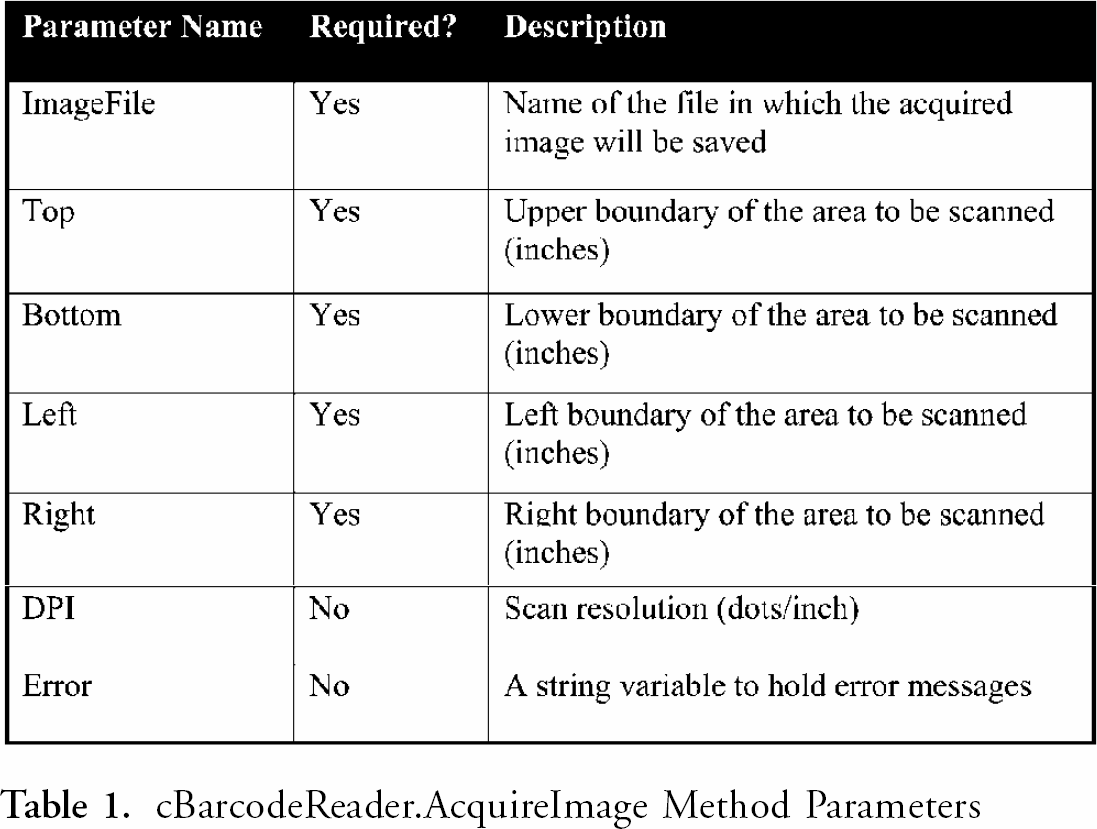
Acquiring an image using a flatbed scanner is simply a matter of calling the AcquireImage object method with the appropriate parameter values. The method has five required parameters and two optional ones. Table 1 describes each parameter. Required parameters include the window within the scanned area to acquire as an image, as well as the name of the file in which the acquired image is to be saved. After the AcquireImage method is called, the flatbed scanner will begin to operate. If the method returns True, the operation was successful. A False value indicates that some error occurred, a description of which will be provided in the optional Error parameter.
cBarcodeReader.AcquireImage Method Parameters
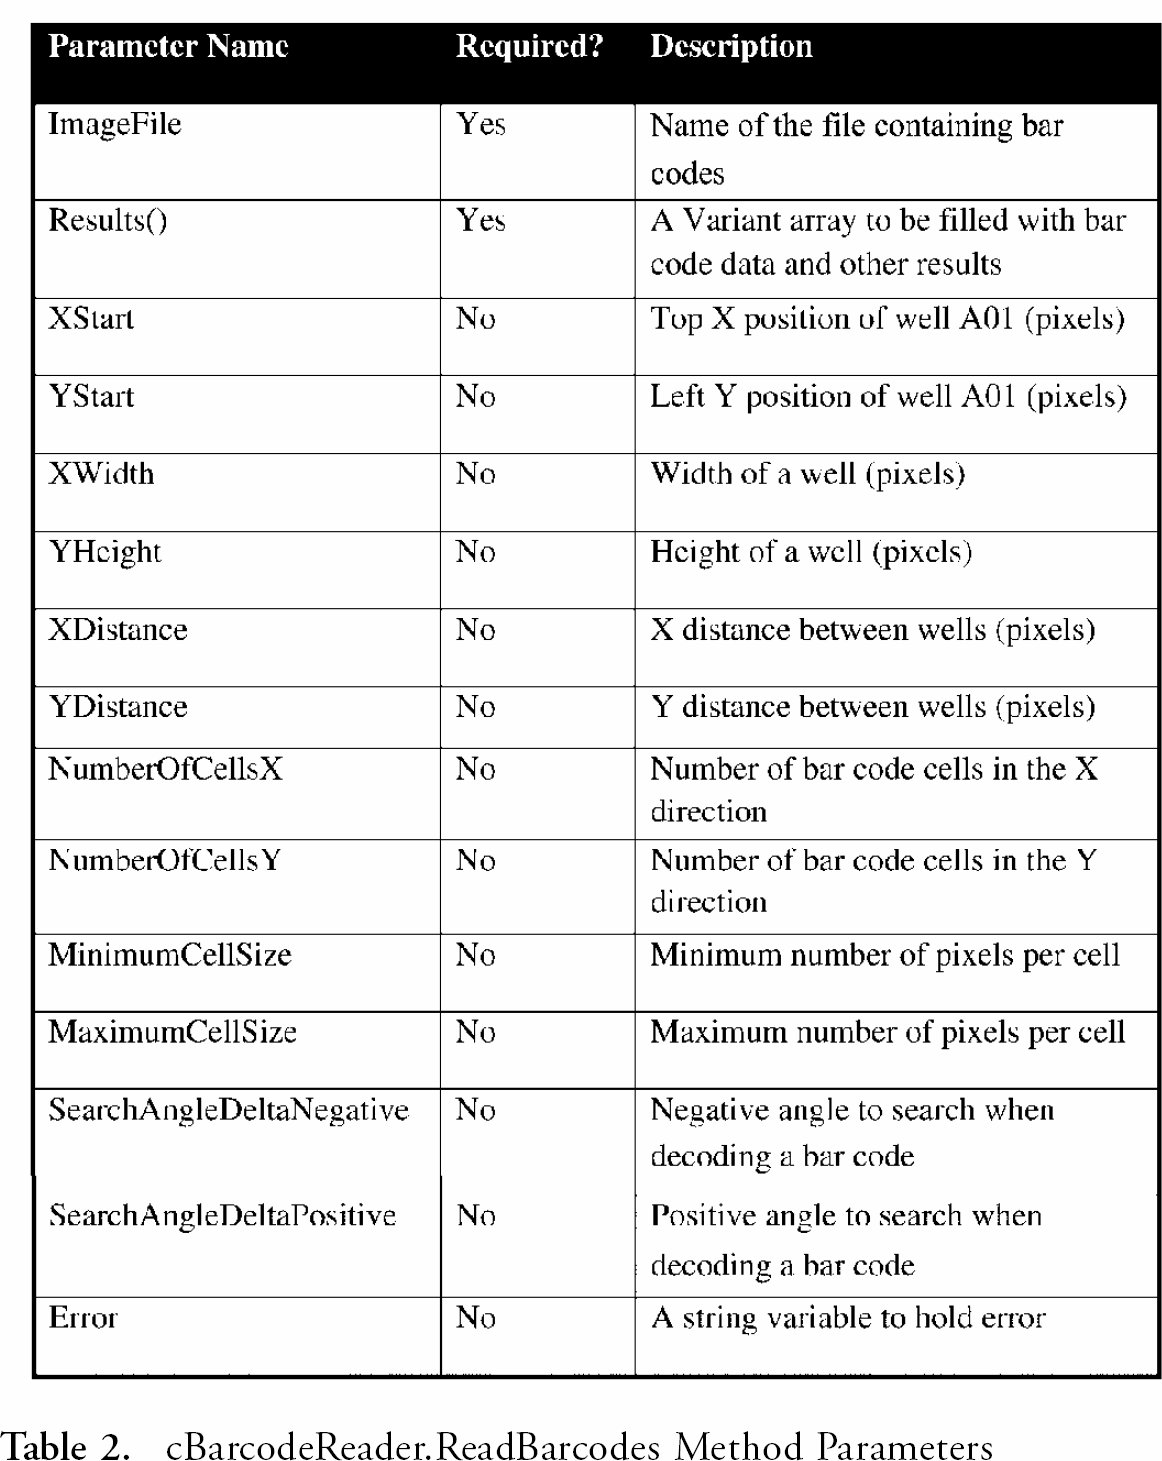
Embedded within the acquired image are the DataMatrix bar codes to be decoded. The ReadBarcodes method will decode the bar codes in the image and return the bar code data in an array along with other results. The method takes two required and thirteen optional parameters (see Table 2). Required parameters include the complete file path and a dynamic array, which upon completion will be resized and filled with bar code and related data. Optional parameters specify the size of the bar code, the number of pixels per bar code cell, and the coordinates at which the bar codes can be found in the image. Our software assumes that there are 96 bar codes to decode, and that they are arranged in a regular 8 by 12 array. Default values for bar code locations indicate that the bar code for well A01 starts at an x-y position of (0,0), and that bar codes are spaced at a regular interval of 141.7 pixels. A value of 141.7 corresponds to 9 millimeters at a 400 dots-per-inch resolution, which is the well-to-well spacing on a standard 96-well microplate. 16 As with the AcquireImage method, ReadBarcodes will return True if successful. A value of False indicates that an error occurred, a description of which will be provided in the optional Error parameter.
cBarcodeReader.ReadBarcodes Method Parameters
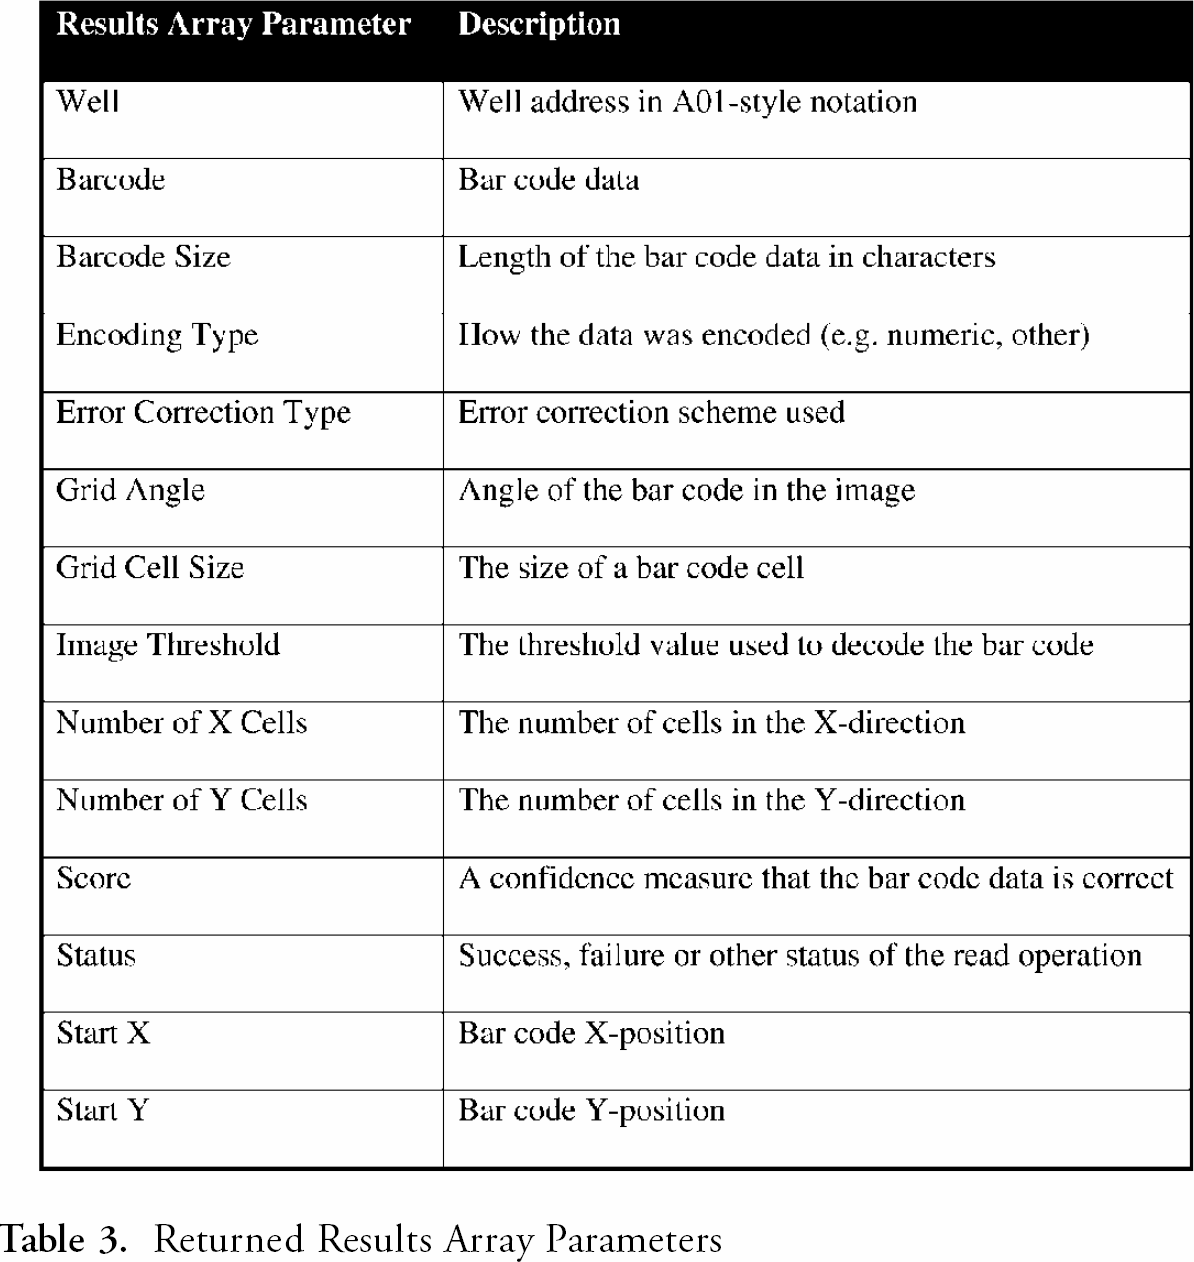
The Results array parameter of the ReadBarcodes method includes more than just the well address and bar code data. In fact, it returns fourteen different values, which are listed and described in Table 3. These values are useful for discovering more about each bar code than just its embedded data value. For example, the Score parameter returns a measure of confidence that the bar code data is correct. This is useful for deciding whether or not to accept the returned bar code data, or if another scan is required at a higher resolution. Refer to the Matrox Imaging Library Version 7.0 User Guide 14 for more details on how Score is calculated.
Returned Results Array Parameters
Using the AcquireImage and ReadBarcodes methods is simply a matter of calling them in succession with the proper parameter values. For example, Listing 1 gives a Microsoft® Excel macro that illustrates the typical calling sequence and parameter values for our flatbed scanner. In this example we acquire images at 400 dots-per-inch and store them in the temporary file named “C:\tmp.bmp.” Well A01 starts at a position of (21,14) pixels, and the well-to-well spacing in the X-direction is set to 137, a value that is smaller than the expected value of 141.7 pixels. This suggests that either our rack's tube-to-tube spacing does not conform to accepted standards, or our scanner slightly distorts captured images in the X-direction. Data collected is inserted directly into the spreadsheet named Sheet1.
These methods also can be used to read tube bar codes in multiple racks simultaneously. To accomplish this, call the AcquireImage method once with parameters that instruct it to acquire an image large enough to cover all bar codes in all racks on the scanner. Then call ReadBarcodes multiple times with parameters that locate each rack within the larger image.
Results
The time it takes to acquire an image using a flatbed scanner increases as the requested image resolution increases. As image resolution decreases, performance of the bar code decoding software will degrade, leading to an increase in read failures. This suggests that there is an optimal DPI scanner setting that allows all bar codes to be decoded successfully, while minimizing scan time. To find the best DPI value we performed a series of experiments.
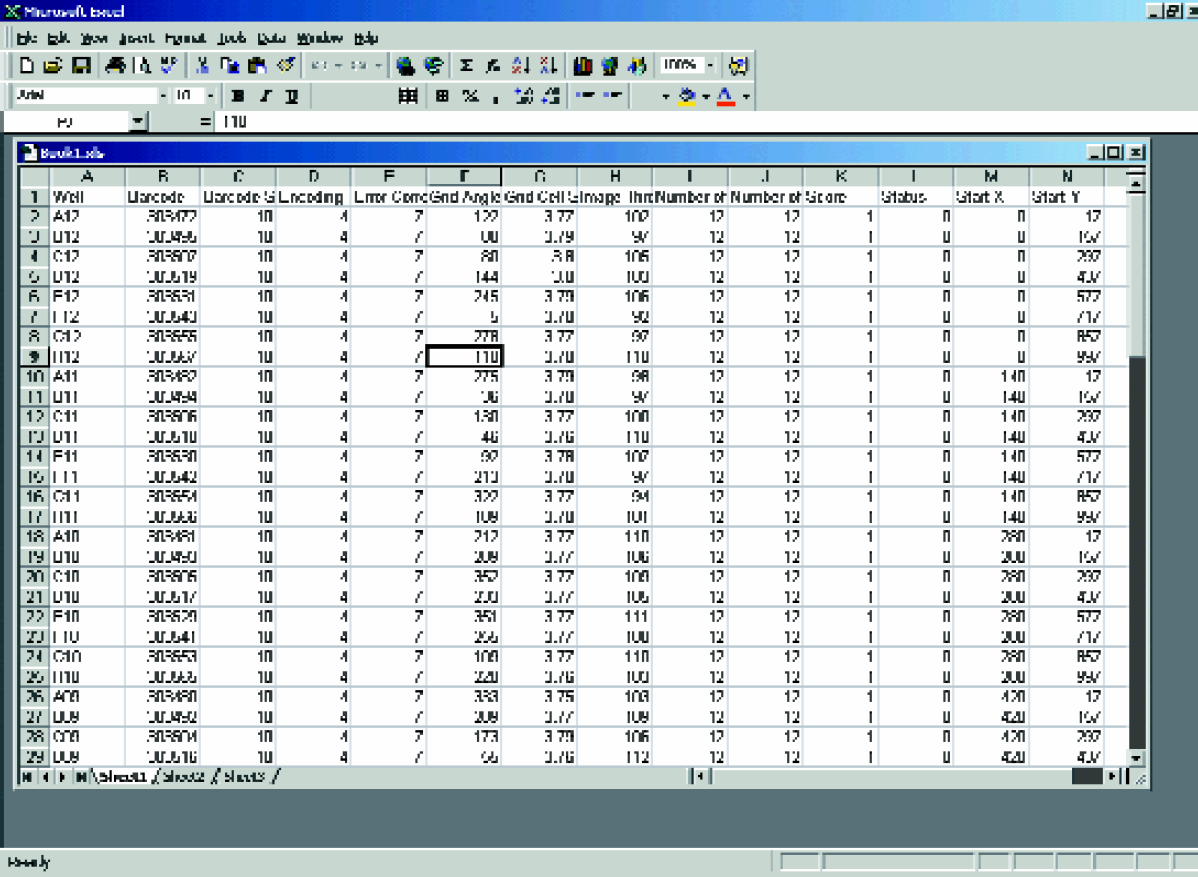
A Microsoft® Excel Spreadsheet after running the macro in Listing 1 on a rack of DataMatrix bar coded tubes.
Two separate racks of 96 empty tubes were each scanned three times using our custom bar code reader at image resolutions that ranged from 200 DPI to 500 DPI. Since the bar codes are opaque, the fact that the tubes were empty is of no consequence. For all scans we used our HP ScanJet 7400C series flatbed scanner controlled by a Pentium III 800 MHz personal computer with 256 MB of RAM running Windows 2000. Data captured includes the duration of each complete scan and the number of bar codes successfully decoded out of the 96 tubes in each rack. The data from all six scans were averaged for each resolution and plotted in Figure 5. Error bars indicate one standard deviation around the average.
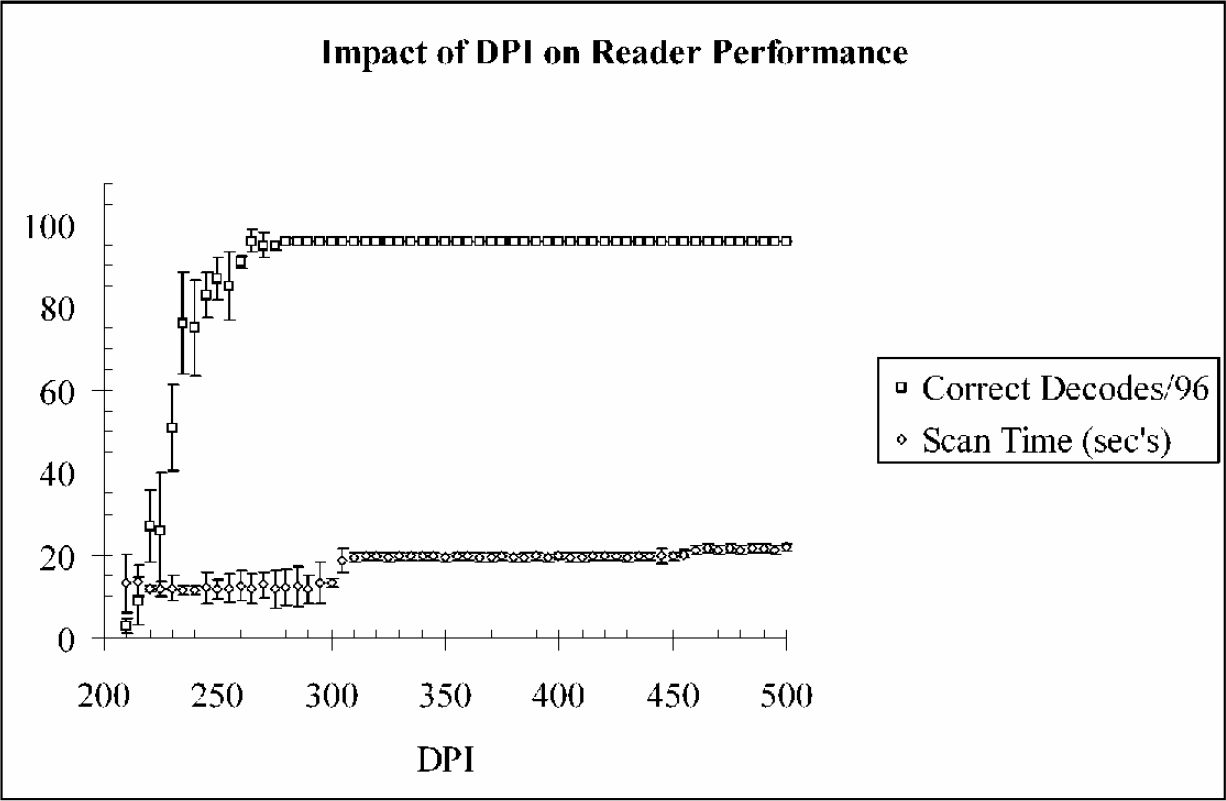
Impact of DPI on scan time and the number of correctly decoded bar codes out of 96 in a rack.
It can be seen from the plots that the optimal resolution at which we can successfully decode 100% of the 96 DataMatrix bar codes, while minimizing scan time, occurs at a value between 280 DPI and 300 DPI. This agrees reasonably well with the theoretical minimum value of 240 DPI, discussed previously.
COMPARISON WITH SIMILAR COMMERCIALLY AVAILABLE SCANNERS
Table 4 compares our custom 2-D bar code reader with two commercial units of similar design. As mentioned previously, a feature of particular interest to us is the ability to remotely interact with the bar code reader in a seamless and robust manner. This is summarized by the “External Control Capabilities” and “Output Format” features. We require the ability to integrate the reader into a larger automated system through an ActiveX interface. Our system software was designed with this feature. We did not develop a dedicated graphical user interface for our system since this was not of interest to us. Both commercial readers provide control software with a graphical user interface. Since source code is available for our system, the option to build a graphical user interface is always open.
Comparison of our custom 2-D bar code reader with two commercially available units.
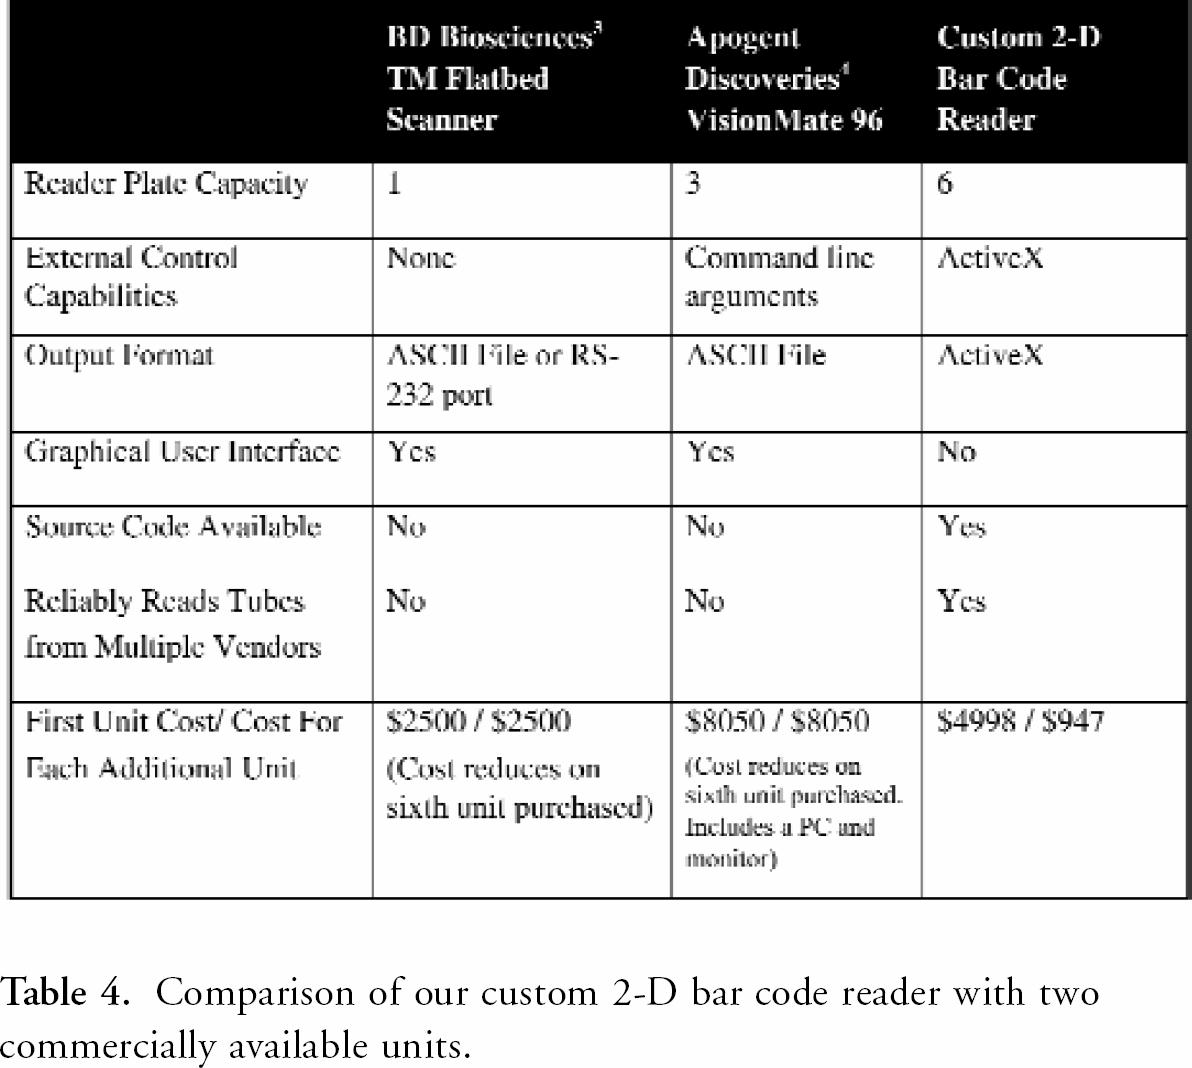
The cost to build the first custom reader includes $4,000 for ActiveMIL and the full Matrox Imaging Library software development kit 14 as well as $250 for the ObjectTWAIN™13 software development kit. This is required only if the system source code will be modified. If our DLL can be used as is, the only additional cost over the scanner and custom lid fabrication is a $200 hardlock from Matrox Electronic Systems to enable the ActiveMIL software. The cost of a flatbed scanner and lid fabrication will vary depending on the flatbed scanner model chosen and materials used for the lid.
Conclusion
A custom 2-D DataMatrix bar code reader was designed and built specifically to read bar codes printed on the base of tubes stored in 96-position racks. The system constructed and software used to drive the instrument and decode bar codes includes features not currently available in commercial units. A key feature for our purposes, missing in commercial units, is the packaging of the software as a reusable ActiveX library. Another attractive feature is the low cost of the custom reader, especially when that cost can be spread over multiple units.
A set of experiments was performed to investigate the total scan time and the number of successful bar codes decoded out of 96 as a function of image resolution. We determined that the optimal DPI value was between 280 and 300. This is consistent with the theoretical lower limit of 240 DPI.
Our source code, the DLL and other information can be downloaded from http://labautomation.org/JALA/JALA7.6.html.
Acknowledgements
The authors would like to thank Wenjeng Li and John Allen for their help designing and fabricating the custom flatbed scanner lid that was used to position tube racks on the scanner of our bar code reading device.