
Abstract
Using a single robotic platform, the GeneTAC™ G3, we have automated most of the processes involved in the cloning and characterisation of novel disease causing genes by addressing the following; firstly, identifying the BACs of interest and making shotgun libraries. Secondly, automating the set up of sequencing reactions using methodology that eliminates the need for DNA preparation of 384 clones. Thirdly, generating sub-libraries using selective re-arraying of library clones to enable the determination of the entire genomic sequence of the gene. Fourthly, determining gene function by combination of differential screening and mini Northerns using microarrays printed using the GeneTAC™ G3 system and hybridised using the GeneTAC™ HybStation (Genomics Solutions, Ann Arbor, USA).
Keywords
Introduction
Although there are many gene identification, cloning and functional genomics techniques, most are cumbersome and slow requiring a team of researchers. Classical physical mapping methods involve isolating YACs mapping to a region where the gene of interest is, using molecular cytogenetics techniques such as fluorescent in situ hybridisation (FISH) and comparitive genome hybridization (CGH), 30 8 loss of heterozygocity (LOH) 2 and Linkage. 21 31 This is followed by isolating a set of corresponding BACs (Baceterial Artificial Chromosome) then mapping the gene of interest to a minimal set of BACs using techniques such as fingerprinting. 6 The BACs that are thought to contain the gene of interest are prepared and sequenced using M13 shotgun sequencing strategy. 9,10,16,24 Gene structure is then identified using cumbersome techniques such as solution hybrid capture 27 and exon trapping. 18 Confirmation of the gene is carried out using mutation detection. Once the gene is identified, functional genomics is carried out by gridding cDNA libraries from various tissues and cell lines on slides making microarrays and using the gene as a probe to investigate expression patterns.
As the Human Genome Project (HGP) nears completion, much emphasis is being directed on using the information from the HGP in isolating and characterising novel disease causing genes. We present novel high throughput automated techniques that accelerate gene identification, cloning and the functional genomics process. Using a single automated platform, the GeneTAC G 3 , we have successfully automated the following key activities; firstly, identifying the BACs of interest and making shotgun libraries. This is then picked into 384 well plates. Secondly, automating the set up of sequencing reactions using methodology that eliminates the need for DNA preparation of 384 clones. This simplifies and accelerates the whole sequencing process. Thirdly, generating sub-libraries for finishing using selective re-arraying or ‘cherry picking’ of library clones to enable the definition of the entire genomic sequence of the gene. The structure of the gene can be obtained from the full length cDNA using RACE (Rapid Amplification of cDNA End) or probing the cDNA library with genomic fragments library of the gene and using sequence data from the HGP to fill in any gaps via bioinformatics. Fourthly, determining gene function. Gene function is investigated using expression profiling, differential screening and mini Northerns using microarrays printed using the GeneTAC G 3 system and hybridised using the GeneTAC HybStation (Genomics Solutions, Ann Arbor, USA). Whilst there are many robotic platforms on the market that can perform many of the processes described above, the GeneTAC G 3 can perform colony picking, selective re-arraying, gridding on nylon membranes and glass slides and DNA library replication making it ideal for small, medium and industrial genetic laboratories.
Materials and Methods
CONSTRUCTION AND MAINTENENCE OF GENOMIC BAC LIBRARY, DNA SHOTGUN LIBRARIES FOR FINISHING AND CDNA LIBRARIES
A whole genome BAC library was constructed according to De Jung. 7 A DNA shotgun library, used for BAC sequence finishing purposes, was constructed according to Smedly et al., 23 and a cDNA library was constructed using the ZAP-cDNA synthesis kit (Stratagene). Transformants were plated out on 22×22 Bioassay plates and left at 37°C overnight. White colonies were picked into 384 well plates containing 70μl of LB broth and kanamycin (25μg/ml) with 7.5% glycerol per well using the GeneTAC G 3 which has the ability to carry out automated blue/white selection. In order to maintain the library, three copies of each library were made using replication facilities of the GeneTAC G 3 , libraries were then frozen and stored at −80°C. The GeneTAC G 3 was also used to expand and contract library plates from 384 to 96 well microtitre plates and vice versa. In order to use the library for gene identification, each library was gridded onto Hybond-N+ nylon membrane filters (Amersham) using the gridding facilities of the GeneTAC G 3 . Gridding and picking methodologies and strategies were according to Hamoudi et al. 12
ISOLATING BAC OF INTEREST
BAC library filters were hybridised to genomic markers such as polymorphic markers, sequence tagged sites (STS) or expressed sequence tags (EST) obtained from linkage, molecular cytogenetics or LOH studies. In order to isolate the BACs containing the gene of interest, the re-arraying function was used, whereby the selected samples were picked into 150μl of L-Broth and kanamycin (25 μg/ml) in 96 well microtitre plate using the Librarian tool of the GeneTAC G 3 . Fluorescent fingerprinting was carried out on the BACs to generate the minimal overlapping set of BACs to narrow down the search for the gene to one or two BACs. 11
AUTOMATED DNA TEMPLATE PREPARATION OF BAC FRAGMENTS CONTAINING THE GENE OF INTEREST
A shotgun library of the BAC containing the gene of interest was generated using the GeneTAC G 3 as described earlier. 1 to 1.5kb BAC fragments were obtained from five seconds sonication or partial digestion using AluI, Rsa and HaeIII restriction enzymes. These were then subcloned within five minutes into TOPO cloning vector by blunt end ligation using the TOPO sequencing kit (Invitrogen, California, USA). The library clones were picked using the GeneTAC G 3 , into two 384 well plates containing 70μl LB and ampicillin (50μg/ml) with 7.5% glycerol, and incubated at for 16 hours at 37°C and 200 rpm in a shaking incubator. The grown cultures were replicated into 96 well plates containing a PCR master mix with 2μM of TOPO vector primers such as T7 (5′-GTAATACGACTCACTATAGGGC-3′) and T3 (5′-AAT-TAACCCTCACTAAAGGG-3′) using the GeneTAC G 3 . 25μl PCR reaction mix was carried out by adding 1.5 mM MgCl2, 10 mM Tris-HCl (pH 8.3), 50 mM KCl, 0.2 mM dNTP, 0.5 μM T7 and T3 primers and 0.5 U Thermoprime Taq (AB Gene). PCR amplification was carried out using the following cycling conditions; five minutes at 94°C to ensure that the bacterial cell wall is destroyed releasing the plasmid containing the BAC fragment, followed by denaturation step at one minute for 94°C, annealing of the vector primers at one minute for 55°C and extension step of two minutes for 72°C for 35 cycles, ensued by an extension step of 10 minutes at 72°C to finish the elongation of most PCR products initiated during last cycle. PCR cycling for 96 and 384 well plates was carried out using Pheonix thermocycler with convertible heating blocks (Helena Biosciences, UK). 5μl of PCR products were checked on 1% agarose gel. PCR products were cleaned up as follows; 30μl of 7.5M Ammonium Acetate and 70μl of 100% isopropanol was added to each PCR product, the plate was left on wet ice for 30 minutes followed by centrifugation at 3000rpm for 1.5 hours. The supernatant was discarded by inverting the plate upside down on dry absorbent paper and spinning at 500rpm for four seconds. The pellet was washed with 150μl of 80% ethanol before centrifuging at 3000rpm for one hour, discarding the supernatant and spinning the plate upright at 3000rpm for 15 minutes. The pellets were resuspended in 10μl of water ready for direct sequencing or 10μl of DMSO ready for spotting on slides onto generate microarray libraries.
AUTOMATED SEQUENCING OF BAC FRAGMENTS CONTAINING THE GENE OF INTEREST
Sequencing was carried out by adding 4μl of the PCR product (50ng/μl) to 4μl of dRhodamine Dye Terminator premix (Applied Biosystems Inc., Foster City, California, USA) and 2μl of vector primer (at 10μM) in 96 well microtitre plate. Cycle sequencing was carried out on the mix using the following cycling protocol; 96°C for 30 seconds, 50°C for 15 seconds and 60°C for one minute, for 25 cycles. The products were then cleaned up to remove excess dye terminator as follows; to each well, 100μl of 80% ethanol and 6μl of 3M sodium acetate at pH 5.2 was added, 1μl of glycogen can optionally be added to visualise the pellet at the bottom of the wells. The microtitre plate was left on wet ice for 30 minutes followed by centrifugation for one hour at 3000rpm. Two layers of dry absorbent paper was placed on top of the plate, the plate was inverted upside down to discard the supernatant onto the paper. This was replaced by a dry set of absorbent paper and placed on the plate holder of the centrifuge and centrifuged for four seconds at 500rpm to ensure that all supernatant is discarded. The plate was turned upright and centrifuged for 15 minutes to ensure that the pellet is at the bottom of the well. The plate was dried for two minutes at 90°C. Samples were run on ABI PRISM© 377 DNA Analyzer (Applied Biosystems Inc., Foster City, CA, USA) using 36cm WTR glass plates and Automatrix 4.5% 29:1 acrylamide:bisacrylamide ready made 6M urea gel mix (National Diagnostics, Hull, UK) and ABI PRISM© 3100 DNA Analyzer using 36cm capillary and POP-6™ polymer (Applied Biosystems Inc., Foster City, California, USA).
DETERMINING GENE STRUCTURE
Shotgun sequence data was assembled using Staden software suite. 25 The assembled sequence data was extended as much as possible using bioinformatics to fill any holes with finished sequence data from HGP. The bioinformatics strategy is carried out by aligning sequences at the end of the contigs to the HGP data from Ensembl (http://www.ensembl.org) (15), and NCBI (http://www.ncbi.nlm.nih.gov/cgi-bin/Entrez/map_search) using in house software to obtain the genomic sequence spanning the gene of interest. cDNA sequence of the gene of interest was obtained by carrying out RACE and probing cDNA libraries made using the GeneTAC G 3 . The cDNA sequence was used to probe the genomic shotgun library generated using the GeneTAC G 3 . Any positive colonies were selectively re-arrayed (cherry picked) into LB media with appropriate antibiotic using the Librarian tool of the GeneTAC G 3 . Cultures were grown overnight, prepared and sequenced using the GeneTAC G 3 as described above. Sequences were analysed and intron-exon boundaries were determined producing the overall gene structure by aligning the sequences to genomic sequence using in-house modification of the BLAST software (http://www.ncbi.nlm.nih.gov/BLAST). In order to prove that the disease is caused by the gene identified, exon primers were designed and used to screen all affected patients for mutations using FMD technique 7 followed by sequencing any band with a shift. Mutations were identified by comparing the mutant sequence to a normal using Sequence Navigator software (Applied Biosystems Inc., Foster City, California, USA).
DETERMINING GENE FUNCTION
Once the gene was identified, its expression profile was determined by constructing cDNA libraries from various tissues such as brain, kidney, breast and testis using the ZAP-cDNA synthesis kit (Strategene, La Jolla, California, USA) and gridding the libraries on glass slides using the GeneTAC G 3 to generate microarrays. The microarrays were hybridised with Cy3-dUTP and Cy5-dUTP labeled RNA from the genes identified and the data clustered to determine the expression profile of the gene of interest. The hybridisation was carried out using the GeneTAC HybStation following a standard pre-programmed protocol. Also subtractive hybridisation experiments were carried out, whereby a tissue library was subjected to a physical or chemical input such as UV radiation or treatment with a reagent or compound and normal library of the same tissue were hybridised with labeled RNA from the gene of interest. The results were compared to determine whether the genes that are up-regulated and down-regulated were as a result of the external input. Mini-Northerns were also carried out using microarrays of various tissues to determine the tissue that the gene of interest was mostly expressed in. Array fabrication and RNA labeling were carried out according to Hegde et al. 13 Figure 1 shows a flow chart of the overall strategy for isolating and characterizing genes using the GeneTAC G 3 .
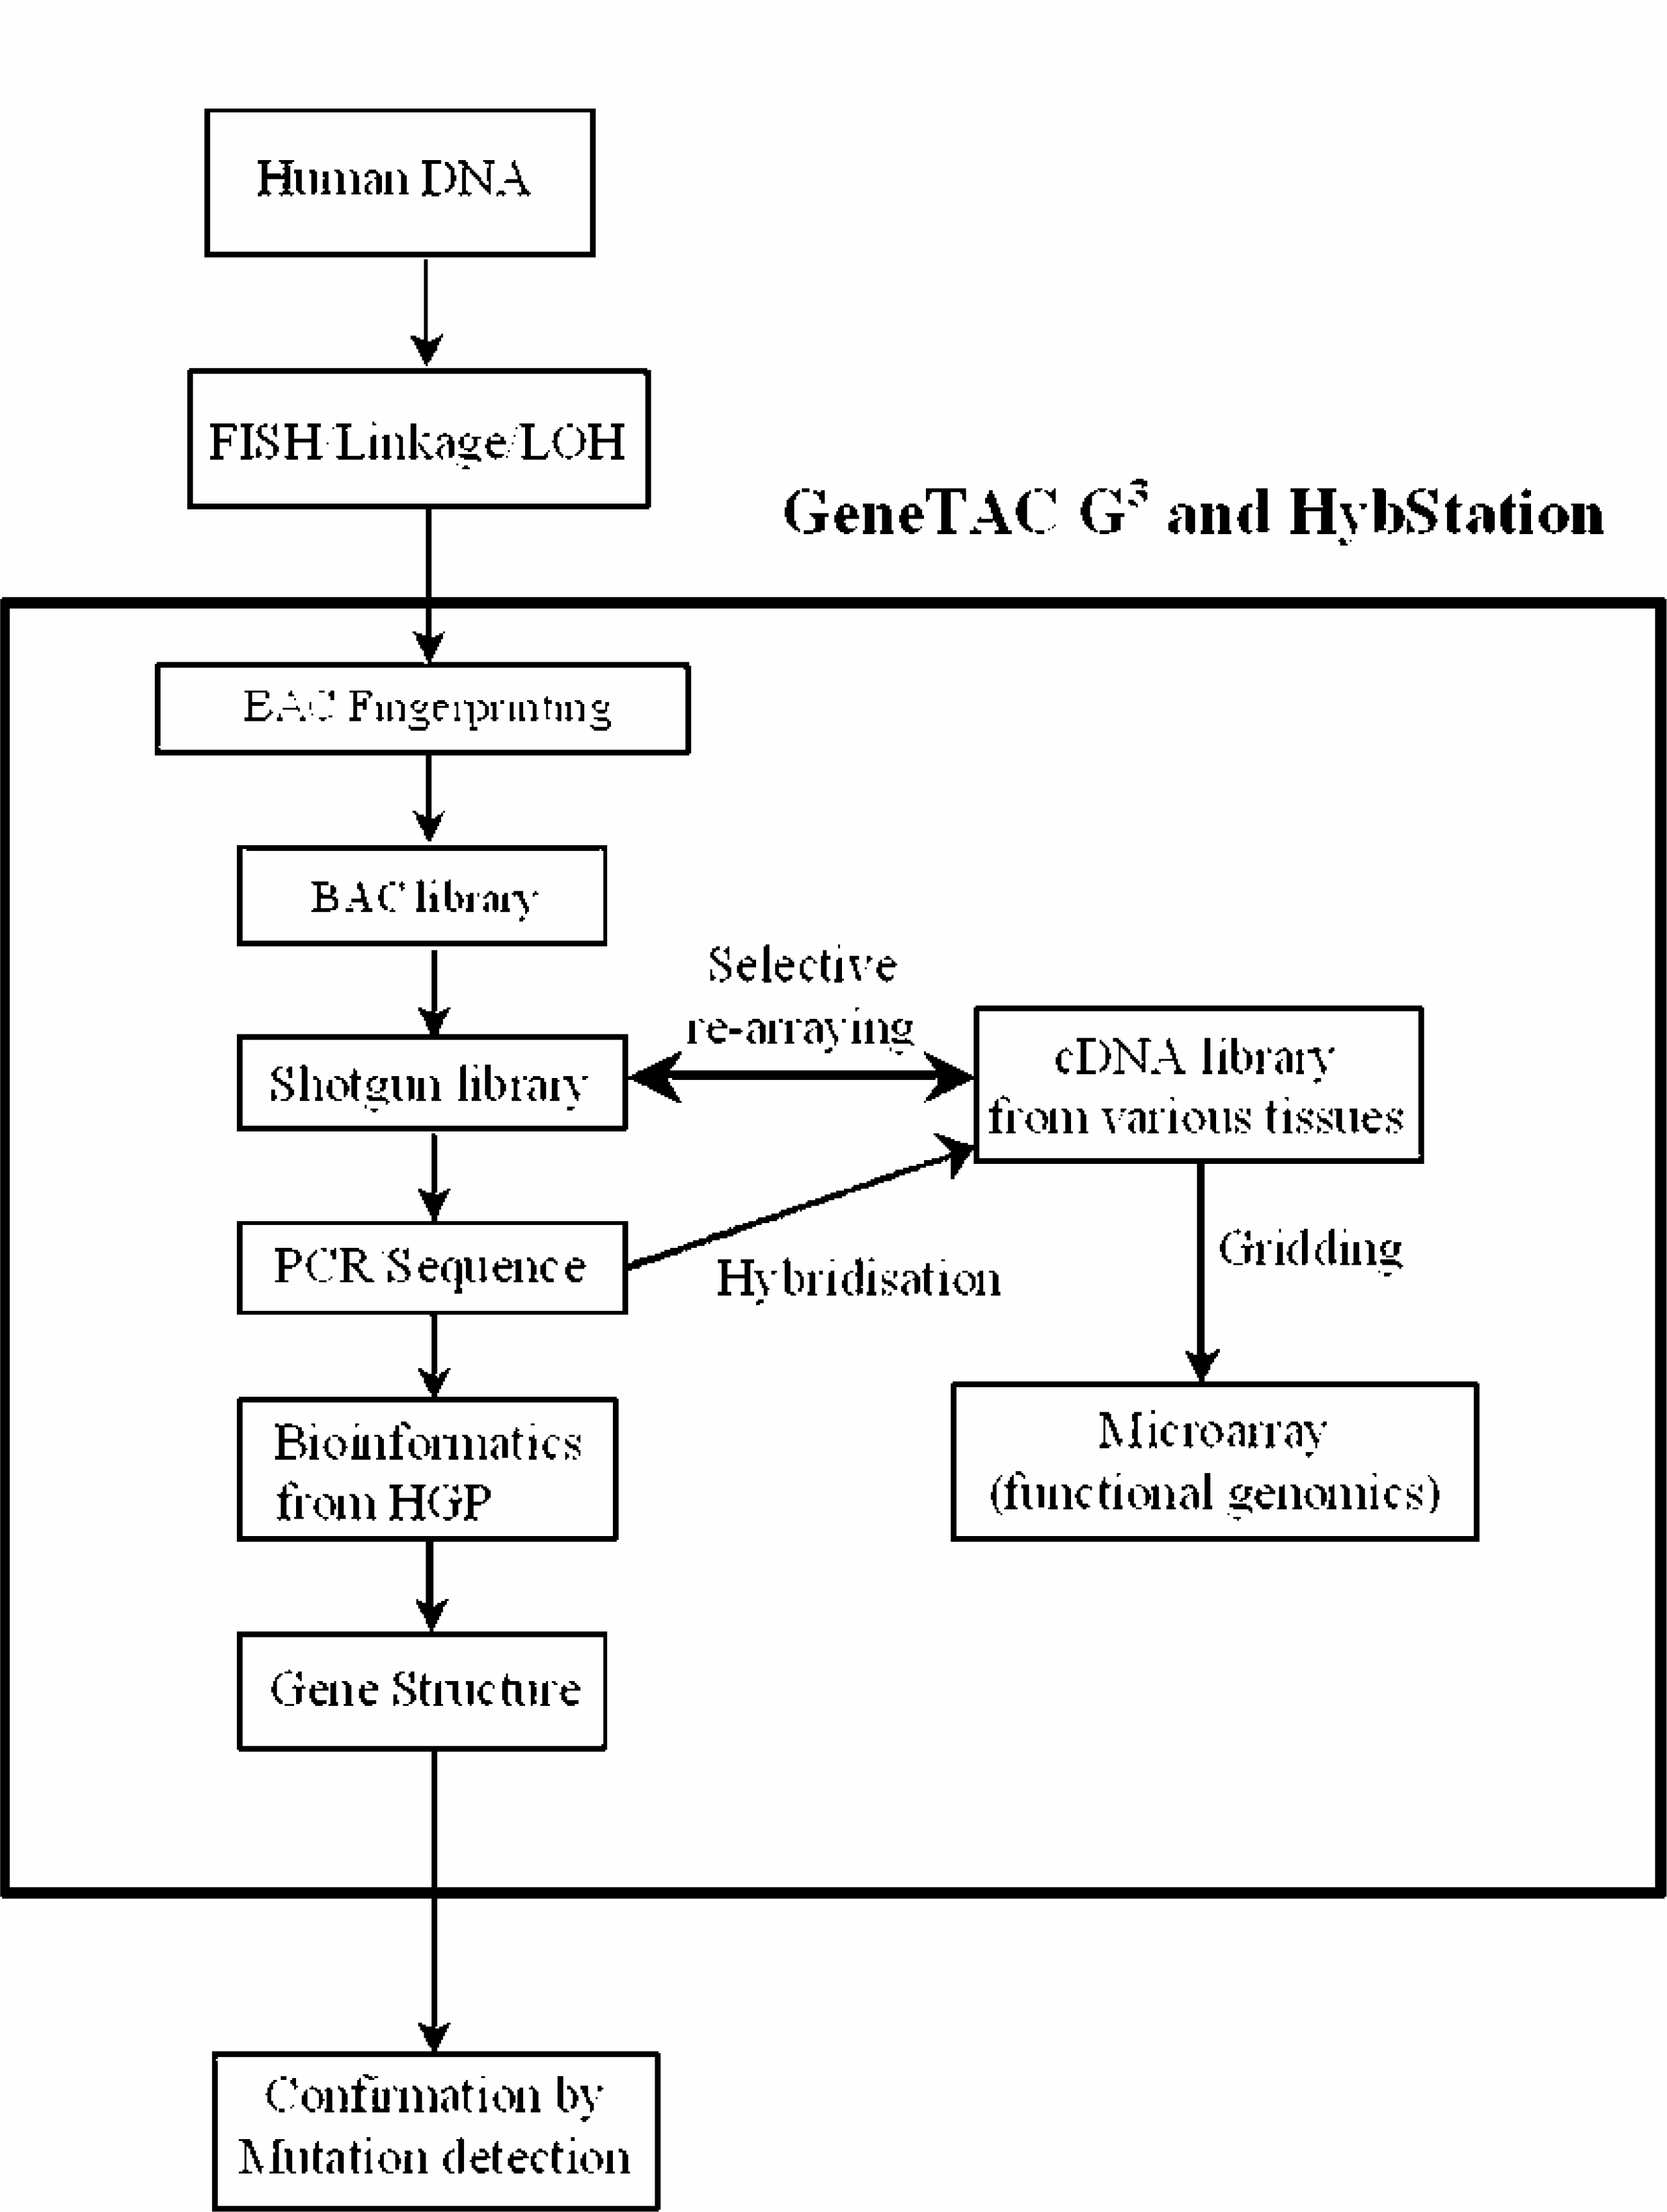
Flow Chart representing the overall strategy for isolating and characterizing genes using the GeneTAC G 3 .
Results
CONSTRUCTION OF BAC, cDNA AND SHOTGUN DNA LIBRARIES
Picking was carried out using the 48-pin pneumatic head. It takes around 50 seconds to pick 48 colonies including sterilization. It takes around 30 minutes to pick the 1500 clones generated by the shotgun DNA library, three hours to pick the 10,000 clones generated by the cDNA library and 43 hours to pick the 200,000 clones generated by the entire BAC library without manual intervention. Around four 384-well plates were generated from shotgun DNA library, 28 384-well plates were generated from the cDNA library and 520 384-well plates were generated from the BAC library giving eight-fold coverage. The accuracy of picking is between 99.5% and 100% with usually between 382 and 384 wells growing. Experiments showed that all the clones picked were from isolated colonies and are pure indicating no cross contamination between picking (data not shown).
Using single transfer and double spotting, it takes around 20 minutes to grid the cDNA library and two hours to grid the BAC library onto either 11.9×7.8cm or eight 22×22cm Hybond-N+ filters. The maximum resolution on each 11.9×7.8cm filter is 13,824 spots and on 22×22cm filter it is up to 120,000 spots. Figure 2 shows 11.9×7.8cm Hybond-N+ filter gridded with BAC clones using double spotting.
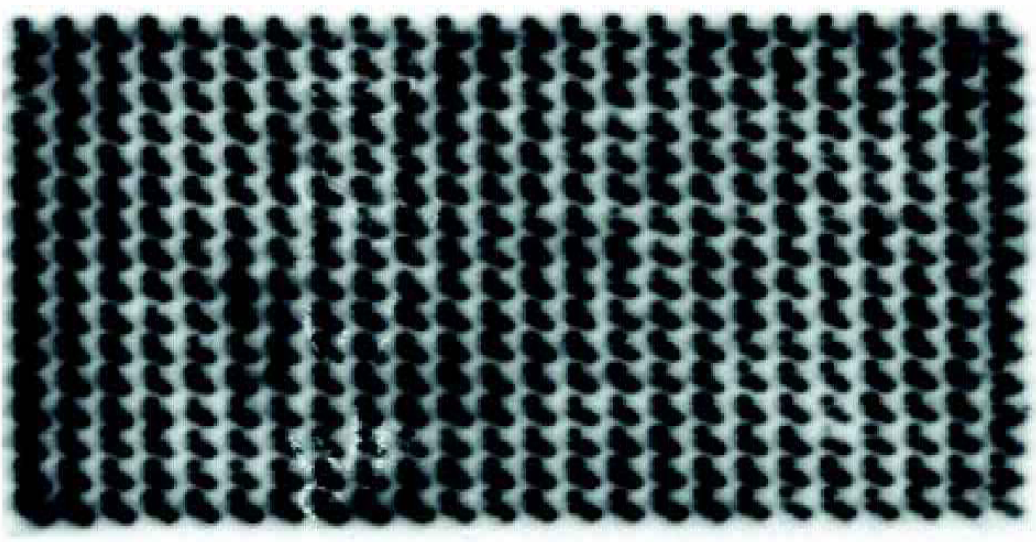
Autoradiograph of 11.9 × 7.8cm Hybond-N+ filter hybridised with BAC clones. Using single transfer and double spotting the BAC library clones were gridded and probed with radioactively labeled polymorphic markers from the area containing the gene of interest. The figure shows that the BACs were gridded consistently and providing good signals to identify the BAC of interest anywhere on a 348 plate.
ISOLATING BAC OF INTEREST
Usually around 20 to 40 BACs result from the first round of hybridisation using probes that are thought to be in the region of the gene of interest. Finding minimal overlapping set of BACs is done by fluorescent fingerprinting prepared using the GeneTAC G 3 . Figure 3 shows typical BAC fingerprinted and ran on ABI PRISM© 377 DNA Analyzer.
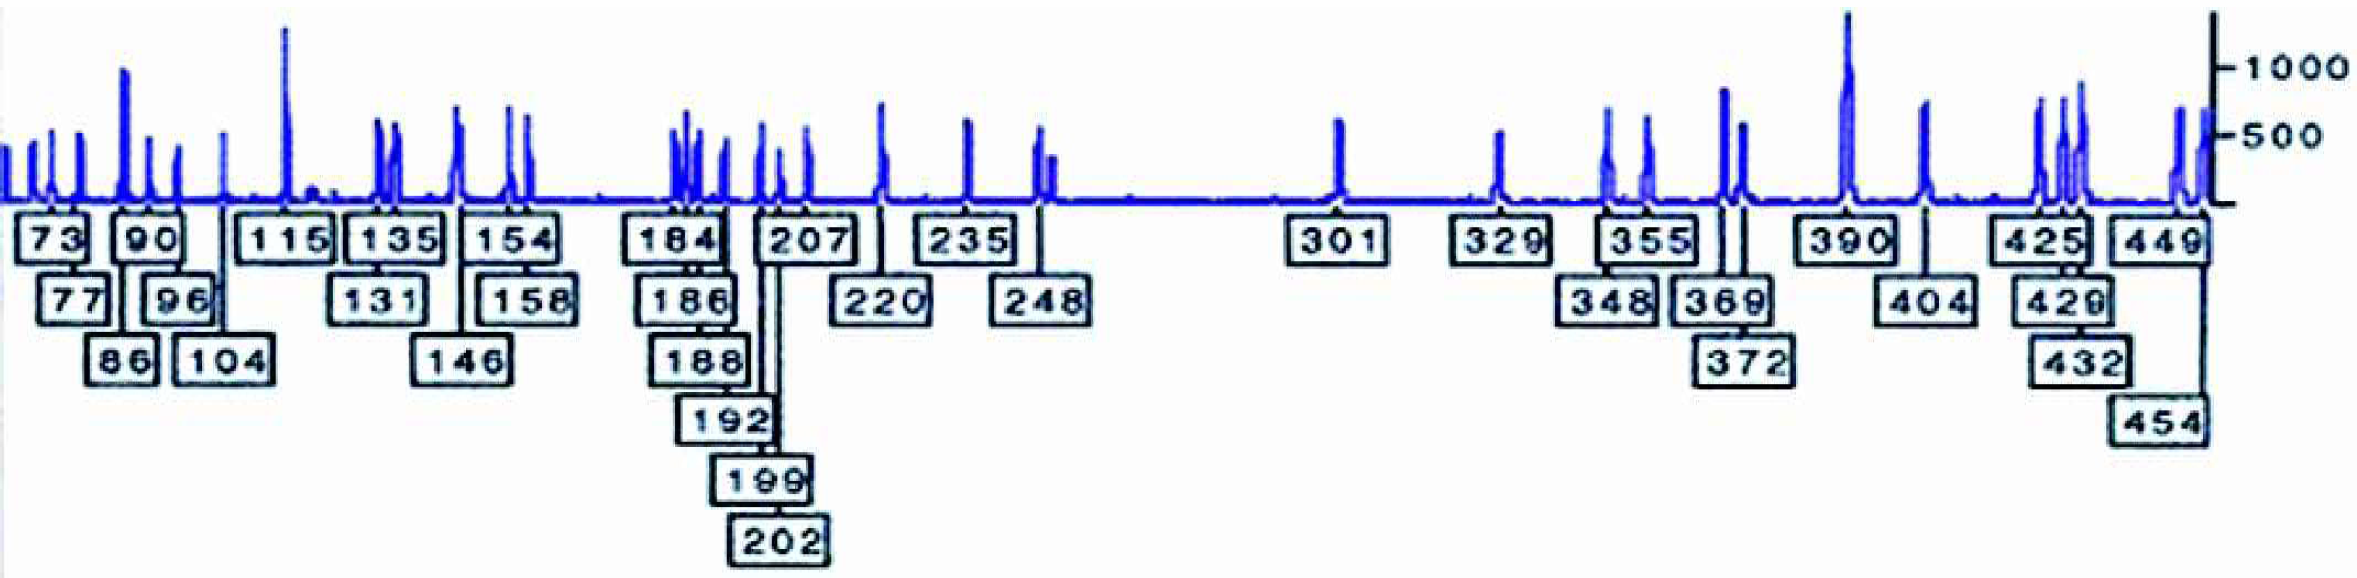
Fluorescent fingerprinting of BAC DNA clone run on ABI PRISM© 377 DNA sequencer. Typical BAC clone prepared using GeneTAC G3 and labeled using FAM-dCTP. The BAC in the figure shows good signal to ratio and clean baseline making it easy to call the fingerprinted fragments.
AUTOMATED SHOTGUN SEQUENCING OF BAC CONTAINING THE GENE OF INTEREST
It takes around 10 seconds to prepare the DNA in the entire 384-well plate and 40 seconds to prepare the DNA for the entire shotgun library of 1500 DNA clones. Amplification of clones from culture routinely generates very good quality templates with good amplification signals as shown in Figure 4a. For more than 20,000 clones, the success rate for single-band amplification is between 96% and 100% which is better than any other DNA preparation method or kit.
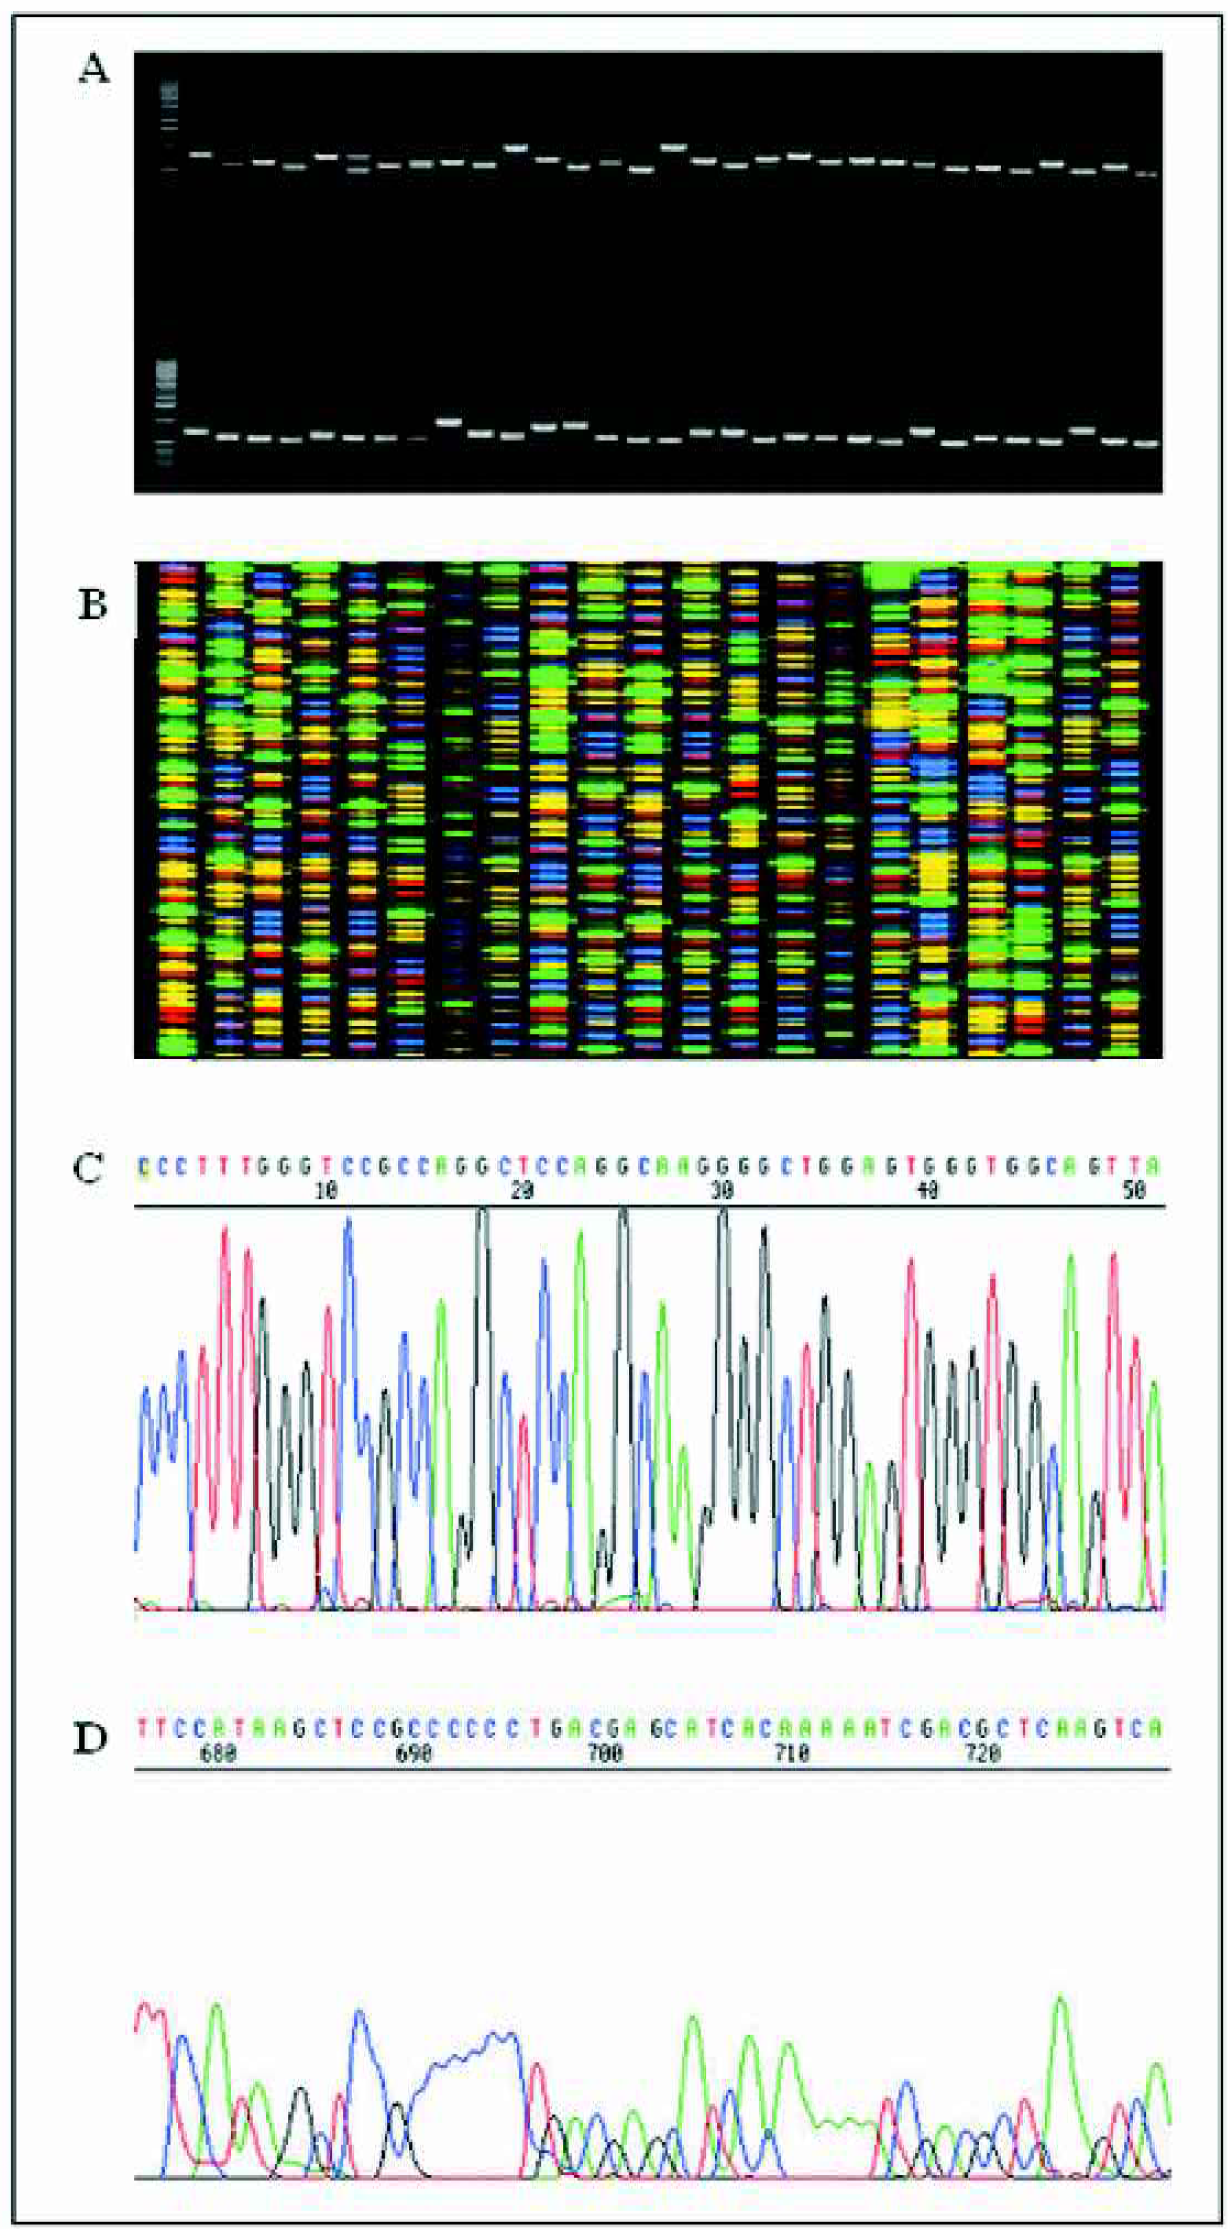
Results of direct PCR amplification and sequencing of BAC fragment clones from bacterial L-Broth culture. (A) PCR amplification from BAC fragments from bacterial cultures. The leftmost lane in each tier of the gel contains 1-kb ladder. The BAC fragments were cloned in TOPO cloning vector and amplified using T7 and T3 primers. All fragments fall between 1 and 1.5 kb. (B) ABI PRISM© 377 DNA Analyzer gel file showing sequences generated using the protocols described here. The sequences were generated from cycle sequencing of DNA fragments amplified directly from bacterial cultures. (C) ABI PRISM© 377 DNA Analyzer chromatogram showing the first 50 base pairs of sequence generated using the protocols described here. The sequence gives good signal to noise ratio and can be read clearly from the first base indicating that this method is better and more cost efficient than dye cleanup kits. (D) ABI PRISM© 377 DNA Analyzer chromatogram showing the latter parts of a sequence generated using the protocols described here. The sequence around the 700bp gives good quality signal to noise ratio and is readable without any basecalling errors.
The PCR fragments were sequenced directly using T7 and T3 TOPO vector primers, thus eliminating the need for DNA template preparation altogether and giving the advantage of being both more cost efficient and less labour intensive with lower cross contamination rates than amplification from plasmid DNA or DNA template preparation. The method routinely produces excellent quality sequencing data of average read length of 750bp with 98.5% accuracy and average Phred Q20 scores > 700bp. Figure 4b shows a typical gel image file of sequences generated using this method. Figure 4c and Figure 4d show typical chromatograms of the beginning and end of sequence generated using this method run on ABI PRISM© 377 DNA Analyzer. Figure 4c shows that the beginning of the sequence has no traces of unincorporated dye terminators obscuring some of the bases indicating that the dye cleanup described is better and more cost efficient than using dye terminator cleanup kits. Figure 4d shows that the latter part of the sequence around 600bp to 750bp is of good, readable quality without any basecalling errors.
Once the full length genomic sequence is determined, intronexon boundaries were found by probing genomic BAC library of the gene of interest with cDNA probes and sequencing the positive clones, then aligning that to the genomic BAC sequence to obtain the boundaries. This technique successfully isolates small introns which are missed by current gene prediction software such Genscan and Grail. 26 This technique relies on using bioinformatics on HGP data thus it is cheaper, quicker and more accurate than current intron-exon boundary techniques and prediction software.
DETERMINING GENE FUNCTION
Different types of experiment are usually carried out on a newly identified gene. Firstly, expression profiling to view the dosage at which the gene is expressed, secondly, subtractive hybridisation to determine how various external physical and biochemical input affect the expression of the gene in various tissues which could lead to delineation of the biochemical pathways the gene is involved in and thirdly, mini-Northerns to determine the level of expression of the gene in various tissues.
Using the standard pin size of 200 microns, the maximum resolution is 4800 spots per slide, using the 75 micron pins the maximum resolution is 9408 per slide. The GeneTAC G 3 grids four slides per hour and can grid up to 24 slides without manual intervention. Thus using the 75 micron pins the GeneTAC G 3 can grid up to 225,792 spots in six hours. Figure 5 shows typical image of a microarray printed using the GeneTAC G 3 and hybridised using the GeneTAC HybStation.
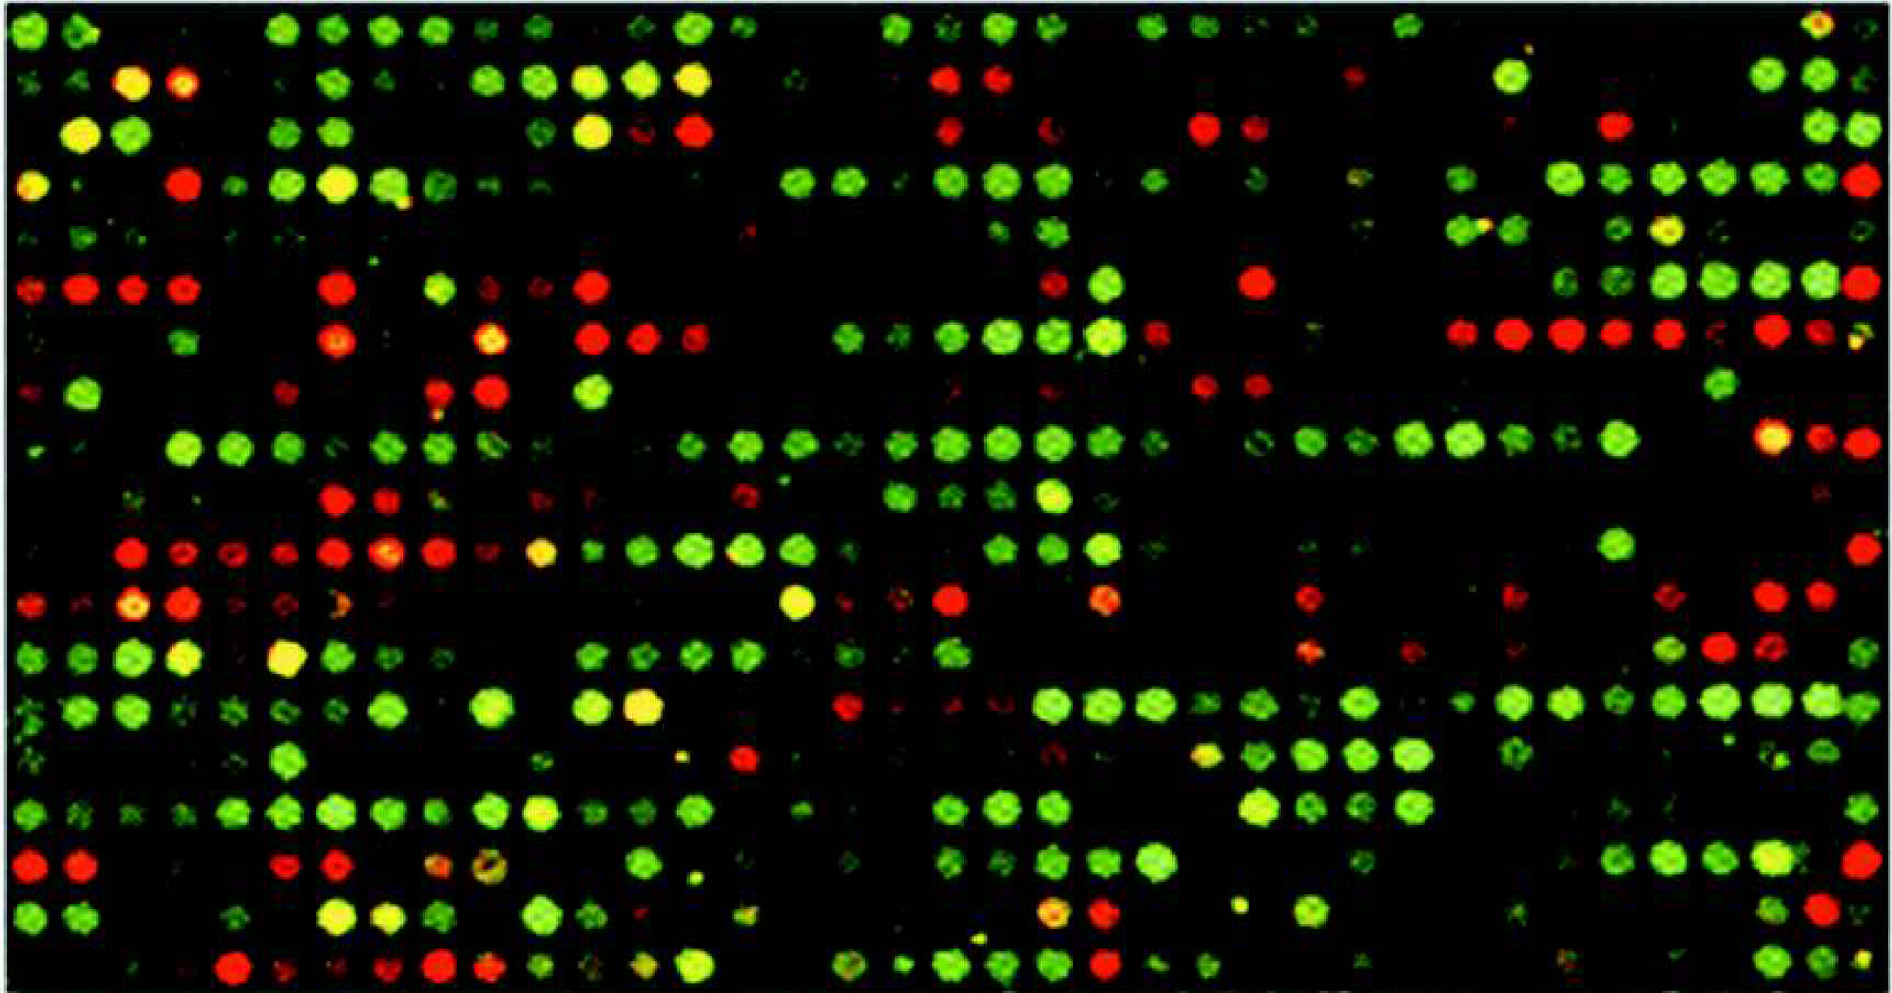
Hybridisation of fluorescently labeled mRNA to a portion of 4800 spot array. RNA extracted from test and reference cell lines were reverse transcribed and labeled with Cy5-dUTP and Cy3-dUTP respectively. These were hybridised to a microarray containing 4800 cDNA clones using GeneTAC HybStation.
Discussion
The techniques for isolating and characterizing novel genes using the GeneTAC G 3 are essential in confirming any gene prediction using bioinformatics on HGP databases especially where the region involved is not at the finishing stage yet. They also provide cheaper, faster and more accurate way of isolating and determining gene structure. Recently, Brett et al., 4 have shown that there are many novel genes still unidentified and isolating them is more complex due to the presence of alternative transcripts of those genes, thus the techniques discussed above will help to streamline the process. Almind et al., Nwosu et al. and Pharoah et al., 1 19 20 have shown that almost all currently investigated diseases arise due to the action of more than one set of genes explaining the difficulties in isolating genes involved in diseases such as diabetes, prostate and breast cancer. A combination of microarray together with RACE and gene identification technique will help to pinpoint and characterize the genes involved in those diseases at cost effective rates since all the methods are carried out on a single flexible platform; GeneTAC G 3 within a laboratory environment. A combination of the techniques discussed have been used successfully to isolate many genes including the IgG Fc receptor, FcgammaRIIB, 5 Cylindromatosis, 3 PRCC, 22 Peutz Jaeger, 14 Bcl9, 29 Bcl10 28 and RAMP 23 genes. Additionally, the techniques can be easily adapted to isolate and characterize genes from other organisms and species.
Ackknowledgements
R. A. Hamoudi was funded by the Institute of Cancer Research which is supported by Cancer Research UK.