
Abstract
We have developed a novel method for combinatorial chemistry that allows for fully parallel synthesis and full library analysis. The key feature is the use of linear supports for synthesis, where the position of a compound along the support encodes its synthetic history. Use of an optical fiber as the linear support allows for the optical evaluation of libraries: the location of an emitting fluorophore can be determined using fluorescent optical time domain reflectometry. We have demonstrated that limitations on the spatial resolution imposed by the fluorescence lifetimes are overcome by using a second fiber as an optical delay.
Keywords
INTRODUCTION
In recent years, computational methods for the calculation of the structure and the properties of molecules have achieved a high degree of accuracy. However, for many purposes including drug design, synthesis and evaluation of candidate structures constitutes a critical component of the process by which new useful substances are identified. Recent combinatorial methods facilitate the preparation and evaluation of large numbers of compounds to obtain useful substances and/or new understanding. In practice, the goal is to create, from a basic set of reagents and for a given number of reaction steps, a library of all possible compounds that can result from the sequential combination of the initial set of reagents.
Three basic questions have to be addressed by any combinatorial chemical technique.
How can one make all these compounds systematically and efficiently?
How can one identify whether a compound has the desired properties?
How can one determine which compound has the desired properties?
The first question has been addressed by the introduction of several combinatorial synthetic methods. Two important categories of methods are split/mix synthesis and two-dimensional spatially encoded synthesis. The split/mix synthesis 1 uses beads as a solid support for the reaction sequence (see Figure 1). This approach is very efficient from a synthetic point of view, since all reactions take place in parallel so that all reactions at a given step take place simultaneously, and each reactant need be handled only once per step. Alternatively, a two-dimensional support can be employed for the synthesis, so that each substance is prepared at a known position (see Figure 2). 2 By its nature this technique is serial, although photolithographically generated masks can bring partially parallel synthesis to these two-dimensional arrays.
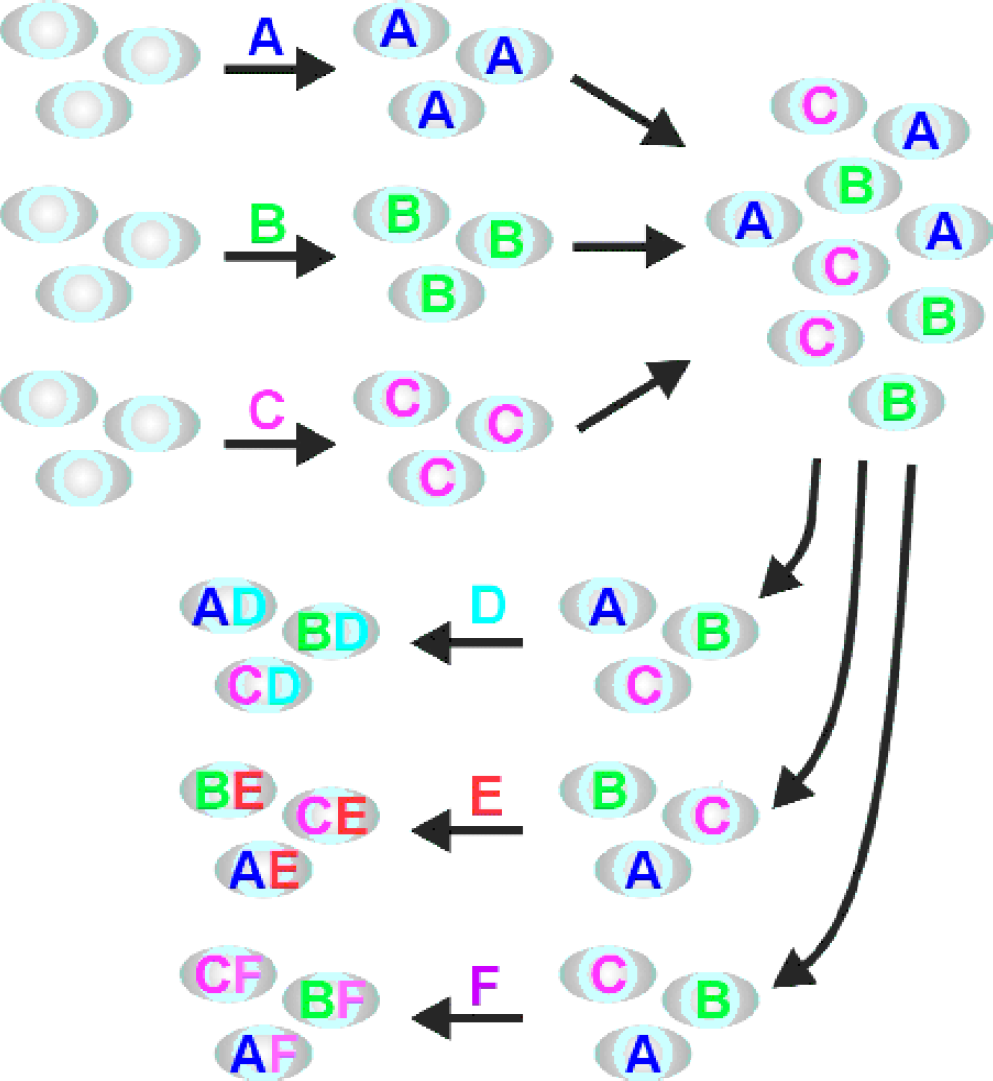
Split/Mix Scheme: Initially the beads are subdivided into a number of groups equal to the number of reactants in the first synthesis step. Each group is exposed to a different reactant. Then the beads are mixed. After resubdivision into the desired number of groups and subsequent exposure of each group to a different reactant, the beads are again mixed, etc.
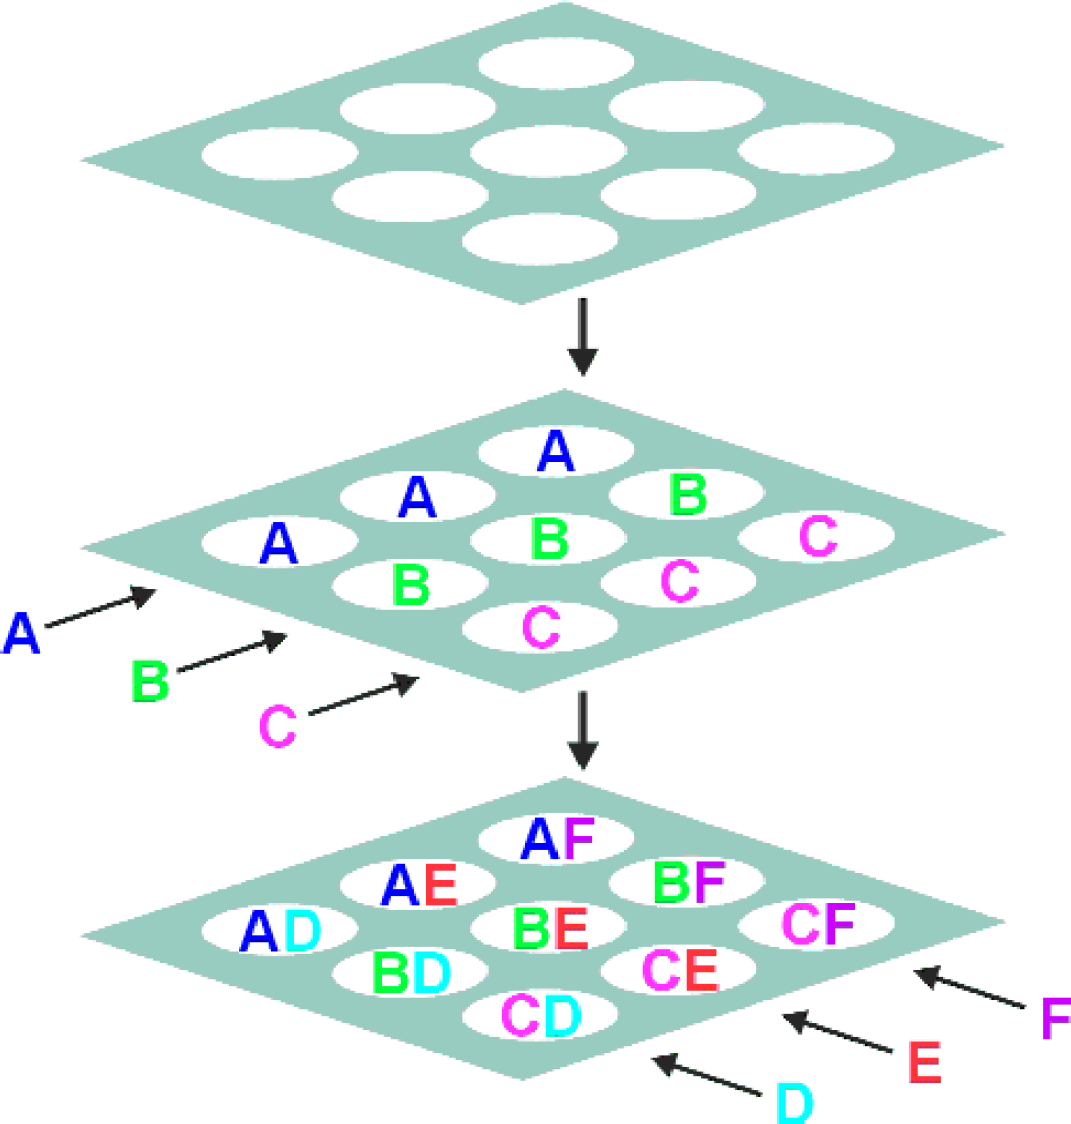
Scheme using a two-dimensional layout: The surface is divided into spots, with each spot being a reaction region. All combinations of reactants are created by sequential application of the reactants to these spots.
The second question, of activity evaluation, depends on the activity of interest. It is usually approached by assaying the library compounds with molecular probes that bind only to compounds with the desired properties. When fluorescent molecular probes are used, changes of the fluorescence properties of a library compound upon binding of the probe indicate a positive identification. These screening procedures must be matched to the task at hand, and compatible with the large numbers of samples prepared, or the parallel synthesis is inappropriate.
Having verified that one or more of the synthesized compounds has the desired properties, each active compound must be identified and isolated (i.e., third question). This problem is easily solved for two-dimensional arrays, where the synthetic history is known for each reaction region. In the split/mix technique, however, this is a more formidable problem: even if the bead that produces the positive assay can be identified and isolated, the synthetic history of the compound on the bead must be subsequently determined. In order to identify this compound, time-consuming analytical procedures have to be employed, generally inapplicable to the entire library of compounds.
For maximum efficiency of a combinatorial synthesis, the procedure should allow for both fully parallel synthesis (Footnote 1) and the possibility of full library analysis, i.e., the availability of the complete synthetic history of each compound. We have recently developed a method for combinatorial chemistry that allows for fully parallel synthesis while retaining information on the identity of each library member. 3 The key to spatially encoded synthesis with such parallelism is to use a linear organization of the library on a solid support of linear morphology. As will be described in more detail below, the position of a library member along the linear support encodes its synthetic history. The first manifestation of this method employed cotton threads as linear supports in combination with a fluorescent assay. Pulling the thread through a fluorometer produced a fluorescence time-trace, where the time corresponded to the location of the fluorophores along the thread.
The method is not limited to cotton thread supports: optical fibers constitute promising and in many ways more versatile supports. The reactions can be carried out in the original cladding of the fiber or in a substance replacing the original cladding. For assaying libraries built on these fibers, fiber-optic sensor technologies developed for distributed and quasi-distributed sensing can be brought to bear. Using fluorescent optical time domain reflectometry, 4 the location of a fluorophore along the fiber can be measured (see below). We show here that limitations on the spatial resolution, which are imposed by the fluorescence lifetimes of the fluorophores, can be overcome using a novel two-fiber detection scheme.
Moreover, in addition to drug design, one significant application of arrays of substances prepared in a combinatorial manner is as a sensor array. We envision the preparation of large arrays of fluorescent chemosensors to be quite useful for the selective detection of a variety of analytes. We demonstrate here that a virtually instantaneous readout of such an array is possible if the linear array is distributed along an optical fiber. No imaging is required: the entire array output is obtained as a single time-varying signal. 5
This paper is structured as follows: After a description of our one-dimensional combinatorial chemistry method, we briefly review the basic properties of optical fibers, with emphasis on the evanescent field, which provides a mechanism for the interaction of the light modes in the fiber core with the fluorophores in the fiber cladding. This is followed by a description of the experimental setup. We present first results for multi-component sensor arrays and show under which conditions losses of light from the core to the cladding at the sensor regions are kept to a minimum. This is of crucial importance for the optical evaluation of large arrays of sensors.
ONE-DIMENSIONAL COMBINATORIAL CHEMISTRY SCHEME
The challenge in spatially encoded synthesis is to subdivide the support for one reaction, and then to resubdivide it in a mathematically orthogonal manner for the next reaction, without loss of information. Our solution is quite simple, as shown in Figure 3. The linear support (thread or fiber) is wrapped around a cylinder of precisely determined circumference in a single spiral layer. The division of the cylinder lengthwise into regions allows for treatment of the space between a pair of divisions (black lines on the cylinder surface parallel to the cylinder axis) as a reaction vessel (hereafter referred to as a “segment”). In each synthesis step a separate reactant is added to each segment. Subsequently, the linear support is removed from the cylinder and bears a set of repeating domains, the position of each encoding the identity of those compounds. In order to resubdivide in an orthogonal manner such that all combinations will be formed in the next step, the solid support is wrapped around another cylinder of a different, well-defined circumference. The size of the cylinder is chosen such that adjacent regions bear unrelated substances, and regions bearing like substances are distributed around the cylinder. Thus, a repeating pattern of all reactant combinations is formed. This process can be repeated with an arbitrary number of steps. Figure 3 also shows the unwrapped linear support and the regions created on it after two synthesis steps.
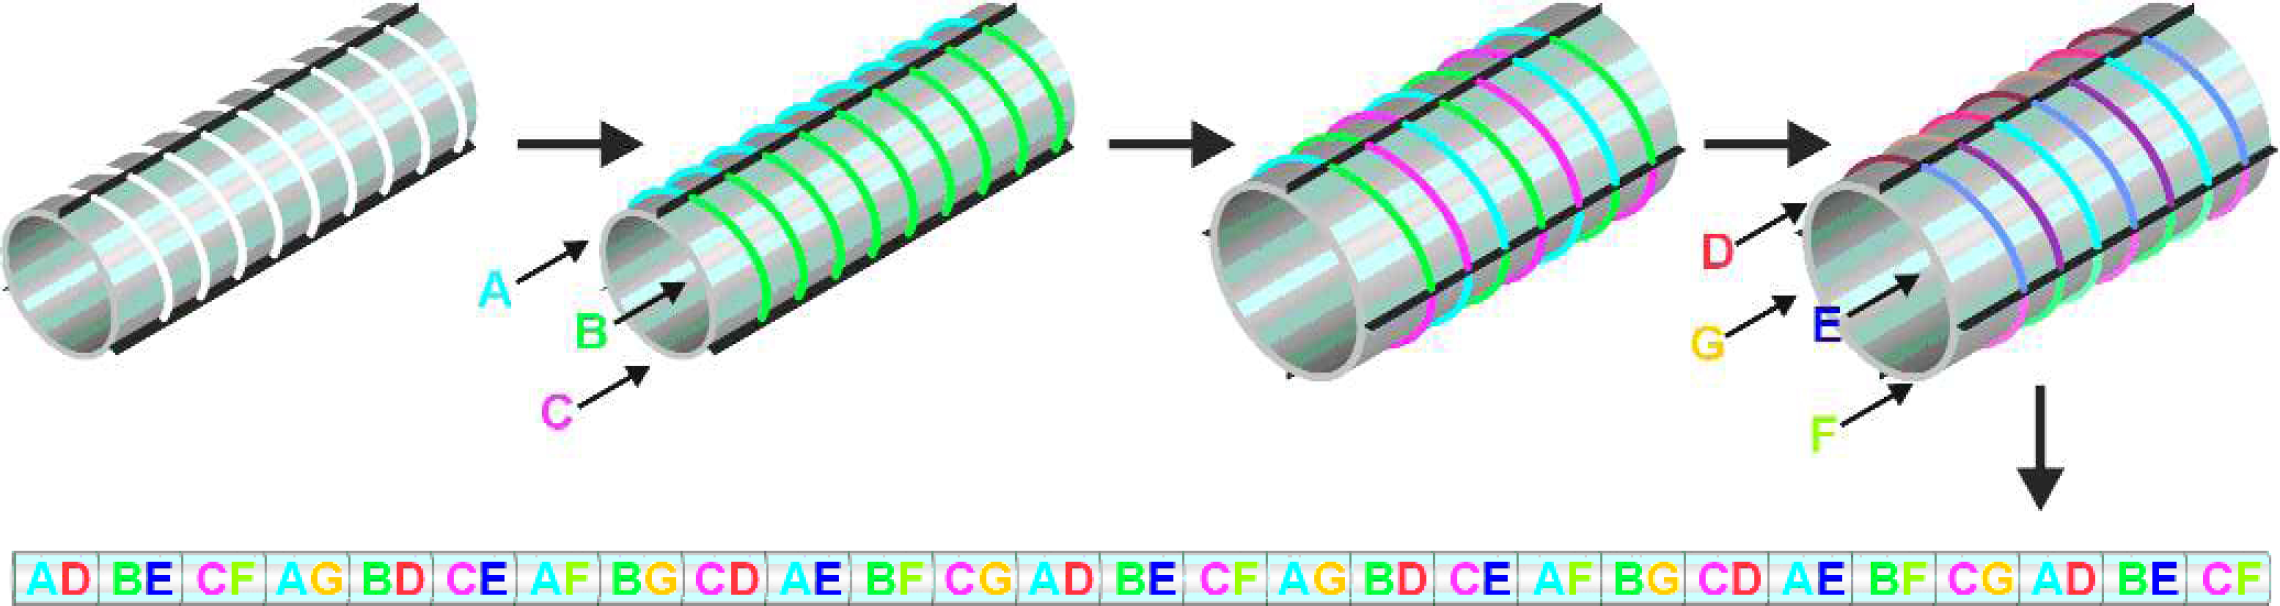
One-dimensional combinatorial chemistry: The linear support (thread or fiber) is wrapped around a cylinder of precisely determined circumference in a single spiral layer. The division of the cylinder lengthwise into regions allows for treatment of the space between a pair of divisions (black lines on the cylinder surface parallel to the cylinder axis) as a reaction vessel (hereafter referred to as “segment”). In the first synthesis step (reagents A,B,C), a separate reaction is carried out in each segment (placing each reagent in one segment). Subsequently, the linear support is removed from the cylinder. The linear support now bears a set of repeating domains, the position of each specifying the identity of the compound. In the next step, the linear solid support is wrapped around another cylinder of a different well-defined circumference. Because the cylinder is of a different appropriate size, adjacent regions bear unrelated substances, and regions bearing like substances are distributed around the cylinder. In the second synthesis step, a second set of reagents (D,E,F,G) is applied, one to a segment. This second set of reagents, after removal of support from the cylinder, is seen to have formed a repeating pattern along the linear support. Since the period of the repeat is distinct from that of the first step, all combinations are formed. This process can be repeated with an arbitrary number of steps. Figure 3 also shows the unwrapped linear support and the regions created on it after three synthesis steps.
FIBER OPTICS
Evanescent Fiber-Optic Coupling in Multimode Fibers
Light can propagate under guided conditions in an optical fiber by total internal reflection within the fiber core. The refractive indices of the fiber core n co and the fiber cladding n cl determine the critical angle, Θ z = arcsin {n cl/n co}, the minimum angle of incidence for light rays at the core/cladding interface, for which guided modes exist. Obviously, for total internal reflection to occur n cl ≤ n co. Even under guided conditions the electric-field amplitude of a light mode in the fiber core extends into the fiber cladding according to: 6
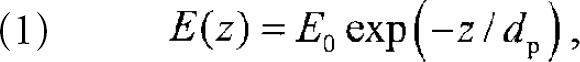
where E 0 is the electric-field amplitude at the core/cladding boundary and z is the distance normal to the core boundary. The penetration depth d p of these evanescent fields varies for each core mode (characterized by the incident angle with respect to the normal) according to
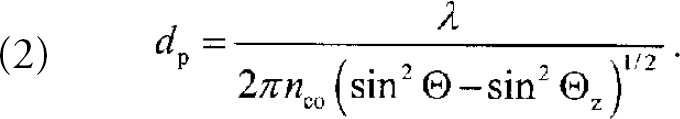
The exponential dependence of the evanescent fields (Eqn. 1) and the validity of Eqn 2. were verified experimentally. 7 Modes closer to Θ z and longer wavelengths λ/n co lead to increasing penetration depths.
Quasi-distributed fluorescent chemosensors are obtained by placing fluorophores at discrete regions along the optical fiber. Fluorophores present in the fiber cladding within the range of the evanescent fields may be excited, leading to an overall power loss in the fiber, which can be detected at the fiber end. For our applications, it is advantageous to monitor the fluorescence of the sensor molecules. Following evanescent excitation, light emitted by fluorophores in the fiber cladding may be “captured” by the evanescent tails of the guided core modes and propagate under guided conditions to the fiber ends. 8,9 Modes having larger penetration depths d p are able to collect more light than modes with smaller values of d p. Also, fluorophores located closer to the core/cladding boundary couple light more efficiently into the core. For homogeneously distributed fluorophores in the cladding, the light collection efficiency of the fiber is proportional to N 1/2, where N is the number of modes that can be sustained by the fiber. 8 In contrast to fiber-optic sensors that simply monitor cladding absorption, the fibers suited to fluorescent fiber-optic sensors are strongly guiding (n co ≫ n cl) with large core diameters.
Spatially Resolved Readout
When a continuous light source is used to read out quasi-distributed sensor arrays, only the aggregate response of all the sensor molecules can be monitored. Spatially resolved readout is achieved by using pulsed laser excitation and time-resolved detection. A laser pulse is coupled into the fiber core at the front end of the fiber (see Figure 4). Following the absorption of the exciting light pulse by fluorophores in the cladding, a fluorescence “pulse” is coupled back into the fiber core and propagates to the fiber ends. When detected at the front end of the fiber, the location L i of ith emitting fluorophore can be calculated from the time delay t i between exciting and returning pulses according to
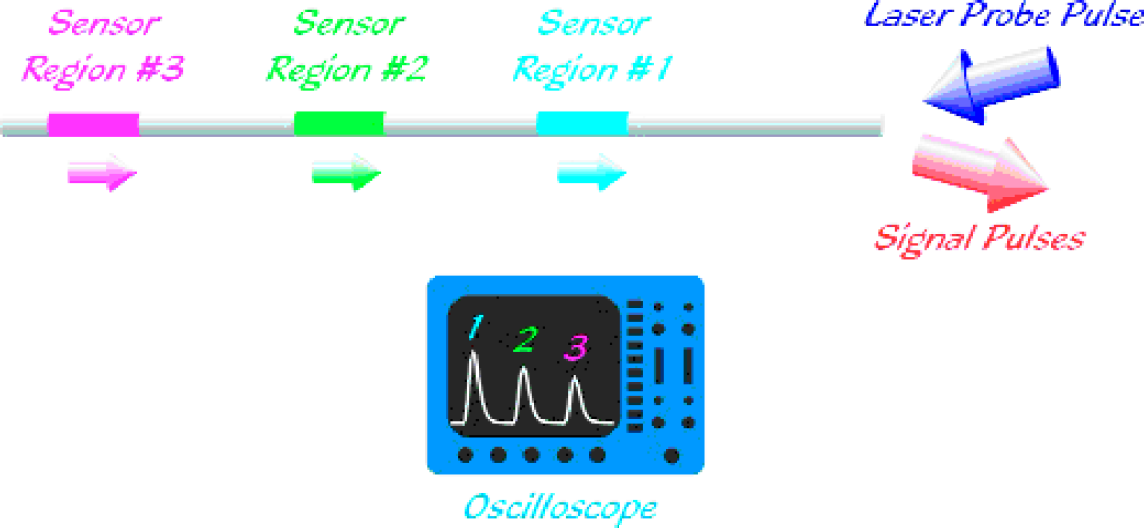
One-fiber scheme: Laser pulses are coupled into the fiber end. Fluorophores in the fiber cladding are excited evanescently. The fluorescence pulse is captured by the fiber and propagates to the fiber ends, where it is detected.
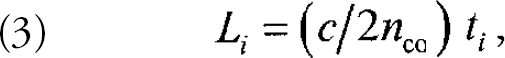
where c is the speed of light in vacuum. This method is known as fluorescent optical time domain reflectometry (FOTDR; for a review see Ref. 4).
At this point it is important to recall that the optical evaluation of combinatorial libraries synthesized in the cladding of optical fibers using our one-dimensional combinatorial chemistry technique and assayed with fluorescent tags is identical to the readout of the quasi-distributed fluorescent chemosensor arrays as described above. It is an inherent virtue of our one-dimensional combinatorial chemistry method that the location of a fluorophore along the fiber encodes the complete synthetic history of an assayed compound, meaning that the evaluation of combinatorial libraries is accomplished by simply measuring this location via FOTDR.
If there are many sensor regions on the fiber, the return signal consists of a train of pulses, each encoding in the time domain the spatial location of the emitters to which they pertain. The minimum separation ΔL i+1 between adjacent fluorescent regions required for the temporal resolution of the corresponding fluorescence pulses is determined by the fluorescence lifetimes τfl(i) of the ith fluorophore and by the desired length w i+1 of the detection time window (w i > 1 ∀i, where w is in units of the fluorescence lifetime):

For example, choosing n co = 1.457, τfl = 10 ns, and w = 2.5 yields a minimum separation of ΔL = 2.57 m. For the large combinatorial libraries and arrays of fluorescent chemosensors envisioned here, the total length of fiber needed can be substantial.
Two-Fiber Readout Scheme
We have overcome this limitation by introducing a readout scheme that employs two fibers (see Figure 5). On one fiber, the sensor regions may be spaced closer than the limit imposed by the fluorescence lifetimes. A second, much longer fiber contacts the first at each sensor region such that the latter are sufficiently spaced with respect to the second fiber to be temporally resolved. A laser pulse propagating through one fiber (the excitation fiber) may excite fluorophores in the sensor regions through evanescent coupling. A fraction of the emitted light from each region is then coupled evanescently into the second fiber (the detection fiber) and delivered, time resolved, to the detector. In the two-fiber readout scheme the location of a sensor is given by:
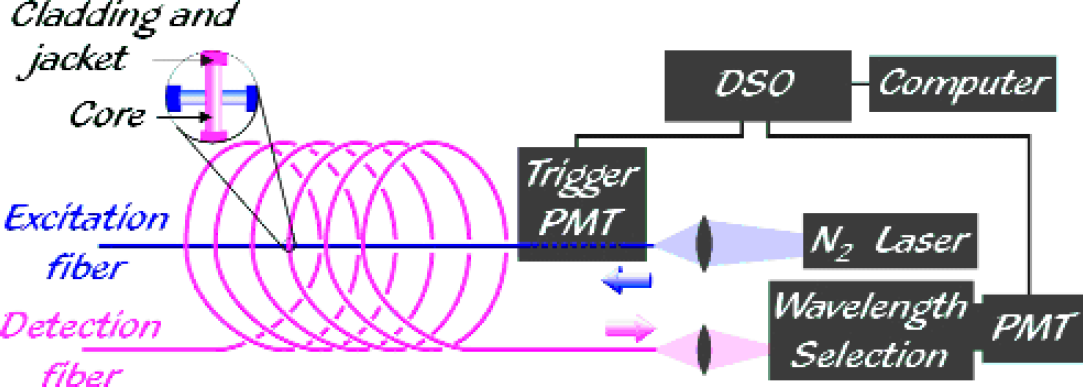
Two-fiber scheme: As in the one-fiber scheme, laser pulses excite fluorophores in the cladding evanescently. However, the fluorescence pulses are now captured by a second fiber, which provides an optical delay between successive pulses to allow for temporal resolution.
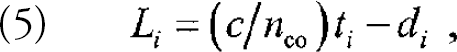
where L i is the position of the ith sensor region along the fiber that provides the optical delay between sensor regions with respect to a fluorescent reference region, 5 t i is the time delay between the arrival of the signal from region i and that from the reference region, d i is the distance between sensor region i and the reference region along the fiber on which the regions are closely spaced, c is the speed of light in vacuum, and n co is the core refractive index at the wavelength of the emitted fluorescence. For arrays of sensors with L i ≫ d i, as is the case for the studies presented here, this expression reduces to
Note that the factor of 1/2 in Eqn. 3 is absent in Eqns. 5 and 6. For both the one- and two-fiber schemes, a time reference is needed. The front-end reflection of the input pulse provides this reference in the one-fiber scheme, while in the two-fiber scheme a fluorescent reference region can be prepared for that purpose.
An additional benefit of the two-fiber scheme in combinatorial synthesis is that it allows for the separation of the optical delay from the synthesis support, and for separate optimization of the excitation and detection fibers’ distinct roles.
EXPERIMENTAL
The results presented here were obtained using several different experimental setups, all of which were based on the two-fiber scheme introduced above. The basic features of all setups are illustrated in Figure 5. In all cases, the detection fiber provided the optical delay between adjacent sensor regions. The light pulses originated from a nitrogen laser (Photon Technology International PL2300, wavelength 337 nm, typical pulse width 0.6 ns, typical pulse energies 1.4 mJ, typical pulse repetition rates 3 − 10 Hz). Fluorescence signals were detected with a photomultiplier tube (PMT - Burle C31034, 2.5-ns rise-time) and either a Hewlett Packard HP54505B or LeCroy LC564DL digital storage oscilloscope (DSO) with respective bandwidths of 300 MHz and 1 GHz, and sampling rates of 500 MSa/s and 4 GSa/s. A trigger for the DSO was generated using a second PMT (RCA 1P28, 1.6-ns rise-time), which either collected light scattered from the front end of the excitation fiber or light resulting from cladding fluorescence. The spectral decomposition of the signal, if used, was obtained using a 0.5 m monochromator (Jarrell Ash 82–000, 1.6-nm/mm linear dispersion).
The sensor regions were prepared by removing the fiber jacket and cladding at the junction(s) of the two fibers so that the two fiber cores, at an angle of 90° to one another, could come into contact. (Footnote 2) The junctions were then immersed in solutions containing fluorescent dyes. All fibers were multimode silica fibers with a TECS™ (trademark of 3M Corp.) cladding (Thorlabs/3M FT-200-UMT and FT-400-UMT with core diameters of 200 μm and 400 μm, respectively). Core and cladding refractive indices of all fibers were n co = 1.457 and n cl = 1.404, respectively. Although the TECS cladding shows some absorption in the UV region leading to transmission losses in the fiber, its use was advantageous since the cladding can be removed with acetone, preserving the core surface.
RESULTS AND DISCUSSION
The two-fiber detection scheme was first tested using the following configuration. A 200-μm fiber was coiled up on a 20-cm-diameter cylinder. Every nine windings (corresponding to a separation of 5.84 m or 28 ns), 1 cm of the fiber core was exposed. Six fiber-fiber junctions were created by running a 400-μm fiber with cladding and jacket removed orthogonally across each of these exposed regions, spanning approximately 1 cm between adjacent regions. These junctions were submerged in an aqueous solution of the dye Rhodamine 590 (R6G) at a concentration of 2.5 × 10⁻⁵ mol/L.
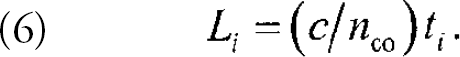
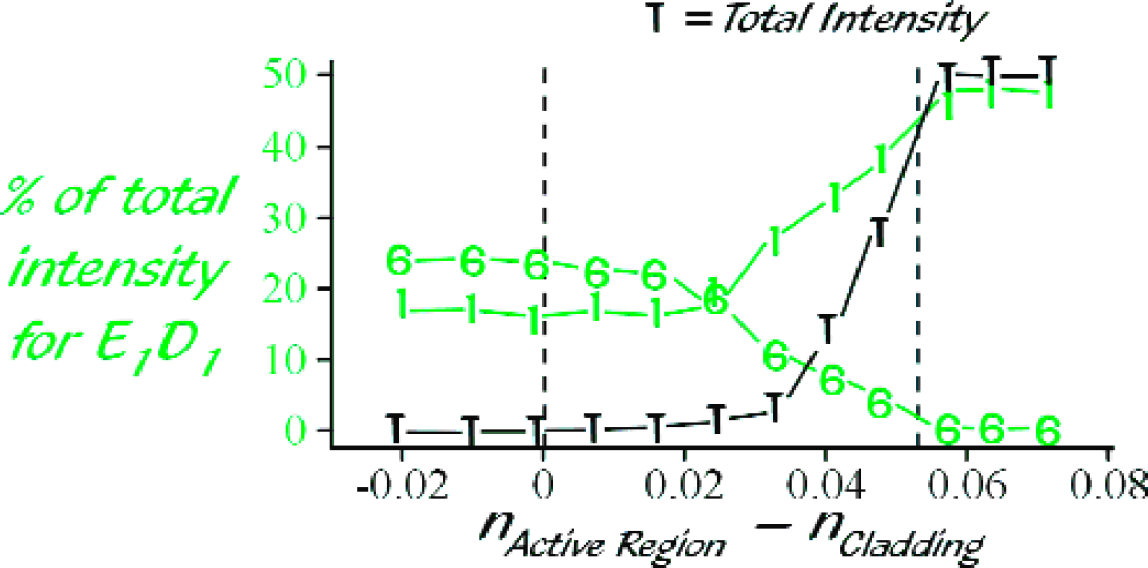
Figure 6 shows the detected signal, a train of six pulses. In spite of identical R6G concentrations in each region, the peaks’ intensities vary since they are influenced by the specific geometry in each junction. Comparison of Figures 6(a) and 6(b) yields information about the losses occurring in the excitation fiber. For both traces, detection occurred at the same end of the detection fiber, but the order of excitation was from region 1 to 6 for 6(a) and from the opposite end of the fiber, 6 to 1 for 6(b). Thus, any losses in the excitation fiber would result in the 6(a) trace being skewed in intensity towards the signal from region 1 relative to the 6(b) trace. Similarly, comparison of Figure 6(a) and 6(c) gives information about the losses in the detection fiber. The order of excitation is from region 1 to 6 for both of these traces, but for 6(a) readout occurs from the end of the detection fiber closest to region 1, and for 6(c) from the end closest to region 6 (resulting in this region being detected first). Again, losses in the detection fiber would result in trace 6(a) being skewed in intensity towards region 1 relative to trace 6(c). These results clearly show that there are no significant losses in either the excitation or detection fibers. A second set of weaker peaks is also present in the time traces in Figure 6. These peaks arise from reflections of the sensor fluorescence from the far-end (i.e., the non-detection end) of the detection fiber and arrive at the detector in reverse order with respect to the first six peaks.
Signal train from six fiber junctions: Curves (a) and (b) were detected at the same end of the detection fiber, but the order of excitation was from region 1 to 6 for 6(a) and, from the opposite end of the fiber, 6 to 1 for 6 (b). For both curves (a) and (c), the order of excitation was from region 1 to 6, but detection took place at opposite ends of the detection fiber. Note the second set of weaker peaks (see text).
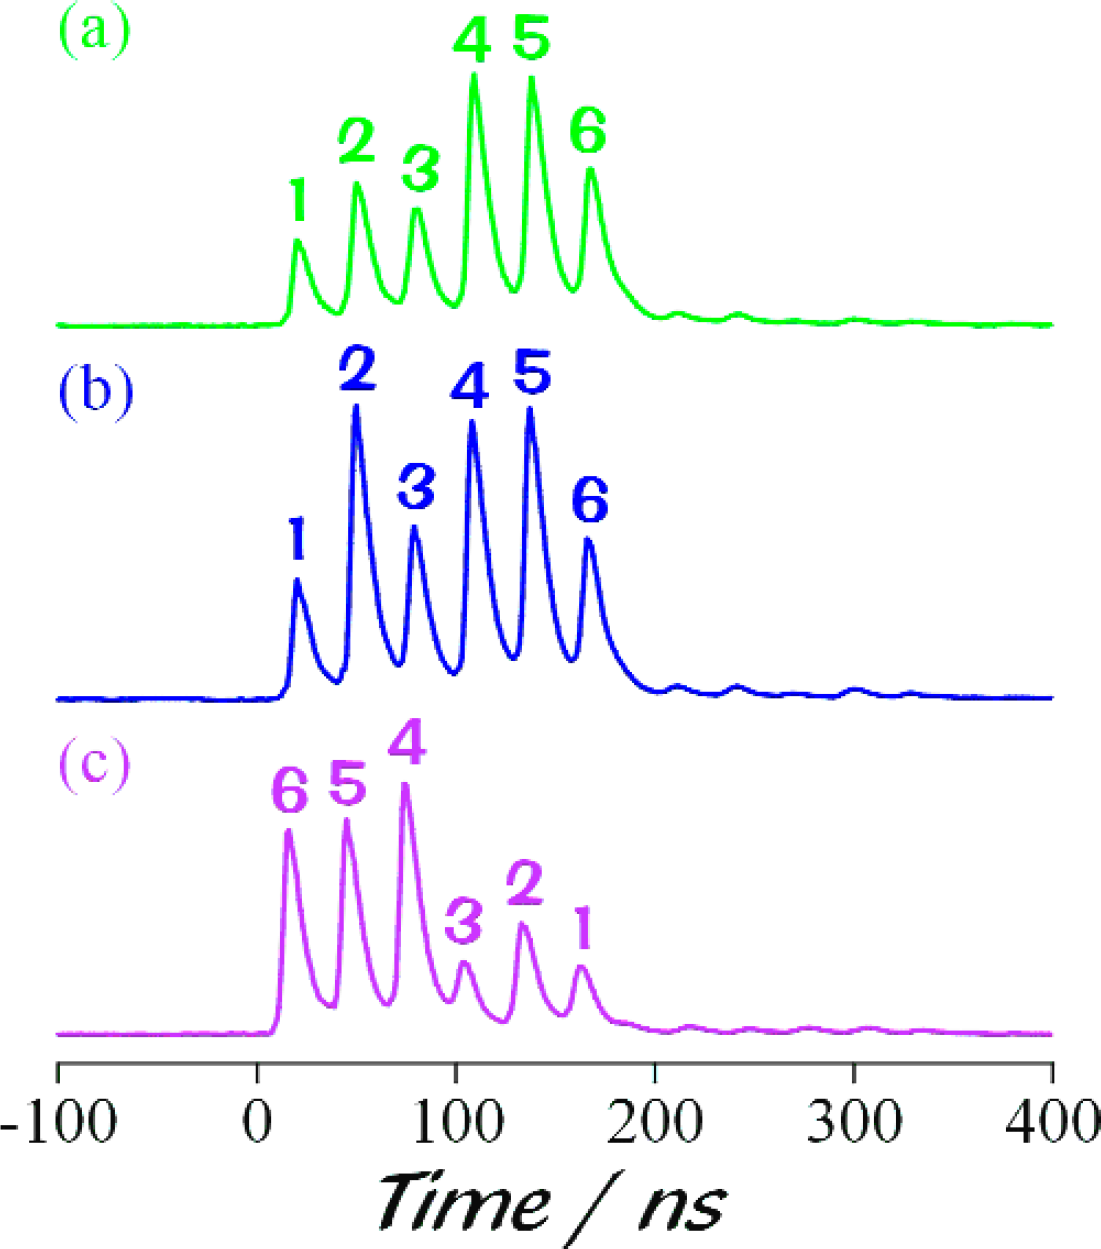
To test the dependence of the signal intensity on the refractive index of the solution surrounding the fiber junctions, we immersed all six fiber junctions in glycerol/water mixtures of varying composition, maintaining a constant R6G concentration of 2.5×10⁻⁵ mol/L. The refractive indices n r of these solvent mixtures ranged from 1.3797 to 1.4712 (measured with an Abbé-type refractometer - AO Scientific Instruments). Figure 7 shows the refractive-index dependence for a series of 12 solutions. First we look at the integrated intensity from all six sensor regions (indicated by the black ‘T's). As the refractive index of the sensor regions approaches that of the original cladding n cl, coupling is only via an evanescent mechanism. The evanescent penetration depths of populated modes increase, however, at the sensor regions due to the decreasing critical angle (see Eqn. 2), which causes the integrated intensity to increase (although not visibly on the scale of Figure 7). For solution refractive indices between that of the fiber core and original cladding, the more efficient refractive coupling mechanism becomes predominant and the integrated intensity increases dramatically. Finally, the integrated intensity plateaus for refractive index values greater than that of the fiber core due to the fact that all light is lost from the fiber via a refractive coupling mechanism at the first few sensor regions so there can be no further increases in the excitation of sensor molecules.
Refractive index dependence: The integrated intensity from all six regions (black ‘T's) is plotted versus the refractive index of the solution at the fiber junction. The green colored lines represent the integrated intensities originating from the first and sixth region as a percentage of the total intensity from all six regions.
The light colored lines in Figure 7 represent the integrated intensities for the fluorescence signals originating from the first and sixth region as a percentage of the total intensity from all six regions. For solvent refractive indices between 1.38 and 1.41, the intensities remain largely unchanged. The same holds true for solvent refractive indices above 1.46. In each of these ranges, the mechanism of light coupling out of the fiber is constant: evanescent in the former case and refractive in the latter. In the intermediate region with 1.41< n r < 1.46, the transition from evanescent coupling to refractive coupling takes place. As refractive coupling becomes the dominant process, the intensity changes vary dramatically for different peaks. The intensity of the first peak increases with increasing refractive index, while the sixth peak decreases in intensity. Overall, there is a redistribution of relative intensity towards those sensor regions that lie closer to the input ends of the fibers.
For measuring the sensitivity of evanescent coupling between the two fibers, a setup containing a single junction approximately 1 m along the excitation fiber was employed. The fluorescence signal traveled through 500 m of the detection fiber to the detector.
The junction was immersed in an aqueous solution of R6G, and the R6G concentration increased by factors of ten starting from 10−10 mol/L, until an R6G fluorescence signal could be discerned above the level of the background signal. The average of 1000 time-traces obtained for each concentration was integrated and divided by the integrated, averaged reference time-trace from the trigger PMT. The results are depicted in Figure 8. An R6G concentration of 10−7 mol/L can easily be detected above the background signal, with potential for significant improvement.
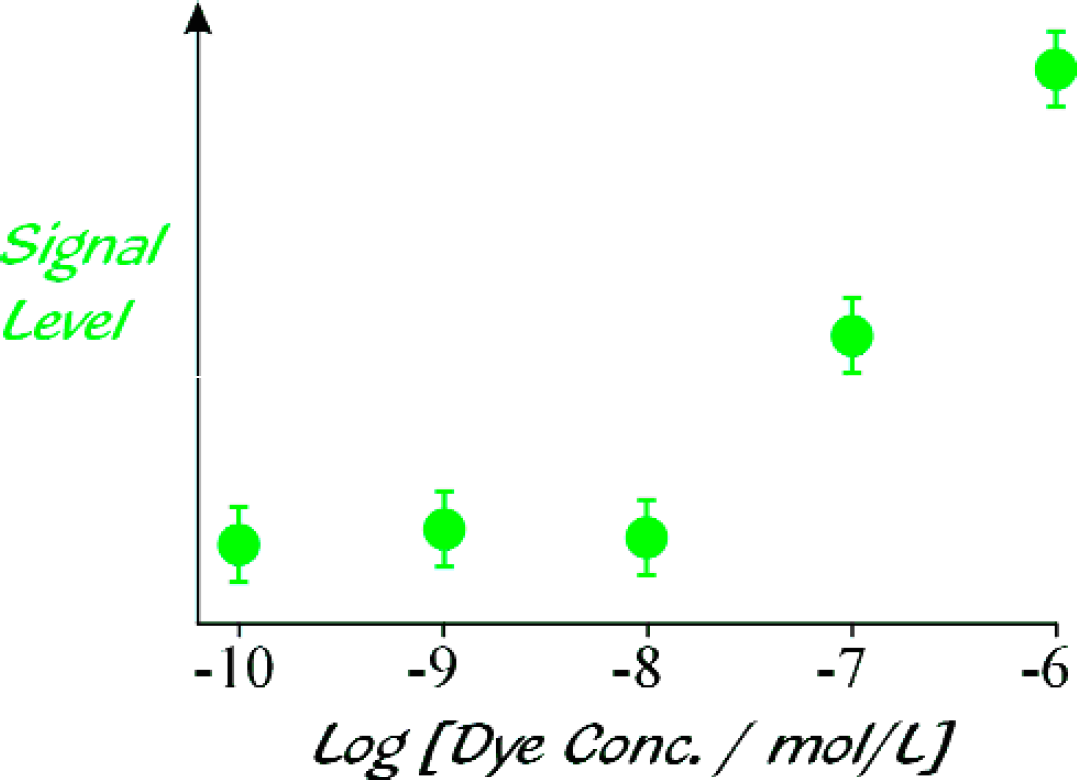
Detection sensitivity: Dependence of signal intensity on the concentration of R6G in aqueous solution. For each concentration 1000 time-traces were integrated and divided by the integrated, averaged reference time-trace from the trigger PMT.
Lastly, we applied the two-fiber scheme to multicomponent arrays, in order to investigate how closely packed sensor regions containing different dyes (Stilbene 420 (S420), Coumarin 500 (C500), Rhodamine 590 (R6G), LDS698 - all Exciton) can be spatially and spectrally resolved. Te n sensor regions were prepared, separated by a time equivalent of only −9.5 ns along the 200-μm-diameter detection fiber. The regions were then immersed in a drop of agarose gel swelled with aqueous solutions of the dyes, with each region containing a single type of dye. Along the 400-μm-diameter excitation fiber, the sensor regions were spaced by approximately 5 mm of fiber. The sequence of dyes from the end of the detection fiber closest to the detector, was: S420; LDS698; R6G; C500; S420; LDS698; C500; S420; LDS698; C500 (numbered 1 − 10 in Figure 9). The signal intensities are plotted vs. time and emission wavelength in Figure 9. A time trace recorded with no spectral dispersion results in complete overlap of the signals from all ten regions. However, as shown in Figure 9, when the output of the detection fiber is spectrally dispersed, the resolution is such that the signals from all ten sensor regions are clearly visible.
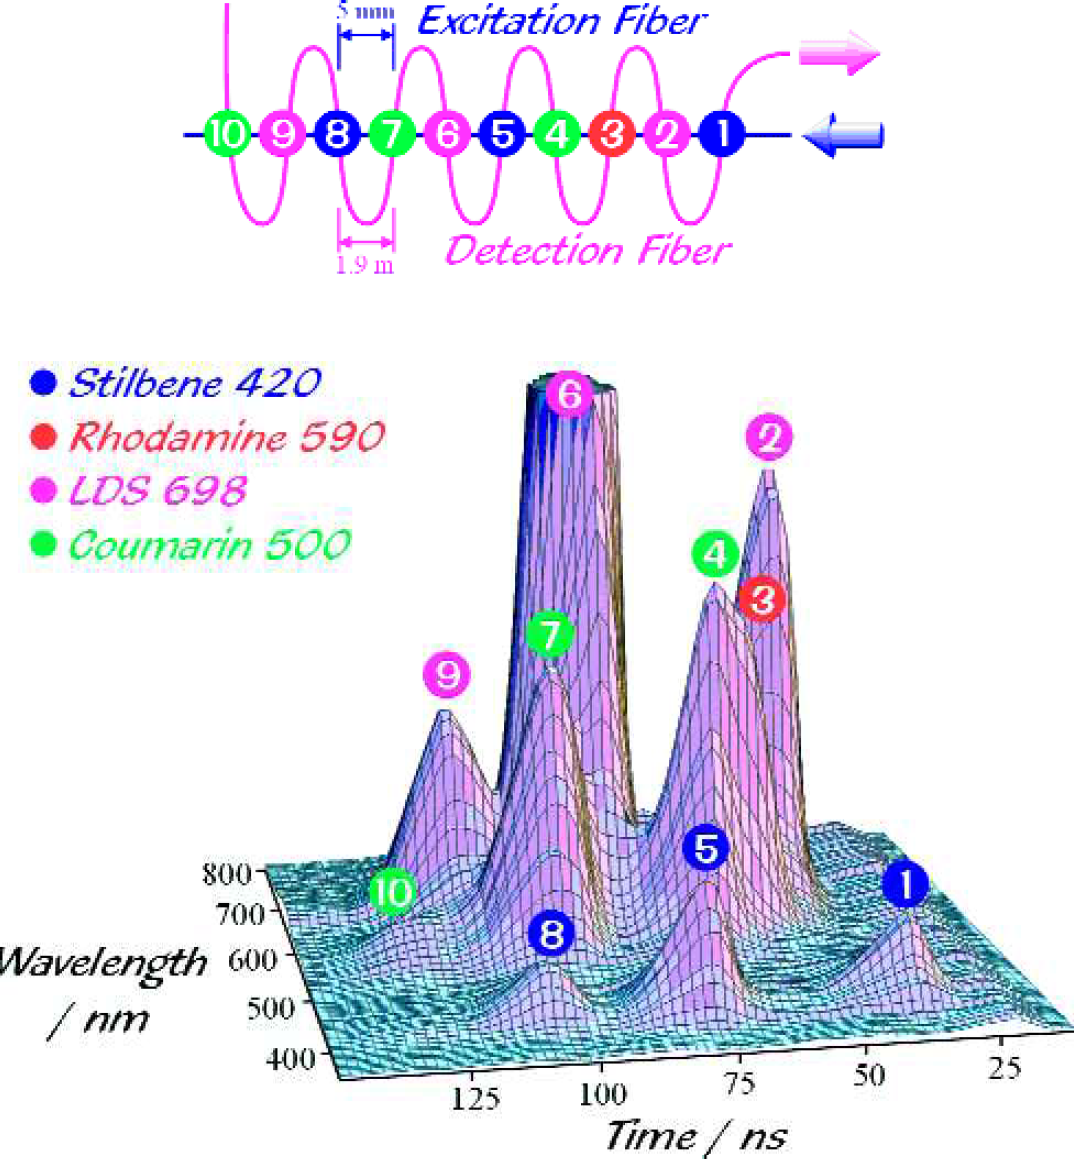
Multicomponent array consisting of ten regions: The top panel shows the arrangement of the various dyes on the fiber. The bottom panel shows the signal intensities versus time and wavelength. All ten regions are accounted for.
CONCLUSIONS AND OUTLOOK
Our new one-dimensional combinatorial chemistry method allows for the fabrication of large libraries of compounds on linear supports. The method offers tremendous flexibility as to the functionality of the compounds in the library. For example, the library could consist of only a few different compounds, with the sequence repeating hundreds of times. Conversely, the library could consist of hundreds of different compounds. Whether fluorescent chemosensors are made this way or whether a library of potential drugs is subjected to a fluorescent assay, common to both is that the evaluation of the library is performed optically using the fluorescence originating from a certain region along the linear support. When optical fibers are used as linear supports, spatially resolved optical evaluation can take place by sending laser pulses down the fiber core. The goal of this work was to determine the conditions required for the readout of large, diverse arrays of fluorescent chemosensors located in the cladding of optical fibers and to show that with a two-fiber readout scheme the minimum spacing between adjacent fluorophores can be much less than dictated by the fluorescence lifetimes in a one-fiber scheme. That the two-fiber scheme can indeed significantly increase the spatial resolution was verified with a single-component six-region array and a multi-component array containing ten sensor regions. Using the multi-component array, we have shown that spectral discrimination of the different fluorophores is possible, in spite of the fact that the two fibers are only weakly coupled through their evanescent fields.
At the junctions between the two fibers, the original cladding of the fiber has to be replaced with a porous substance, which, depending on the application, allows for the access of the analyte to the chemosensors or for the diffusion of the reactants of the successive synthesis steps to the products of previous steps. An important consideration for such a host substance is its refractive index. We have shown that for minimum light losses to occur (therefore allowing for the readout of large arrays) the refractive index of the host substance has to be equal to or less than the refractive index of the original cladding. The latter is retained as fiber cladding outside of the fiber-fiber junctions. As for the sensitivity of the two-fiber detection scheme, we were able to easily detect fluorophore concentrations of 10−7 mol/L, with potential for much improvement.
ACKNOWLEDGEMENTS
This material is based upon work supported by the National Science Foundation under Grants CHE-9874241 (AWS) and CHE-0078895 (PG). Additional funding was provided by the University of Wisconsin-Milwaukee Campus Opportunity Fund (PG).
Footnotes
1
In this context, we use the term “fully parallel” in a very restrictive sense, to specify not only that a given synthetic step is carried out simultaneously for the entire library, but also that each reagent used in a given step need be handled only once.
2
“Contacting” does not necessarily mean touching; the fibers only have to be close enough for the evanescent fields of both fibers to overlap sufficiently.