
Abstract
Most laboratories interested in autophagy use different imaging software for managing and analyzing heterogeneous parameters in immunofluorescence experiments (e.g., LC3-puncta quantification and determination of the number and size of lysosomes). One solution would be software that works on a user’s laptop or workstation that can access all image settings and provide quick and easy-to-use analysis of data. Thus, we have designed and implemented an application called IFDOTMETER, which can run on all major operating systems because it has been programmed using JAVA (Sun Microsystems). Briefly, IFDOTMETER software has been created to quantify a variety of biological hallmarks, including mitochondrial morphology and nuclear condensation. The program interface is intuitive and user-friendly, making it useful for users not familiar with computer handling. By setting previously defined parameters, the software can automatically analyze a large number of images without the supervision of the researcher. Once analysis is complete, the results are stored in a spreadsheet. Using software for high-throughput cell image analysis offers researchers the possibility of performing comprehensive and precise analysis of a high number of images in an automated manner, making this routine task easier.
Introduction
Examining cells by microscopy has long been a primary method for studying cellular function, and microscopy is an essential tool for studying autophagy.1,2 When cells are appropriately stained, visual analysis can reveal some hallmarks of autophagy, such as protein turnover.1,2 Current microscopy techniques allow researchers to easily collect (now, in a single day) thousands of high-resolution cell images from time-lapse experiments and large-scale screens using chemical compounds, RNA interference, or expression plasmids. However, this large amount of information must be analyzed, and this task may occupy a high percentage of a researcher’s time.
In this sense, although human observers typically score one or, at most, a few cellular characteristics, image microscopy simultaneously yields many informative cell measurements, including the intensity and localization of each fluorescently labeled cellular component within each subcellular compartment and the number, size, and shape of these subcellular compartments. Image-based analysis is thus versatile, inherently multiplexed, and high in information content.
In contrast, human-scored image analysis is qualitative, and samples are usually categorized as hits (where normal physiology is grossly disrupted) or nonhits. By contrast, automated analysis rapidly produces consistent, quantitative measures for every image. In addition to uncovering subtle samples of interest that may otherwise be missed, systems-level conclusions can be drawn directly from the quantitative measurement of every image.3,4
Quantitative image analysis is capable of detecting some characteristics that are not readily detectable by the human eye, including the number of LC3-puncta and quantification of vacuolated area.
Researchers and companies are developing new powerful immunofluorescence markers and in vivo assays.5,6 Simultaneous use and quantification will improve the characterization and interpretation of autophagy experiments.
Finally, image microscopy is less labor intensive and has higher throughput. Appropriate software produces reliable results from large-scale experiments within hours versus months of tedious visual inspection. This improvement is more than an incremental technical advance because it removes the one remaining bottleneck for routinely conducting such experiments.
Prior to the work presented here, researchers have used several open-source biological image analysis packages such as ImageJ/NIH Image 7 or CellProfiler. 8 Moreover, commercial software has been developed, mainly for the pharmaceutical screening market, by companies. 9 It is important to note that this software has been directly designed from autophagic measures in our lab and with the intent to improve problems observed with other software applications, which are generally image solutions with autophagy applications. Such software applications, which are designed to determine autophagy measurements, are mainly used for only specific valuations. 10 However, with IFDOTMETER, researchers can measure the most relevant hallmarks for determining the presence of autophagy.
Here, we describe IFDOTMETER, a software program capable of objectively measuring a variety of cellular changes, mainly involving autophagy and cell survival determinations, with high throughput in a simple and easy manner. In this article, we demonstrate the technical details and provide a brief description of the software, validate the software in a variety of real-world biological scenarios, and demonstrate the breadth of its utility with the hopes of stimulating new ideas and helping the scientific community open their minds to IFDOTMETER software.
In summary, we present a new, simple, and quick software application for quantifying microscopy images. IFDOTMETER is a free and useful resource for autophagy researchers, making their studies more objective and automated and improving results and saving time.
Materials and Methods
Cell Culture and Transfection
Human fibroblasts (HFs) were cultured in Dulbecco’s Modified Eagle Medium–High Glucose (Sigma-Aldrich, W9926W) supplemented with 10% fetal bovine serum (FBS; Sigma-Aldrich, F7524), 1% L-glutamine (Sigma-Aldrich, G7513), and penicillin-streptomycin (Hyclone, W9912H). Murine embryonic fibroblasts (MEFs) were maintained in culture flasks coated for 30 min with 0.1% (w/v) gelatin prior to use. These cells were grown at 37 °C and 5% CO2 in Iscove’s Modified Dulbecco’s Medium with L-glutamine (Gibco, 11510596) supplemented with human recombinant epidermal growth factor (EGF; 10 ng/mL; Invitrogen, 10533084), 1X Insulin Transferrin Selenium-A (Gibco, 51300044), 10% (v/v) FBS (Sigma-Aldrich, F7524), and penicillin-streptomycin (Hyclone, W9912H). For the overexpression of LC3-B, MEFs were transfected with the pDest-mCherry-GFP-LC3B vector, which was kindly provided by Ph. T. Johansen using lipofectamine reagent (Invitrogen, 11668-019), according to the manufacturer’s protocol.
Treatments
Cells were treated with 1-methyl-4-phenylpyridinium (MPP+; 3 mM; Sigma-Aldrich, D048) or carbonyl cyanide m-chlorophenylhydrazone (CCCP; 10 µM; Sigma-Aldrich, C2759) for 24 h to induce apoptotic cell death or mitochondrial fragmentation, respectively. Cells were treated with hydrogen peroxide (H2O2; 125 µM; Sigma-Aldrich, H1009) for 24 h to induce oxidative stress. To analyze autophagy flux, the cells were preincubated with Bafilomycin A1 (Baf A1; 100 nM; LC Laboratories, B1080) for 1 h to block autophagy and then treated with Baf A1 (100 nM) in Earle’s balanced salt solution medium (EBSS; Sigma-Aldrich, E2888) for 6 h to induce autophagy. In the case of lysosomal size measurement, MEFs were treated with EBSS for 6 h.
Immunofluorescence
Cells were seeded on coverslips pretreated with poly-L-lysine (Sigma-Aldrich, P4707), fixed with paraformaldehyde (PFA; 4% w:v; Fluka-Chemical, 76240), permeabilized with Triton X-100 solution (0.1% v:v in phosphate-buffered saline 1X; Sigma-Aldrich, T9284), and stained with an anti-Tom20 antibody (BD Biosciences, 556432) to measure mitochondrial morphology or an anti-LC3B antibody (Sigma-Aldrich, L7543) to visualize autophagic structures. The cells were then incubated with Alexa Fluor 568 anti-mouse (Invitrogen, A11031) or Alexa Fluor 488 anti-rabbit (Invitrogen, A11008) secondary antibodies. Chromatin condensation was labeled with Hoechst 33342 (Ho, 2 µM; Sigma-Aldrich, 101174857). For reactive oxygen species (ROS) quantification, cells were stained in vivo with dihydroethidium (He, 5 µM; Invitrogen, D1168) for 15 min at 37 °C, and they were then fixed with PFA. To measure lysosome size, cells were labeled in vivo with Lysotracker Red DND-99 (LTR, 2 µM; Invitrogen, L7528) for 15 min at 37 °C and then fixed with PFA. Fluorescence images were analyzed with an inverted fluorescence microscope (IX51, Olympus) equipped with a camera (DP70, Olympus).
Results
Software Description
IFDOTMETER was developed to optimize the manner in which analysts study and process images presented in a microscope and acquired by a digital camera. The main aim of this tool is to automatically extract and analyze all of the information from images of interest in a batch mode (i.e., in a sequential manner without human assistance). Therefore, experts can focus on completing other activities and tasks while the application works and generates the results.
IFDOTMETER, in its first version, was created in the Java JDK 1.6 + Netbeans development environment, which ensures the capability of being executed in any operating system with Java JRE integration, including Windows, Linux, and Mac OS. We have developed the totality of the application, including libraries for image reading and processing, math operations, and data exporting.
The main features offered by this tool include the following:
The ability to open an unlimited number of image files or a complete folder for batch processing
Automatic detection and identification of each image of cell areas and calculating its size from the pixel size
Automatic detection of proteins within each cell (for each image), providing the number of protein groups, size, location, and mean color (according to filter and contrast coloring)
RGB image combinations from images of the same cell image using different tying colorings
Export of generated results to the CSV format, ensuring complete compatibility with office applications, such as MS Excel or OpenOffice Calc, and allowing the user to redefine the results with better accuracy (if needed), create charts, or generate additional calculations.
Analysis preview; this function allows for testing different parameters in certain images and verifying the results the application will return
IFDOTMETER has been developed following a schema composed by an interface, which collects all the information required to work from the user, and a processing module, which performs the respective operations to the image sequence ( Fig. 1 ).
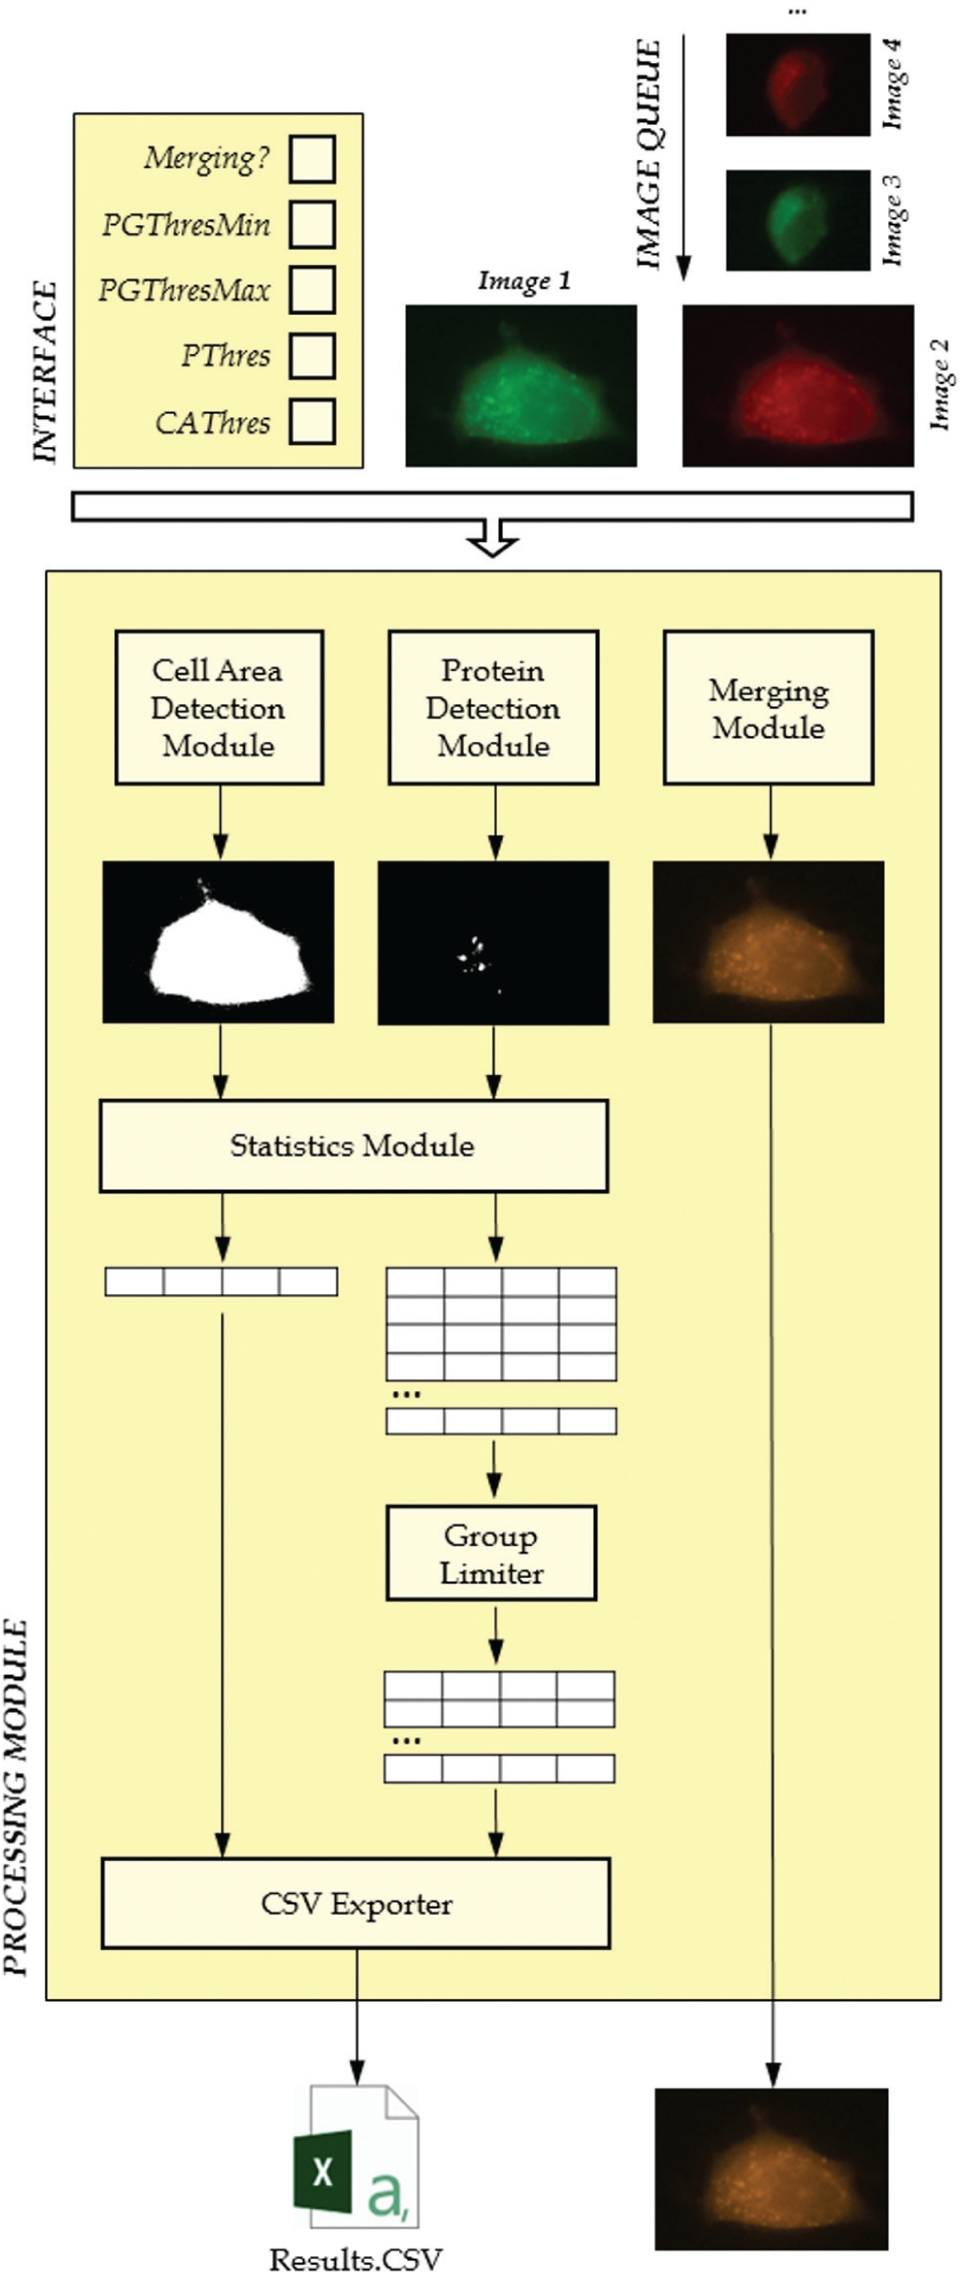
Technical design of the IFDOTMETER application.
Interface
IFDOTMETER has been designed to measure specific autophagy/apoptosis markers in whole immunofluorescence. It has a user-friendly interface ( Fig. 2A ) that can be used to determine all of the parameters described below.
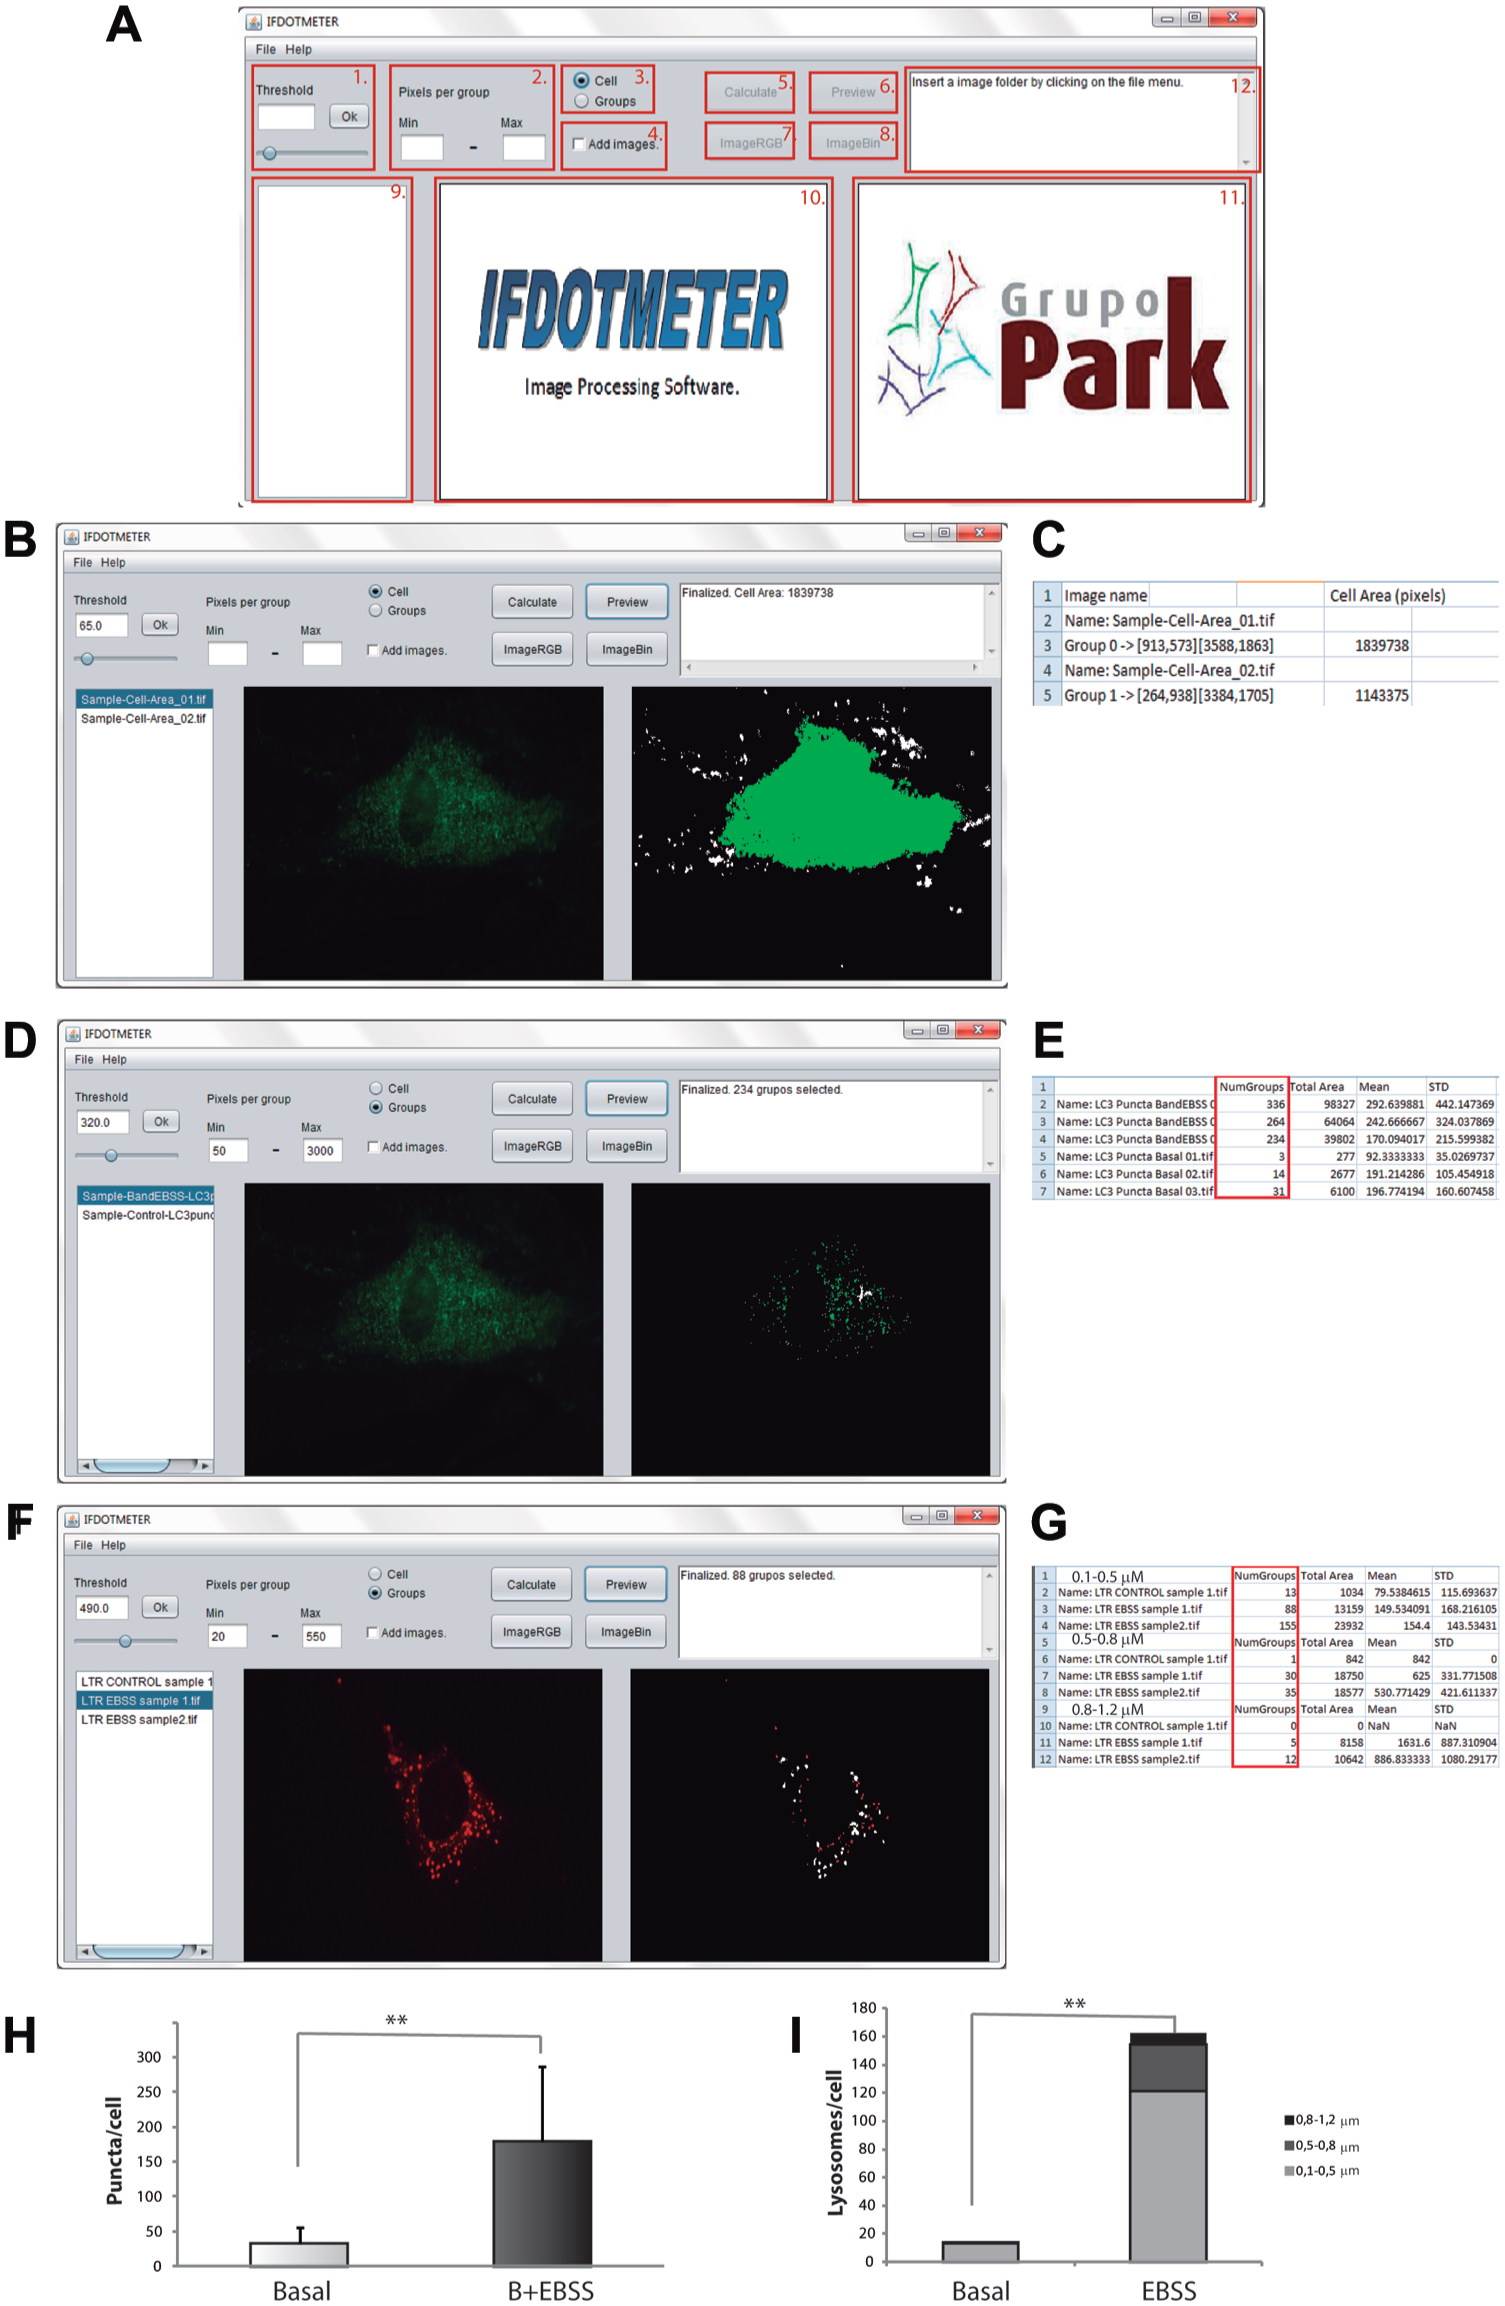
IFDOTMETER interface. Measurement of cell area, autophagic structures, and lysosomal size using IFDOTMETER software. (
File tab
A “File tab” contains a drop-down menu to open either specific files (“Open files” option) or an entire folder (“Open folder” option). With the “Open files” option, you can choose more than one image by clicking Ctrl + a mouse click.
Help tab
The “Help tab” contains the authors’ names and a direct link to the user manual.
Threshold panel: This panel is used to define the fluorescence intensity that will be recognized by the software as stained. This panel can be modified by dragging the horizontal bar to a specific value or typing a value between 0 and 1000 in the white box and pressing the “OK” button to confirm changes.
Pixels per group panel: This panel was created to specify the range of pixels that the software detects as a single group. This setting may be modified by typing in at least one of the fields. These changes will be saved automatically. Groups outside of the defined range will be automatically discarded in further “groups” analysis.
Cell/groups switch: These buttons provide users the ability to switch between a cell or groups measurements. The “Cell” option is used to measure the cell area in a single cell image. The “Groups” option is used to measure all of the groups in a whole image according to threshold and pixels per group values.
Add images: IFDOTMETER can merge images by clicking this option and pressing the “Calculate” button. With more than two pictures, the software automatically matches couples of pictures in the order displayed in the “Image Name” window. Merged images are automatically saved in the same folder that contains the original pictures, which are named Merge 1, Merge 3, etc.
Calculate button: This button is used to analyze all of the pictures previously loaded with a certain “Threshold” and “Pixels per group” parameters set. The results from this analysis are saved in a text file in the CSV format with the possibility of importing them into MS Excel, OpenOffice Calc, and other spreadsheet tools. The generated CSV file includes the name of the picture, position, color, and number of pixels for each analyzed group and, at the end of the analysis, a summary table with the name of the image, total groups analyzed, total area stained, and mean and standard deviation of the groups in the picture.
Preview button: This button performs a quick analysis of the binary image displayed in the ImageBIN window according to the “Threshold” and “Pixels per group” parameters. Groups selected are marked in green, red, or yellow in the ImageBIN window according to the color recognized by the software. The “Notification” window will display either the total of the selected groups according to the established settings (if the “Groups” option is checked) or the size of the cell area (if the “Cell” option is checked).
ImageRGB button: This button shows the RGB image selected in the “Image RGB” window.
ImageBIN button: This button generates a binary image from the image selected in the “Image” window using the threshold previously set. This image will be displayed in the “ImageBin” window so a visual comparison between the RGB and BIN images can be easily performed.
Image Name window. This window contains the names of images previously loaded in the program sorted in alphanumeric order. Clicking on any of the images will open the corresponding RGB or binary image for visualization.
Image RGB window: This window shows the selected RGB image.
Image Bin window: This window shows the binary image corresponding to the selected RGB image.
Notification window: This window shows the current status of the program or prompts the user to do something that the software needs to work, and it also displays results from the “Preview” button.
Processing Module
The processing module is composed of a sequence of submodules that apply different transformations to the input images according to the user’s requirements. The main inputs will be defined by the user in a previous configuration phase, along with the group of images to be processed in a batch mode (composing the image queue).
In computation, RGB images can be considered as three-dimensional functions f(R,G,B) in which values are generally represented by either a byte (values from 0 to 255) or a float number if more accurate operations are required. However, for this work, we have considered RGB values represented by a byte type.
In this way, each image f(R,G,B) of the queue will be processed as follows:
Cell Area Detection: The value of threshold CAThres provided by the user will be used to perform a basic threshold operation to each image, resulting a binary image fCAD such as
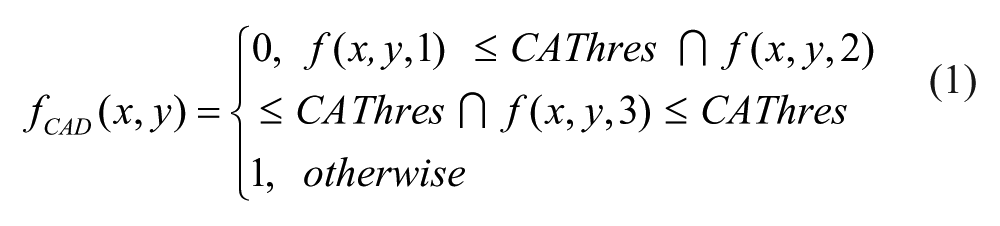
This image should contain only a big group of pixels representing the area of the complete cell.
Protein Detection: The value of threshold PThres typed by the user will be used to perform a basic threshold operation to each image, resulting a binary image fPD such as:
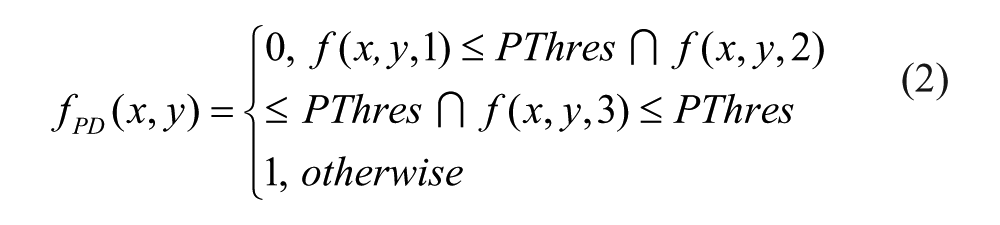
This image should contain small groups of pixels representing the proteins within the cell.
Statistics: This module makes use of the SGroup algorithm, developed by the authors for other works related to image information retrieval. This algorithm is capable of getting the groups composed by nearby detected pixels very fast with only three image overpasses.
11
It also extracts some information, such as the (x,y)i location of the central point, the number of pixels (NPi), and mean color (
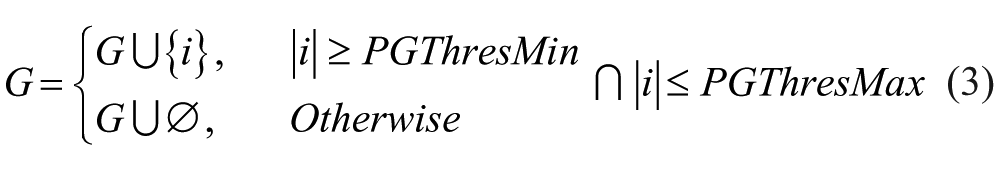
Group Limiter: Very small or big groups detected by the Protein Detection Module may not be considered as such, because they may not be part of the main cell, belong to thermal noise from the acquisition device, or not suit the user’s requirements. In this case, the technician can optionally define two new threshold values PGThresMin and PGThresMax, which will represent the range of pixels for a group to be considered. The information of every group i with either fewer pixels than PGThresMin or more pixels than PGThresMax will be removed from the set G and will not be considered anymore in the processing chain.
CSV Exporter: This module receives all the information of the pixel groups from the Cell Area Detection Module and the Protein Detection Module and transforms it to CSV format, 12 readable by the user. CSV is a text-based format in which table rows and columns can be represented by character symbols (# and ; for instance). This format is fully compatible with a lot of analysis tools, such as MS Excel, so analysis can be completed with ancillary custom operations.
Merging Module: The technician can optionally use this module to perform a direct addition of the current image to the following one in the image queue (always in pairs), getting a yellow-dyed image for further analysis. The image queue should have been correctly sorted by the user before starting the processing. The addition of two images f(x,y) and g(x,y) is performed as follows:

Applications
Measure Cell Area
The measurement of cellular area is frequently used in immunofluorescence to indicate results obtained relative to the total cell area. The cell area can be measured using any dye that defines cell shape (e.g., an anti-LC3 antibody), followed by a secondary dye. The application of IFDOTMETER in this case is performed as follows:
For HFs, the conditions use to define cell shape were set as follows: “Cell” selection and low threshold (i.e., 65) because it allows an automatic detection of the entire cell area as a single group ( Fig. 2B ).
Export of the results into a spreadsheet. The “Cell Area (pixels)” column ( Fig. 2C ) indicates the cell area in pixels for each image.
Cautions: This mode (“Cell” option) picks only the largest group in an image; therefore, it is strongly recommended that one ensure that the threshold does not divide whole cells into smaller groups. In addition, this measurement is not recommended for images containing more than one cell because the largest of the cells or two cells stuck together will be recognized as only one. In contrast, it is not necessary to avoid small groups because of background or nonspecific staining because these will not be included in the measurements, because only the biggest group is considered.
Autophagy Marker Measurement
The study of autophagy markers by immunofluorescence may be one of the most common and useful tests developed for the autophagy field.1,2 The presence or absence of autophagic structures can be analyzed by labeling the LC3 protein with specific antibodies and measuring the number of LC3 dots or LC3-puncta, which corresponds to the LC3-II isoform and is responsible for autophagosome formation and the mechanism underlying autophagy. 13 Application of IFDOTMETER for autophagy marker measurement was performed as follows:
Using HFs, the software settings were “Group” choice, “Threshold”: 320, and range between 50 and 3000 for “Pixels per group.” Staining from the background or nonpuncta LC3 was avoided using these parameters ( Fig. 2D ).
The number of LC3-puncta groups in each image is shown in the “NumGroups” column in the spreadsheet ( Fig. 2E ). Using Baf + EBSS as an LC3-puncta inducer, there were 179.5 ± 107.1 puncta per cell, and the rate for nontreated cells was 32.3 ± 20.9 ( Fig. 2H ).
Cautions: It is strongly recommended to set the threshold value for the inducer plus inhibitor treatment to avoid overestimation of these treatments in the measurements.
Lysosomal size measurement
In addition to quantifying the number of lysosomes in cells under different conditions, which can be determined using the application described above, evaluating whether lysosomes are more engulfed is important to obtain an idea of the lysosomal activity. 14 In this sense, the IFDOTMETER “Pixels per group” panel provides a simple way to quantify and separate lysosomes of specific sizes. We can label lysosomes with specific lysosomal antibodies such as LAMP1 or lysosomal markers such as Lysotracker Red DND-99 (Invitrogen, L7522). Application of IFDOTMETER was performed as follows:
Using MEFs, the conditions for the software were as follows: Threshold: 490, “Groups” selection, from 20 to 550 “Pixels per group” to measure 0.1 to 0.5 µm in diameter lysosomes, from 550 to 1400 to quantify 0.5 to 0.8 µm lysosomes and from 1400 to 3100 to evaluate 0.8 to 1.2 µm lysosomes.
IFDOTMETER separated one lysosome from all of the others ( Fig. 2F ). The number of lysosomes in each defined range is shown in the “NumGroups” column ( Fig. 2G ).
Using EBSS as an autophagy inducer, there were 121.5 ± 28.7 lysosomes of 0.1 to 0.5 µm in treated cells compared with 13.4 ± 4.3 lysosomes in nontreated cells; there were 32.5 ± 3.53 lysosomes of 0.5 to 0.8 µm compared with 1 ± 0.32 in nontreated cells and 8.5 ± 4.8 lysosomes of 0.8 to 1.2 µm for treated cells compared with 0 lysosomes of 0.8 to 1.2 µm for nontreated cells.
Caution: Lysosomal sizes were defined in 4080 × 3072 images. Otherwise, a new correlation between the pixels and lysosomal area would be necessary.
Nuclear Condensation
One of the morphologic hallmarks for apoptosis detection is condensation of nuclear chromatin. 15 This event can be measured by immunofluorescence using blue-fluorescent dyes, such as Hoechst or DAPI. Apoptotic nuclei are smaller and stain brightly with condensed chromatin. In contrast, normal chromatin is dimly labeled. In our study, we selected Hoechst 33342 (Ho) as a chromatin marker. Application of IFDOTMETER for this case was performed as follows:
For HFs, the following conditions were established to select for only apoptotic nuclei: “Threshold”: 750, “Group” selection and a minimum (min) of 3000 pixels per group (min). A high threshold allows for the detection of only apoptotic nuclei, whereas normal nuclei are undetectable because they are under the threshold ( Fig. 3A ).
Quantification is then obtained and placed in the exported spreadsheet, representing the corresponding number of apoptotic nuclei in each picture in the “NumGroup” column ( Fig. 3B ).
Once nuclei with chromatin condensation are counted, we measure all of the nuclei using a lower threshold (threshold 400) and maintaining the same parameters as above. For example, MPP+ treatment induces 52.3% ± 6.4% of cells with chromatin condensation, whereas 8.1% ± 3.2% untreated cells present chromatin condensation ( Fig. 3E ).
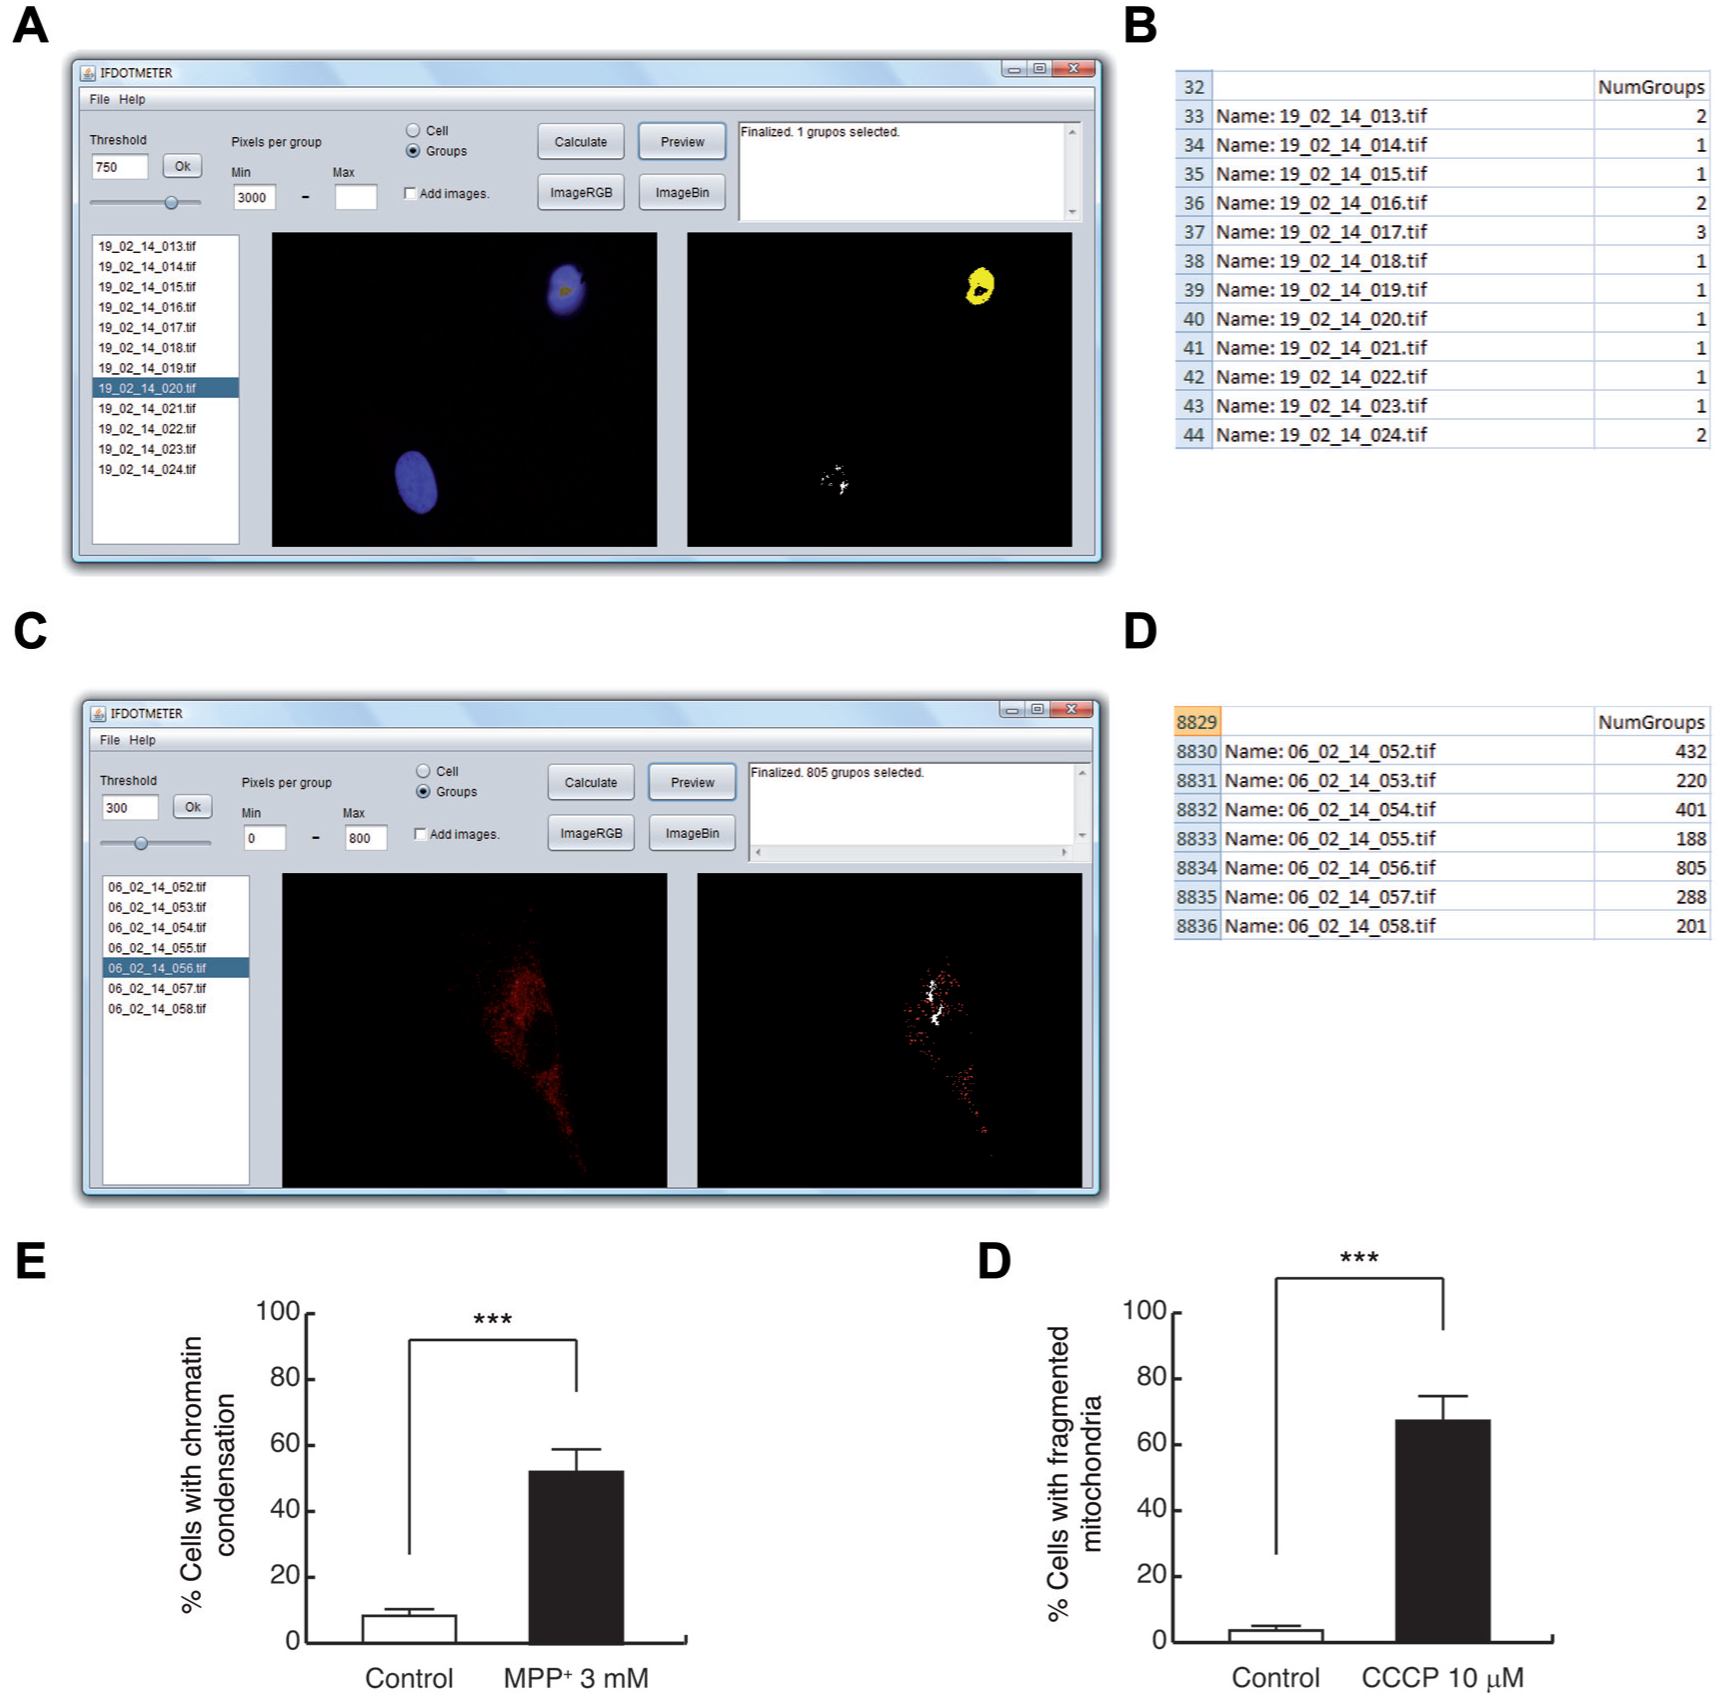
Measurement of apoptotic nuclei and mitochondrial morphology, using IFDOTMETER software. (
Cautions: It is recommended to obtain images from well-separated nuclei because the software could consider closer nuclei as one.
Mitochondrial Morphology
Mitochondria are highly dynamic organelles regulated by several processes, including fusion/fission mechanisms. Depending on that, mitochondria appear as an interconnected tubular network or as a fragmented and discontinuous network. We can analyze mitochondrial morphology with immunofluorescence by labeling this organelle with antibodies directed against mitochondrial proteins (as Tom20 16 ), dyes (as Mitotracker 17 ), or plasmids (as DsRed-mito 6 ). The application of IFDOTMETER in this case was performed as follows:
Using HFs, the conditions used were: “Threshold”: 300, “Group” selection and a minimum of 800 pixels per group. Fragmented mitochondria were uncounted because they had fewer pixels than the minimum number of pixels per group ( Fig. 3C ).
The number of fragmented mitochondria for each image is shown in the “NumGroups” column in the spreadsheet ( Fig. 3D ). Using CCCP as mitochondrial fission inducer, there were 67.2% ± 7.1% of HFs that present fragmented mitochondria, whereas the rate for untreated cells was 3.5% ± 1.7% ( Fig. 3F ).
Cautions: It is recommended to obtain high-quality images because the software could measure multiple smaller mitochondria as a large one.
Autophagy Flux Using pDest-mCherry-EFGP-LC3B
One of the most interesting applications that IFDOTMETER can perform is the automatic measurement of transfections related to autophagy flux, such as those involving pDest-mCherry-EGFP-LC3B 18 or pDest-mCherry-EGFP-p62. 19 For this aim, it is important to have an initial positive control for autophagy flux in your experiment because this condition will determine your application threshold for correctly quantifying your immunostaining and will help in determining the positivity and size of puncta in two fluorescences (red and green dots) as well. In this sense, we used the combined effects of a macroautophagy classical inducer, EBSS starvation medium, and Baf A1, which blocks autophagolysosome formation, but you may use other treatments with the same effects. To set up the threshold, we suggest checking all of the double-positive images (in our case, EBSS + Baf A1 treatment) and select the best adjusted threshold for each one. With these different thresholds, the user can calculate the average threshold that may be used as an objective and automatic value to measure the rest of the images (red or green). Figure 4 shows an example of setting up the thresholds for both fluorescences. Application of IFDOTMETER for this case was performed as follows:
The image was loaded, and the “imageRGB” and “imageBin” buttons were selected to observe the thresholded binary image ( Fig. 4A ).
A new threshold value was set, and after pressing the “OK” button, the message monitor displayed the text “threshold changed.” Once the “imageBin” button was selected, the new binary image was displayed on the right.
Different threshold values were tested, and the best for each picture was selected. Then, we performed the same steps for the green pictures and decreased the threshold values as needed.
This process was repeated for all of the pictures, and an average was made using all values.
With the new threshold, dot size was selected, the “Cell option” was changed to the “Group option,” and the range of values “Pixels per group: min and max” was set. We set a fixed value using the previously selected threshold because we were interested in the quantity and proportion among the red and green dots under the different conditions and not their size. We used the range of 50 to 30,000 pixels for both fluorescences to select actual puncta and not small groups of puncta. Figure 4B shows selected puncta in red or green to the right of the program after clicking the “Preview” button ( Fig. 4B ).
Finally, the generated results file ( Fig. 4C ) was checked and analyzed. This experiment could be represented on one hand as “Quantity of red and green puncta pixels/number of cells” ( Fig. 4D , red dots Co = 67.535 ± 3.945, green dots Co = 53.628 ± 1.337; red dots EBSS + Baf A1 = 88.089 ± 2583, green dots EBSS + Baf A1 = 86.586 ± 3.432) or on the other hand as “Autophagy degradation/cell area.” In this case, it is necessary to estimate the difference between the total red and green pixels in each cell and divide this value by the cell area ( Fig. 4E ; Co = 2.93 ± 0.544; EBSS + Baf A1 = 1.06 ± 0.203).
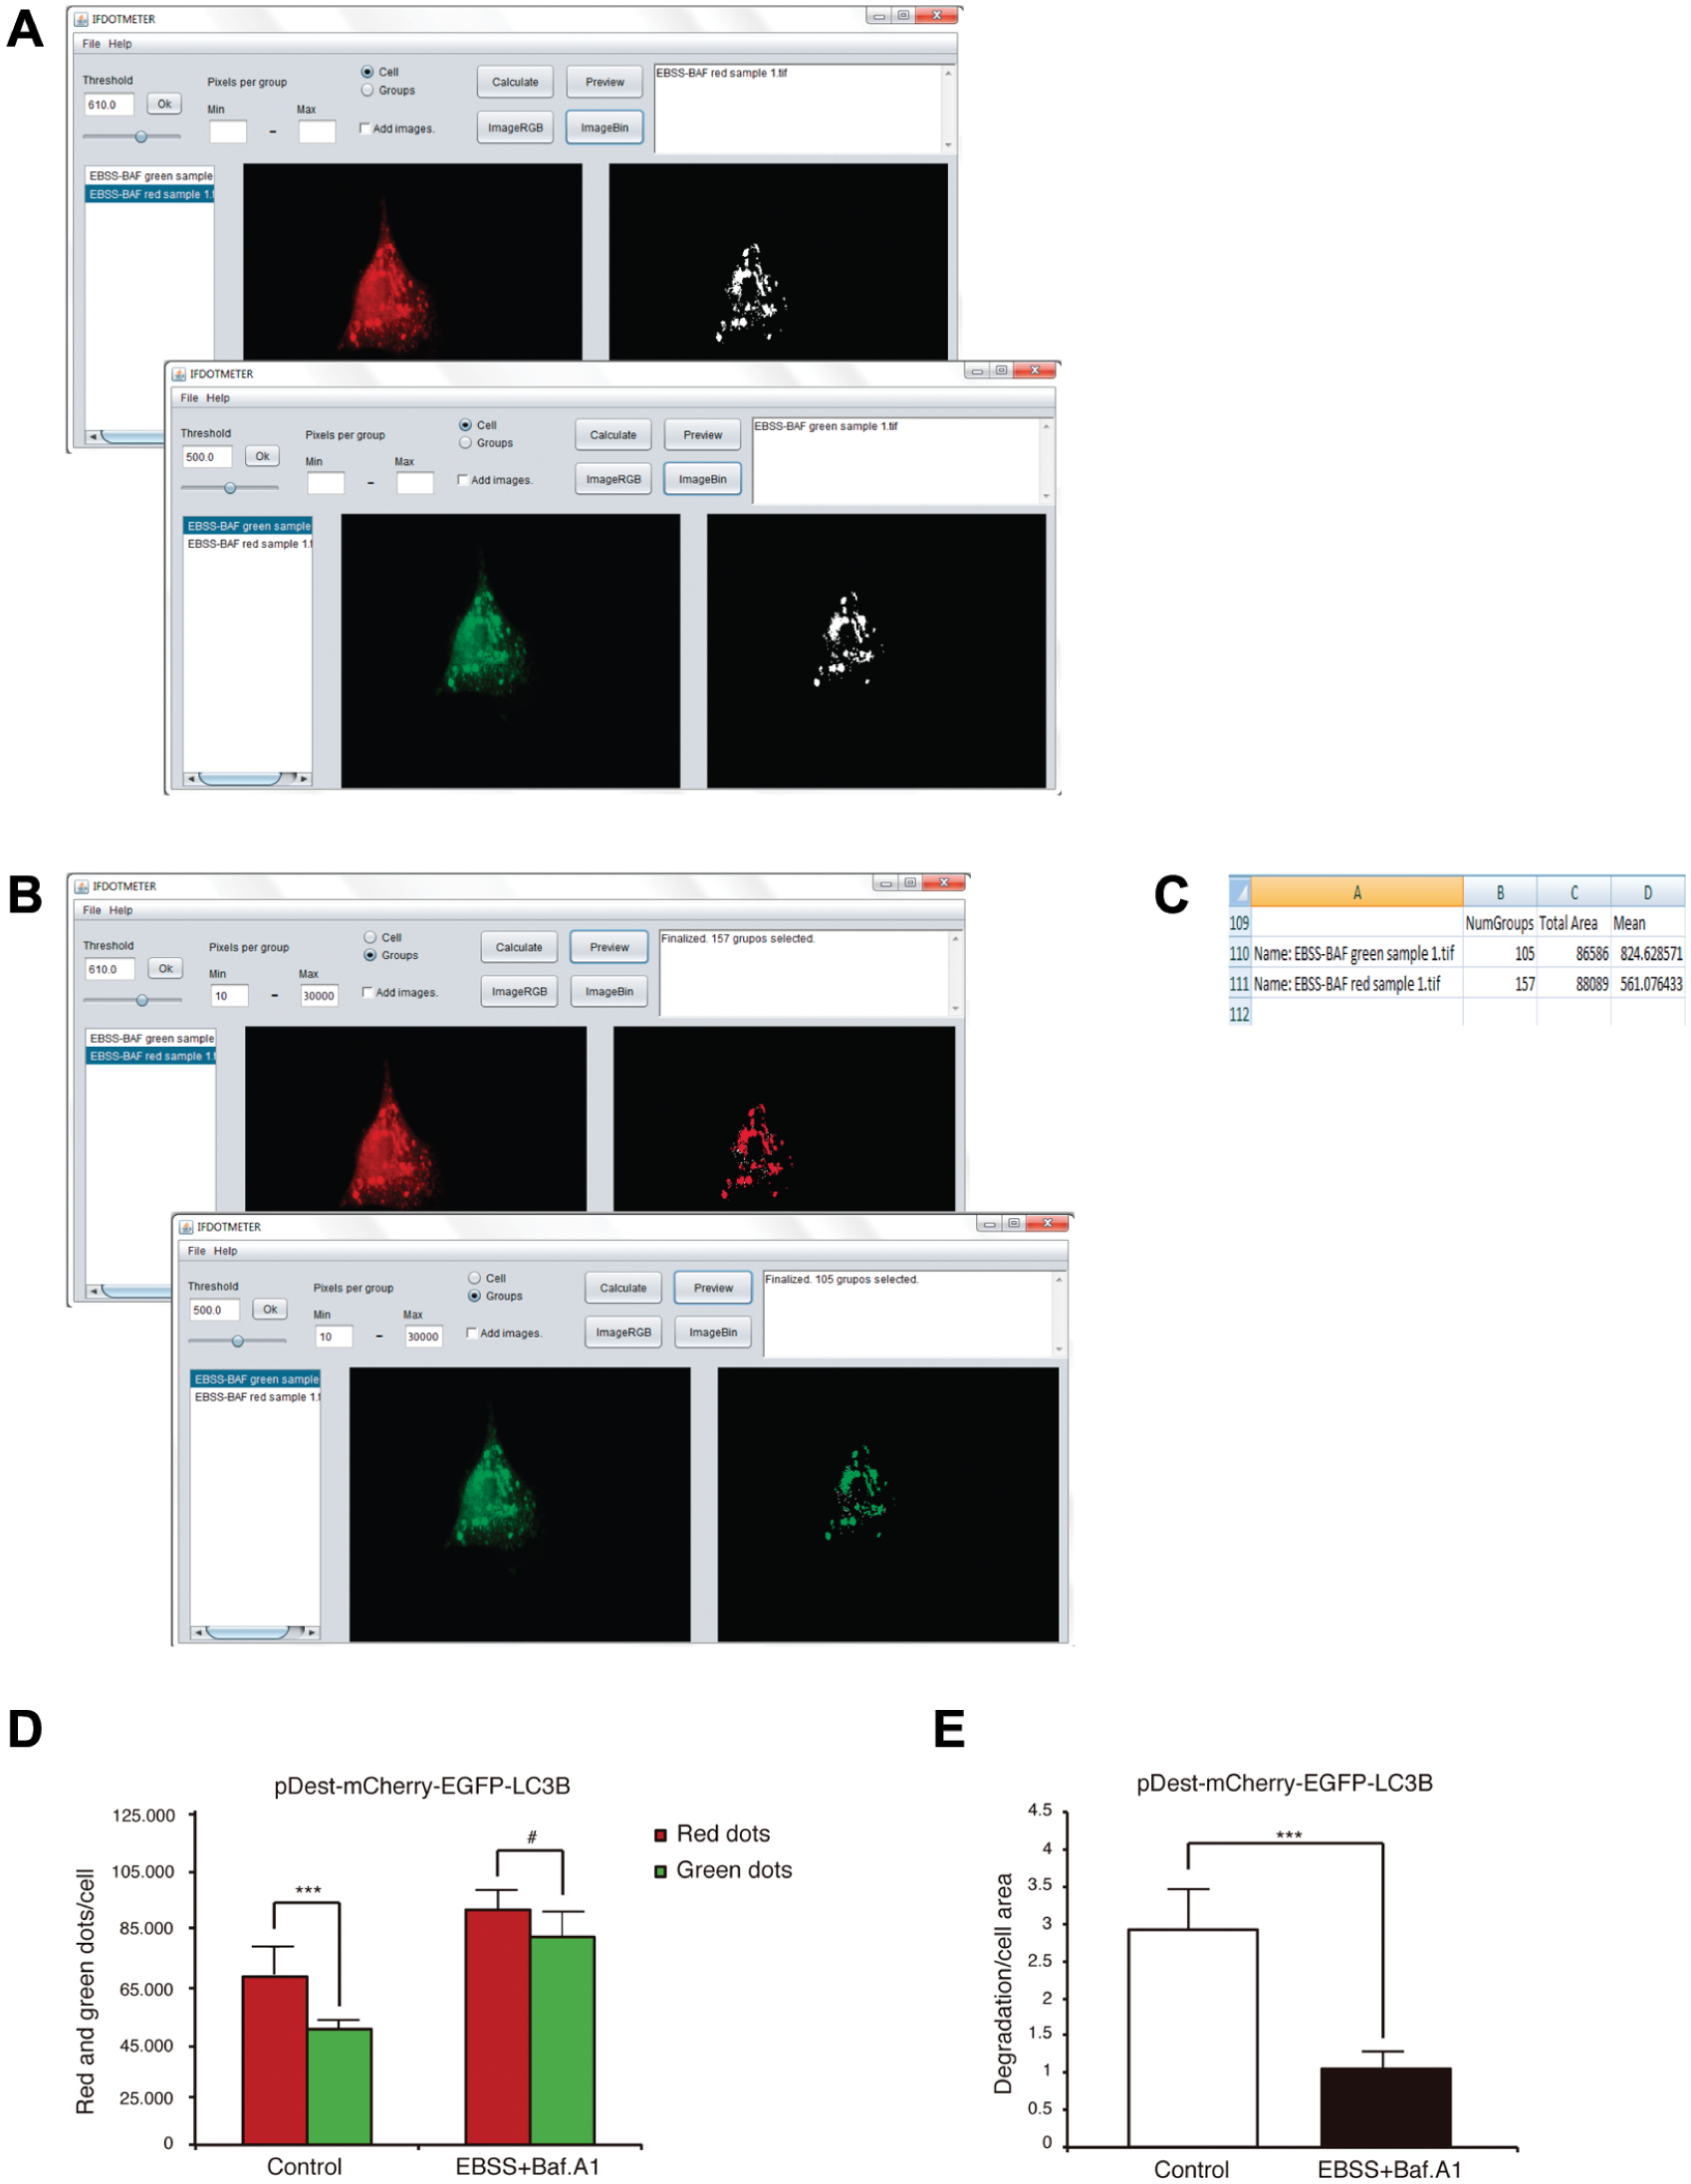
Measurement of pDest-mCherry-EFGP-LC3B using IFDOTMETER. (
Caution: We recommend obtaining the microscopy images using a high zoom objective and trying to capture just one cell per photo because it is easier to measure the autophagy LC3 or p62 dots in this manner. It is better if the user separates photos into two different folders (i.e., one for green images [GFP fluorescence] and one for red images [mCherry-fluorescence]) because these images will likely have different thresholds, and this action would assist a user in setting them up (this tip is a general recommendation for staining with two fluorescences).
Measure of ROS
Quantifying ROS is important in some injuries or cellular processes because it may be a key or a consequence in such mechanisms. 20 In this particular case, we will show how to quantify ROS in cells using dihydroethidium (hydroethidine), a peroxide indicator. Dihydroethidium exhibits blue fluorescence in the cytosol until oxidized. Oxidation by superoxide to 2-hydroxyethidium changes its fluorescence to red, and this intensity could be quantified using IFDOTMETER. First, it is important to have a positive control for ROS in your experiment because this condition will determine the application threshold for correctly quantifying the immunostaining and help in determining positive staining. We used H202 (125 µM) as a positive control. Application of IFDOTMETER in this case was performed as follows:
In the initial setup, the best threshold must be selected to objectively measure all of the red fluorescence with the options “Threshold” and “Cell.” To set up the threshold, we suggest checking all of your positive photos (in our case, H2O2 treatment) and selecting the best-adjusted threshold for each one.
With these different thresholds, we obtained an “Average threshold,” and it was considered our objective and automatic value for measuring images.
An image was selected, and different threshold values were tested to determine the best value. In Figure 5A , it is possible to observe the procedure when you have more than one cell in each image and differences between control and H2O2 treatment.
With the threshold set, we changed the option to “Groups” instead of “Cell” and set a minimum (i.e., 10 pixels). We fixed a minimum value with the previously selected threshold because we were interested in all of the positive dots and groups in the image at this threshold ( Fig. 5A ).
Finally, the generated results file was analyzed ( Fig. 5B ). This experiment could be represented by dividing the value of each picture by the number of cells in the image (you have to count it on your own) and then calculating the average of all values obtained under this condition. This result may be expressed as “Average red pixels/cell” ( Fig. 5C ; Co = 108.003 ± 10.277; H2O2 = 200.048 ± 12.781).
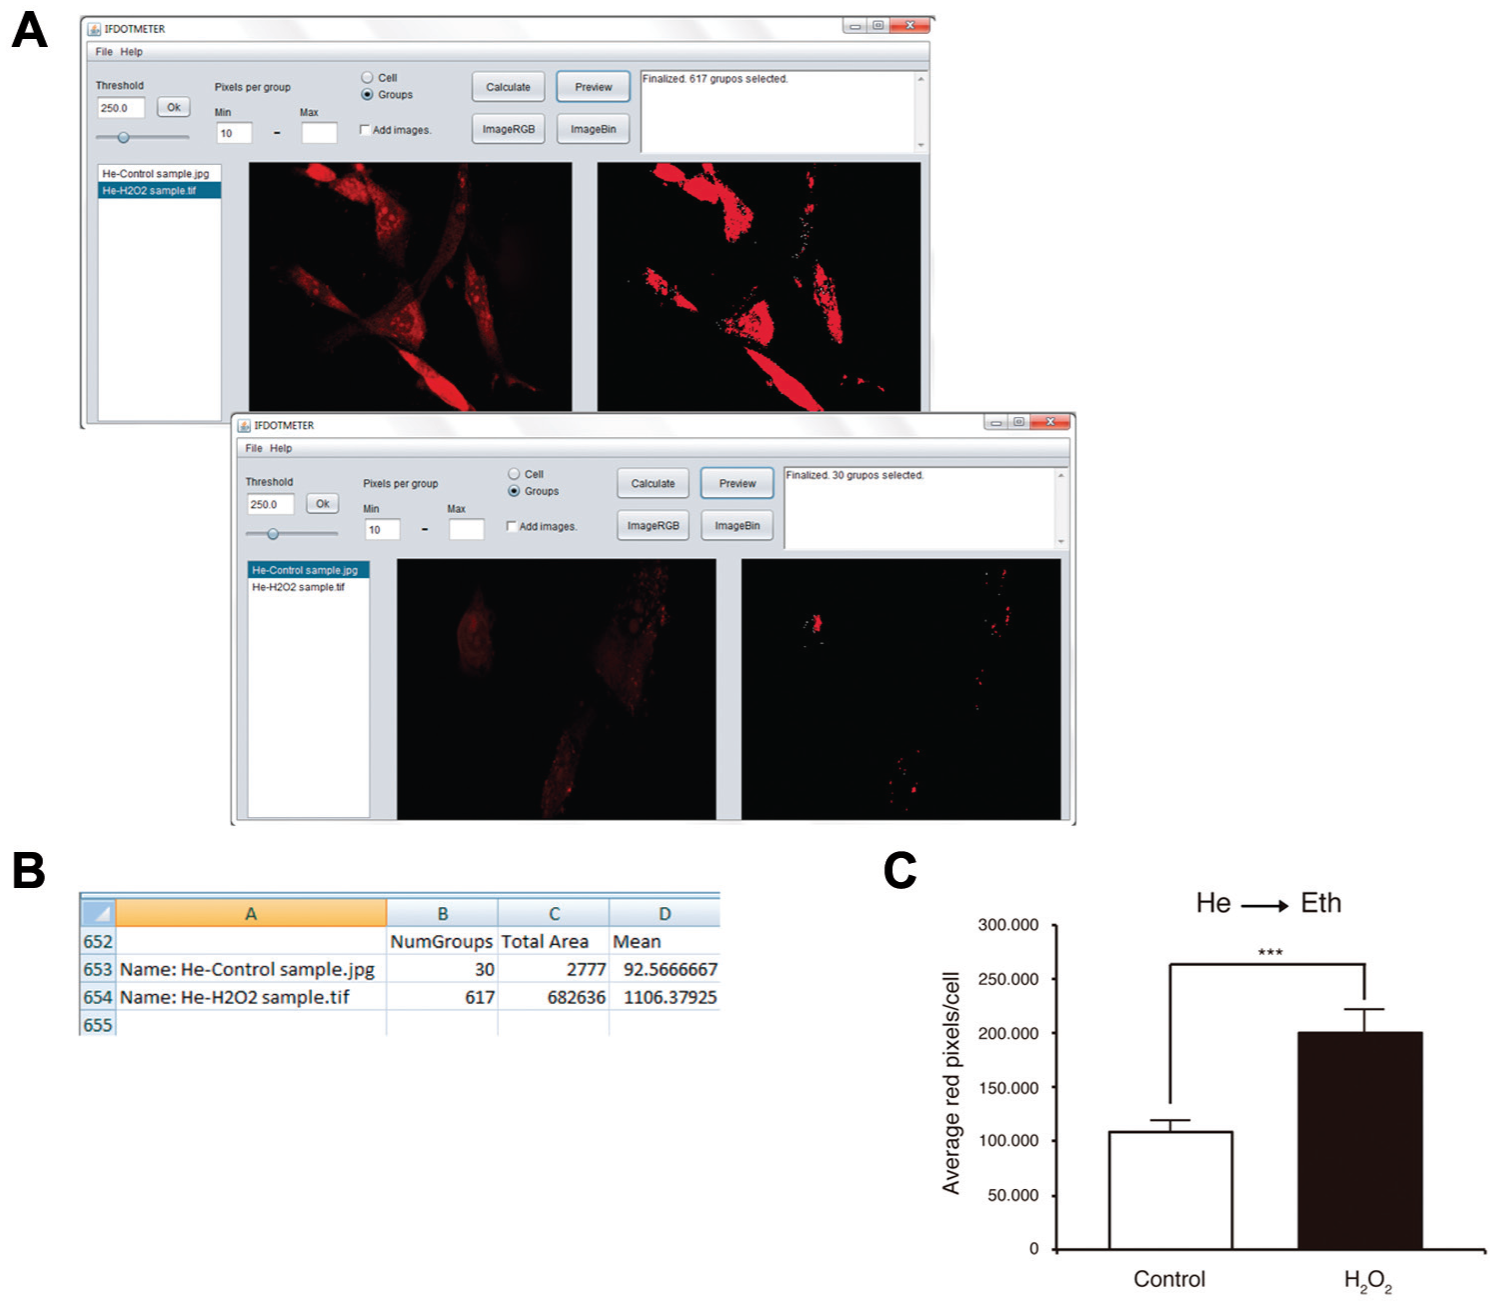
Measurement of He using IFDOTMETER. (
Caution: With this type of quantification, the user may have more than one cell per picture because the interesting result is the average of the intensity of the red stain per number of cells.
Scoring Reliability
All the data output obtained from IFDOTMETER software (measure cell area, autophagy marker, lysosomal size, nuclear condensation, mitochondrial morphology, autophagy flux, and ROS measurements) have provided similar values to those obtained by manual scoring (data not shown).
Discussion
Recently, methods to acquire microscopy images have steadily improved, resulting in massive amounts of data that have to be analyzed prior to making conclusions. In this sense, some reliable software that can handle such massive information is needed for the scientific community to avoid a bottleneck between image acquisition and results.
To date, there is commercial and open-source software capable of performing general or specific analysis tasks in an automated manner. The main disadvantages of commercial software are high cost and the unavailability of changing source code, thus making analysis too expensive or even unaffordable for scientists. In line with this issue, free open-source software provides both an affordable and available solution for analyzing and managing massive data.
Currently, the most widely accepted open-source program for image processing is ImageJ. It was developed in 1997 at the National Institutes of Health. 7 It is a powerful tool that can analyze multiple parameters in a single image, but its interface is mainly focused on single-picture analysis. Although multiple-image analysis is possible, it requires some programming skills that are not easy for members of the scientific community who are not familiar with programming.
Regarding this problem, there are other free open-source software programs that attempt to ease batch analysis by avoiding source code, thus providing a simpler interface for users. Such is the case for CellProfiler 8 and Icy. 21 The former is free open-source analysis software that allows users to design their own image processing and measurements by adding modules to a pipeline and choosing specific options in each module. Once a pipeline has been defined, this program allows users to execute it for a complete gallery of images. Icy is a tool developed by Institute Pasteur, which provides free software resources for visualizing, annotating, and quantifying bioimaging data. This program has specific plug-ins developed to perform specific measurements, and users may analyze an entire folder once settings have been established.
Although the possibilities for both programs are unquestionably unlimited, the impressive number of modules and options that have to be considered and adjusted prior to image quantification requires several days of training and tests to ensure that settings are following the pattern that you really want to use for proper analysis of images.
Being aware of this issue, we have developed a new tool that allows batch analysis of common biological hallmarks with a very simple and intuitive interface. The main advantage of IFDOTMETER is its simplicity in setting up experiments because it has just three options that need to be adjusted. All users have to do is load images or an entire folder, set the options and test them with the “Preview” function (discussed below), and select the “Calculate” button to generate a spreadsheet. In other programs for multiple image analysis, it is necessary to set many parameters prior to analysis, which may be a double-edged sword. On one hand, you can refine your measurement or discard information you do not need, but on the other hand, you have to spend several hours and receive specific training just to become comfortable with what you are actually measuring, and you may be overwhelmed by all of the features you can include or discard in your analysis.
Moreover, if you are not cautious when establishing conditions in such programs, the spreadsheet provided will contain an excess of information that may result in some additional work to select data that are actually useful. In this sense, IFDOTMETER generates a simple spreadsheet with specific measurements that can easily be used to perform further analysis. Cell Profiler generates multiple Excel files that may contain one discrete value to greater than 100 specific parameters for a single image, depending on the manner in which the experiment was designed; therefore, it is important to be aware of what you are looking for and discard information that is not needed. Icy software provides a single spreadsheet for each image analyzed without a summary table, which encumbers subsequent computational analyses.
In addition to its simplicity, IFDOTMETER includes a useful tool for checking measurements that the program is going to analyze prior to actual analysis. The “Preview” button automatically displays the area that satisfies your criteria colored in green, red, or yellow for a selected image in the “Image BIN window.” This option offers a great advantage because it provides a quick, visual, and easy way to test parameters in representative images before performing analyses. Cell profiler allows users to test whether their pipelines and modules run as well as desired, but the example provided corresponds to the first picture; therefore, it is more complicated to obtain a preview of your image analysis. Icy software marks in each image analyzed the region of interest considered after the analysis, so users are capable of reviewing what has been measured but are not capable of previewing analyses.
In summary, it takes approximately an hour to become familiar with the IFDOTMETER interface, and the “Preview” function allows for checking whether established settings will fit your search in a single click, thus providing users with an easy and intuitive way to understand how IFDOTMETER works and testing whether parameters are appropriate for the analysis prior to perform it.
To determine whether IFDOTMETER could obtain results as reliable as other software programs, we analyzed the experiments mentioned above with other software programs. Figure 6 shows the results of LC3 puncta quantification with no treatment or Baf A1 + EBSS treatment that has been analyzed with IFDOTMETER and Cell Profiler. Both programs found significant differences between treatments, and there was no significant difference in the results obtained by each program ( Fig. 6C ). The other biological hallmarks described in this article were analyzed with both programs, and the results obtained were similar to those shown in Figure 6 , because they did show differences between treated and untreated cells, whereas there were no differences between program scores (data not shown). Besides, we have developed a survey among four technicians familiarized with IF measurements regarding general user features of both programs, and they have found IFDOTMETER easier to operate and with a more intuitive display screen.
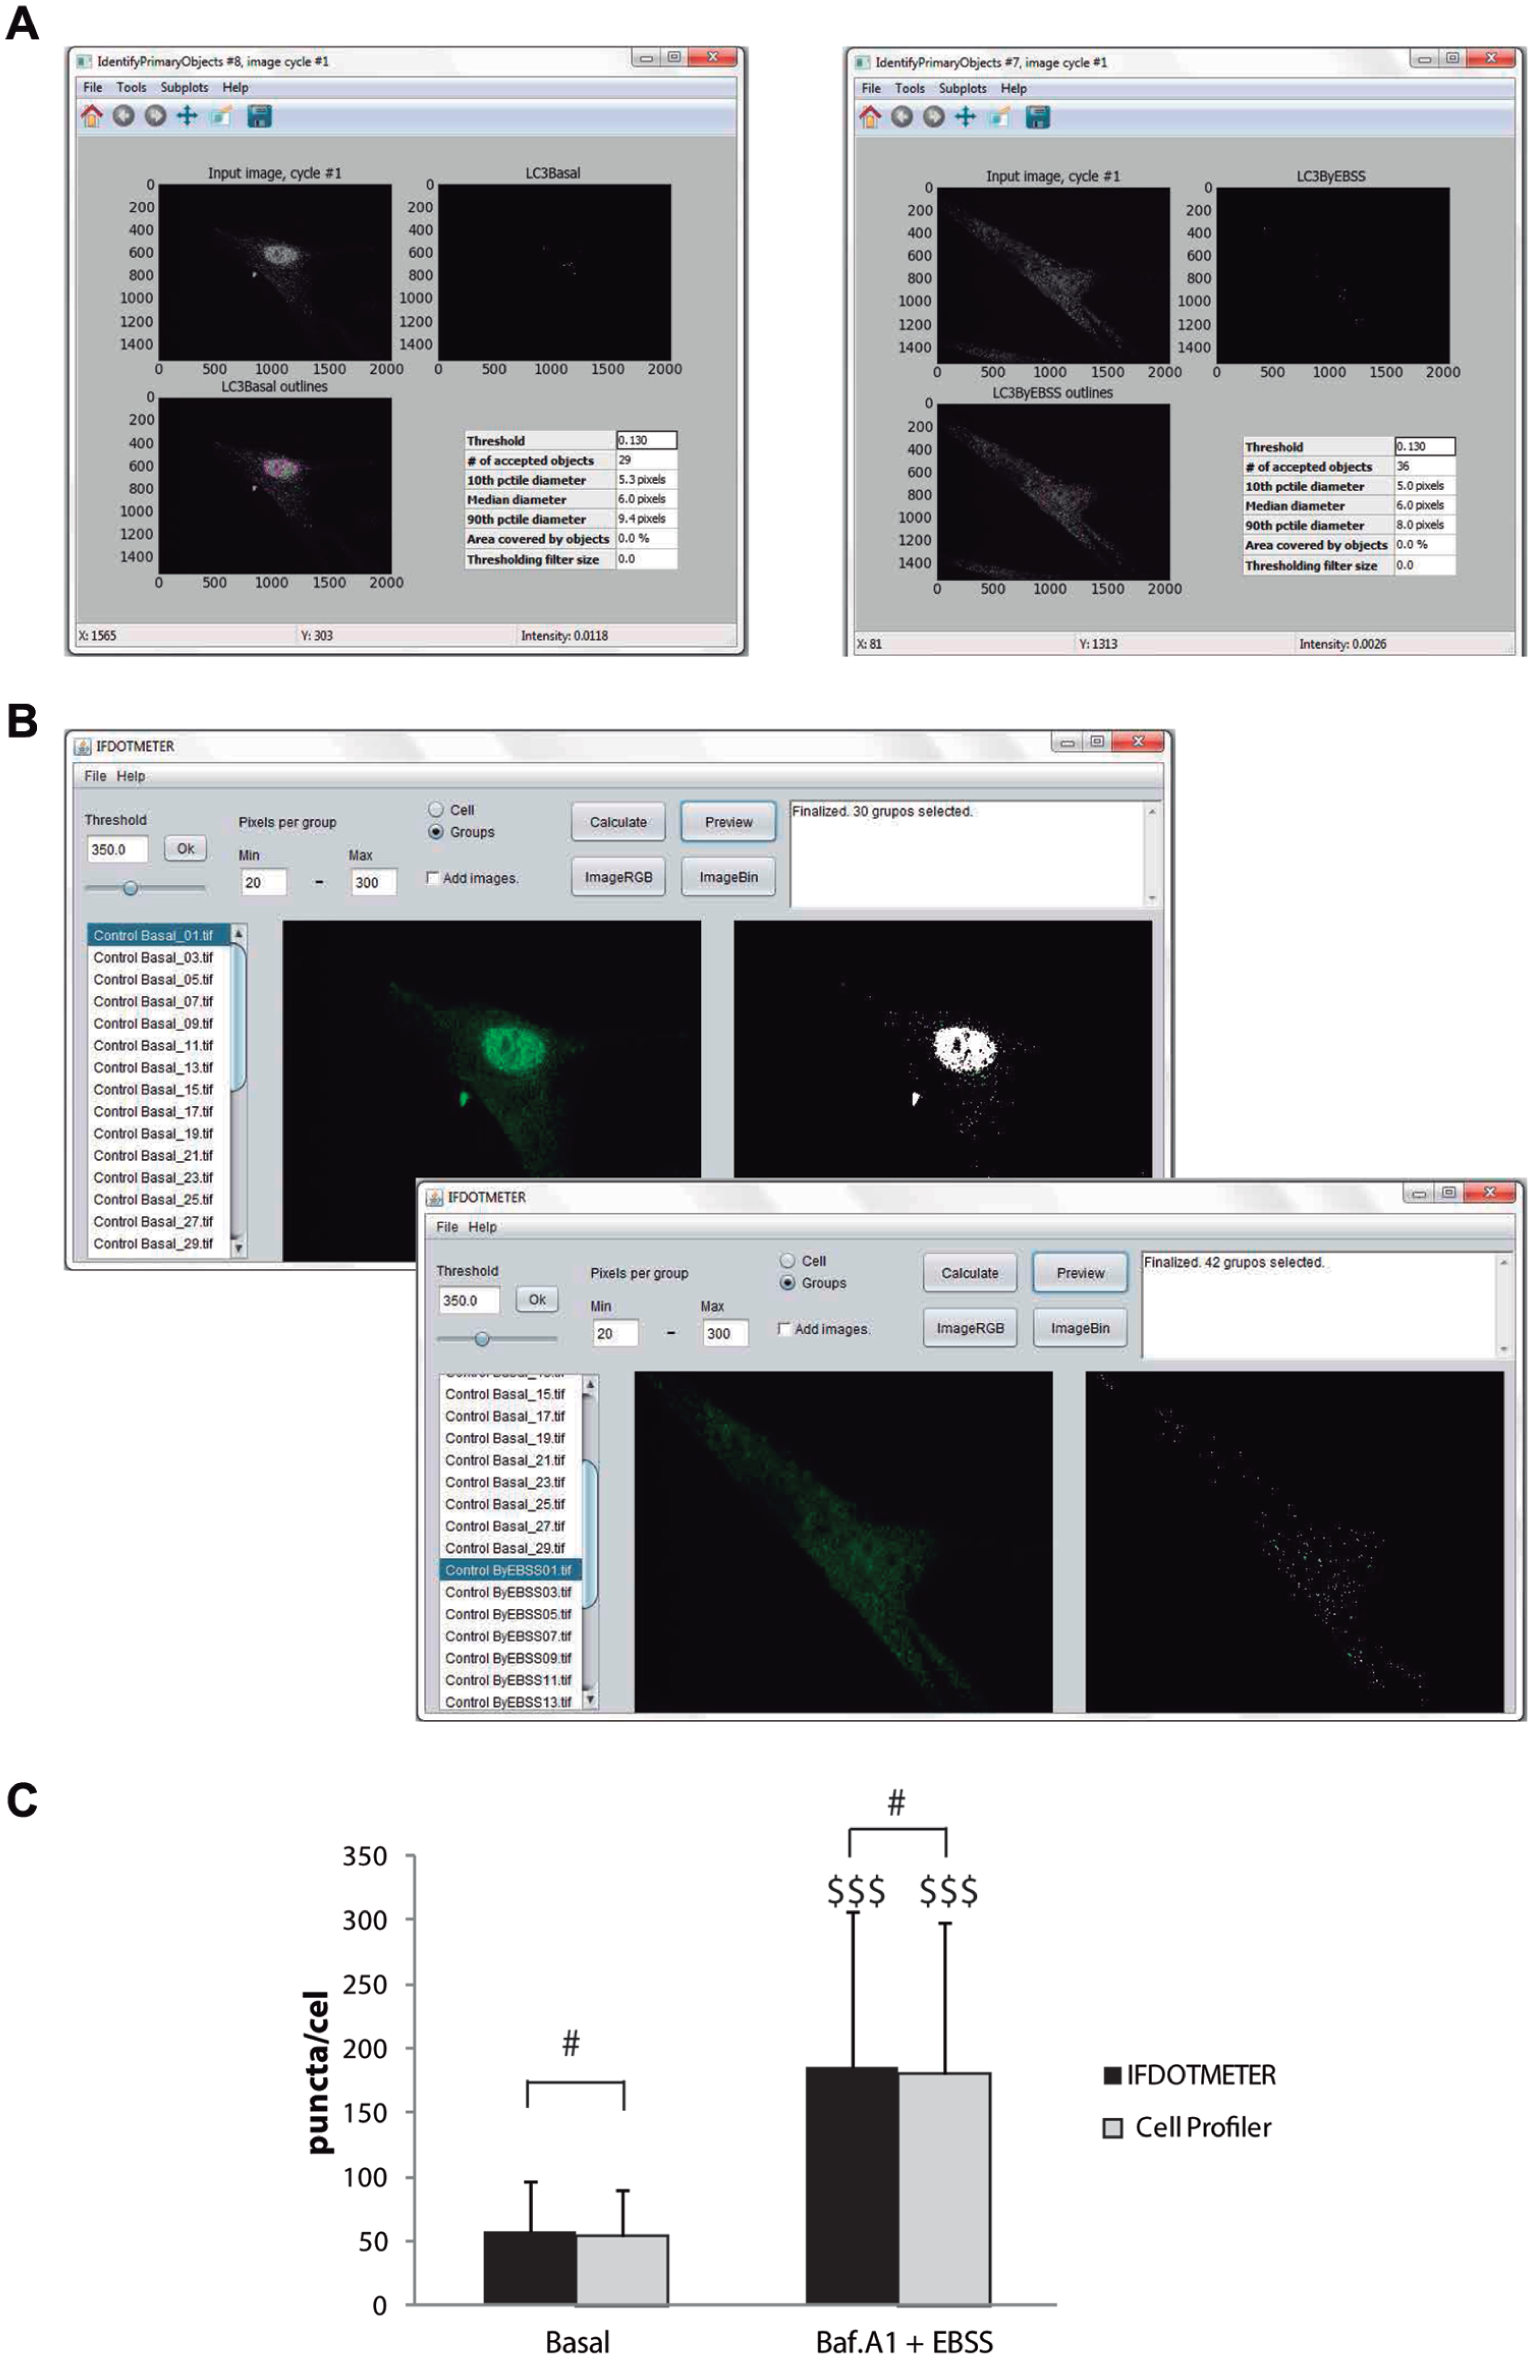
Measurement of LC3-puncta using IFDOTMETER or Cell Profiler. Human fibroblasts were treated in the absence (control) or presence of 100 nM Bafilomycin A1 (Baf A1) in Earle’s balanced salt solution medium (EBSS) for 6 h, fixed, and immunostained for LC3B. (
Despite the fact that our software does not pretend to cover all scientific community requirements similar to the other open-source programs mentioned above, it is easier to perform multiple and automatic image analysis to measure routine hallmarks than the programs provided by others without losing measurement quality. Because of this reason, our program becomes useful to researchers with little or no experience in programming and handling computer software or those who are overwhelmed because of information overload. In addition, because our program is open-source software, developers can modify or improve the source code or algorithms for their own experiments or purposes.
In this study, a new image analysis software application, IFDOTMETER, was introduced. This software provides an interface for measuring an important number of cellular characteristics in the study of autophagy, including autophagic markers, autophagic flux, quantity and size of lysosomes, nuclear condensation, and mitochondrial morphology. The main advantage of IFDOTMETER is the simplicity in its interface and its ability to process a large number of images in the absence of a researcher. This characteristic makes it possible to automate different processes, allowing researchers to perform other tasks while the program is working on quantifying results. The usability of the program has been tested in several cell models, including human fibroblasts, mouse embryonic fibroblasts, and neuronal cell lines such as SH-SY5Y. Given the growing interest in studying autophagy and the demand for image screening in the autophagy community, this software can become a powerful tool because it avoids tedious visual analysis of thousands of images, accelerating the rate of discovery.
IFDOTMETER can be requested free of charge from Dr. Jose M. Fuentes (
Footnotes
Acknowledgements
We thank A. López de Munain (Instituto Biodonostia, Servicio de Neurología, Hospital Donostia, San Sebastián, Spain) for kindly providing HFs and Dr. Terje Johansen for the pDest-mCherry-EFGP-LC3B vector. We would like to thank P. Delgado and G. Martínez for invaluable technical assistance. The authors would also like to thank FUNDESALUD.
Abbreviations
Baf A1, bafilomycin A1; CCCP, carbonyl cyanide m-chlorophenylhydrazone; He, dihidroethydium; HF, human fibroblast; Ho, Hoechst 33342; IF, immunofluorescence; MEF, mouse embryonic fibroblast; MPP+, 1-methyl-4-phenylpyridinium; ROS, reactive oxygen species.
Declaration of Conflicting Interests
The authors declared no potential conflicts of interest with respect to the research, authorship, and/or publication of this article.
Funding
The authors disclosed receipt of the following financial support for the research, authorship, and/or publication of this article: This work was supported by Instituto de Salud Carlos III (PI12/02280, PI14/00170 [co-financed by European Union FEDER funds], CB06/05/0041). R.G.-S. was supported by a postdoctoral contract from Ramon Areces Foundation, M.R.-A. was supported by an FPU predoctoral fellowship (Ministerio de Educación, Cultura y Deporte, Spain), R.A.G.-P. was supported by a talent research contract (Gobierno de Extremadura, Spain).