
Abstract

INTRODUCTION
Functional Genomics and the mapping program of the human genome (HUGO) will revolutionize the future of Life Sciences. One of the key issues will be to link gene sequences to protein expression. Proteomics is fueling the fast development of functional protein analysis and aims at analyzing biologically relevant biopolymers at defined states. 1 High capacity throughput technologies that are able to identify the expression of proteins are currently a research area with enormous attention. This is due to the fact that the DNA-coding and “the Holy Grail” of human life is no further away than the nearest computer with an internet connection. Almost the entire genome can be searched. However, these gene sequences hold only a limited percentage of the entire proteome that is present in cells. The reason is that upon transcription and translation, proteins in many cases undergo a post translational modifying step. This is often associated with an enzymatic transformation whereby the protein is modified. These modifications, e.g., phosphorylation, methylation, and glycosylation, are often linked to biological activity. It is assumed that close to one million structurally different proteins are present in human cells.
Currently there is no single technology that is able to map even close to the majority of all these proteins. Two-dimensional gel-electrophoresis in combination with mass spectrometry (MS) is the method of choice to study the expression of proteins. The combination of these techniques has been the propelling force of proteomics that allows the separation of several thousands of proteins and identification of their corresponding peptide maps by high-resolution MS. The need for ever decreasing sample volumes and concentrations has been the driving force in the emerging field of microfluidics and chemical microsystems. Miniaturized separation techniques such as microcolumn liquid chromatography and capillary electrophoresis has entered into the field of Proteomics 2,3 offering high separation efficiency with subsequent peptide mass fingerprint identities. In this paper we describe a chip technology based workstation interfacing capillary liquid chromatography to MALDI-TOF mass spectrometry which can be operated in an unattended and fully automated mode.
THE PROTEIN WORKSTATION
We have recently developed and manufactured silicon microstructures (a porous silicon protease micro enzyme reactor, a flow-through microdispenser and high-density nanovial arrays) composing a micro protein analysis platform that allows small sample volumes to be handled and determined at low levels by means of MALDI-TOF MS. 4 In the work described herein we are using the flow-through microdispenser to “nano-fractionate” pep-tide separations directly onto matrix/nitrocellulose precoated MALDI target plates. The micromachined piezoelectric flow-through dispenser has an internal volume of 250 nL between the inlet and droplet ejecting nozzle. The dispenser allowed sample droplet sizes of 50–150 picoliters to be dispensed onto the MALDI target plates at rates up to several Kilo-Hertz. Typical deposition rates in this work were 15–60 Hz. The fundamental description of the microdispenser has been described extensively elsewhere. 5 More recent dispenser versions have been presented. 2 Briefly, the multilayer piezoceramic element elongates when polarized by a short voltage pulse and generates a pressure pulse in the flow channel via a flexible silicon membrane, resulting in a droplet ejection through the protruding conical nozzle. Typical droplet speeds are 1 m/s. In Figure 1, a stroboscopic droplet formation sequence is shown, demonstrating the sample handling precision using piezodispensing.

Integrated Protein platform comprising; the autosampler, the capillary-HPLC microseparation system coupled on-line to the flow-through piezoelectric microdispenser, and the precoated MALDI-TOF target plate.
By linking the LC-capillary column directly to the flow-through dispenser an integrated on-line interface for high throughput MALDI-TOF MS was obtained.
The integrated protein platform is shown in Figure 1. It comprises of: 1) micro autosampler, 2) the HPLC microseparation system, coupled on-line to 3) the flow-through piezoelectric microdispenser, and 4) the MALDI target plate which was pre-coated with matrix/nitrocellulose. The entire system, Figure 1, is software controlled by in-house developed LabView™ routines. The flow-through microdispenser is operated in a split flow mode where the chromatographic separation is piezo dispensed onto the precoated target plate and crystallises there, as discrete sample spots, while at the same time part of the sample proceeds through the microdispenser into small sample tubes in the microfraction collector. In order to keep these analyte fractions stable, they are kept at 4 °C. In the second mode (static mode), specific sequences of the protein can later be studied in detail by manually introducing the sample into the dispenser again using a 1 μL syringe. 3 Minimizing the sample spot size by using a deposition rate below 30 Hz, the sample does not bleed out on a large spot area, enabling the detection of peptides at concentrations of a few hundred picomolar. 6 These sensitivities are currently not possible to achieve when the system is operated in the on-line mode (mode 1).
HIGH RESOLUTION PEPTIDE MAPPING
In order to reach high resolution power in peptide analysis a 180 μm i.d. chromatographic column was used. Hydrophobic interactions were used as the separation mechanism and operated with acetonitrile/TFA gradients as the mobile phase. Initial mobile phase conditions were 5:95 and endpoint elution composition set at 50:50 with a cycle time of 50 minutes. A linear gradient was used in these experiments. As an example, a tryptic digest separation of goat albumin is illustrated in Figure 2. Separation efficiencies of > 100 peaks are obtained with these 180 micron i.d., capillaries packed with 3 μm particle diameter supports. Mass spectrometric data showed that the number of peptides within some of the single chromatographic peaks could contain several unresolved peptides. In order to reach high sequence coverage of these protein samples, the combined resolving efficiency of both the chromatographic separation as well as the mass spectrometric resolution has to be kept at an optimum.
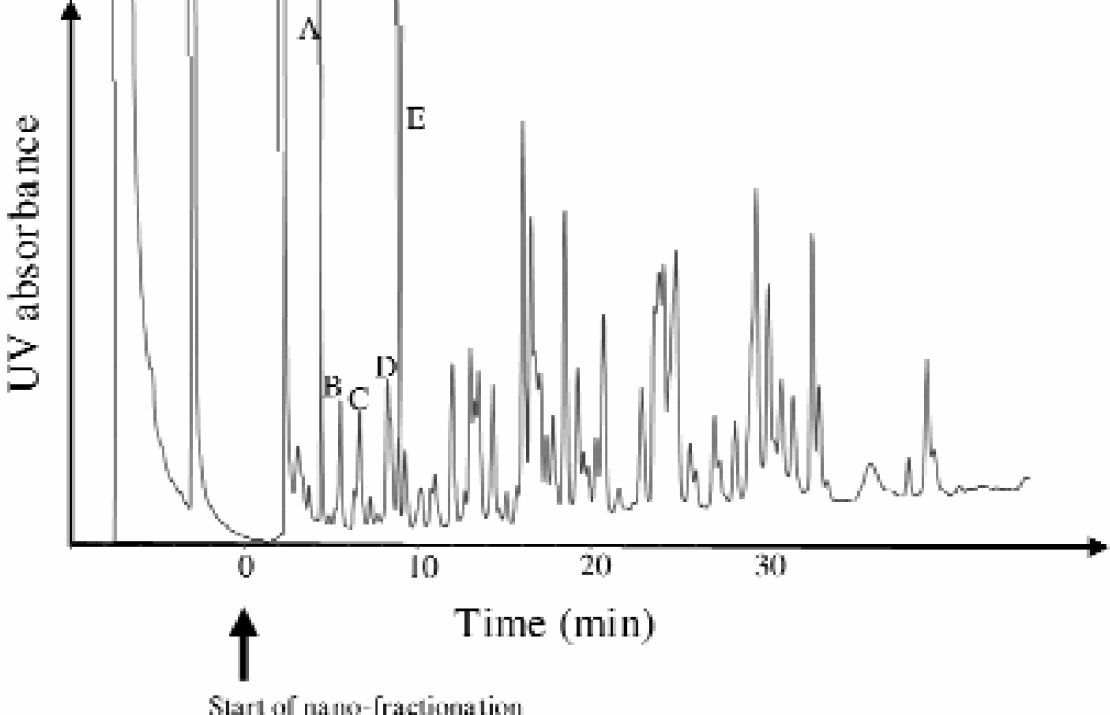
Chromatographic separation of Goat Albumin, using a 180 μm i. d. PepMap C-18 octadecyl silane stationary phase (LC-Packings, Amsterdam, The Netherlands). Operation conditions; injection volume: 5 μL, flow rate: 2 μL/min, mobile phase: acetonitrile/TFA, gradient run starting at 5:95 and ending at 50:50 in 45 minutes using a linear gradient.
These microcolumn separations have been found to be highly reproducible. 3 It is also possible to run these peptide maps faster using short 75 μm i.d., capillary columns with separation times of about 8 minutes. 6 Steeper mobile phase gradients are applied to decrease the cycle time. The separation time will also be dependent on the linear flow rate used. The further decrease in capillary size will result in higher sensitivity, thereby extending the sequence coverage as well as resulting in a higher sample throughput.
HIGH SPEED PEPTIDE MAP FINGERPRINTING
Laser desorption ionization mass spectrometry needs an aromatic low molecular weight matrix that assists the digested protein in the ionization process upon laser irradiation. These matrices are mixed with nitrocellulose and added into the microchip vials as a thin layer using an air-brush technique developed in our group. 2,3 After the sample fractions have been spotted on the MALDI target surface, they are introduced into the MALDI instrument. The MALDI-TOF MS instrument used was a Voyager DE-PRO (Perseptive Biosystems, Framingham, MA, USA) with built-in delayed extraction. The dispensed peptides will mix with the pre-coated matrix/nitrocellulose and upon drying of the sample droplet, homogeneous crystals of matrix and peptide molecules will be formed. The high positioning accuracy of the x-y stage and the automated sample depositions made it possible to prepare high density arrays easily holding 2000–3000 spots per MALDI target plate (45 × 45 mm). The sample spot coordinates were predetermined and the spot diameter constant (typically 200–400 μm). A small spot diameter of 400 μm or less is beneficial for obtaining a more homogeneous sample crystal surface which in turn reduces the needs for hot-spot searching. These features simplified automation of the system and thus enabled high-throughput MALDI-MS sample preparation and analysis.
Irradiation with laser pulses of sample spots containing the matrix/analyte crystals will yield an MS-detector signal that reveals the mass(es) of singly charged peptide ion(s). Some mass spectra obtained of the digested protein (goat albumin) are illustrated in figure 3. The mass assignment of peptides was identified by using an internal standard; this calibrating technique has been described elsewhere. 3
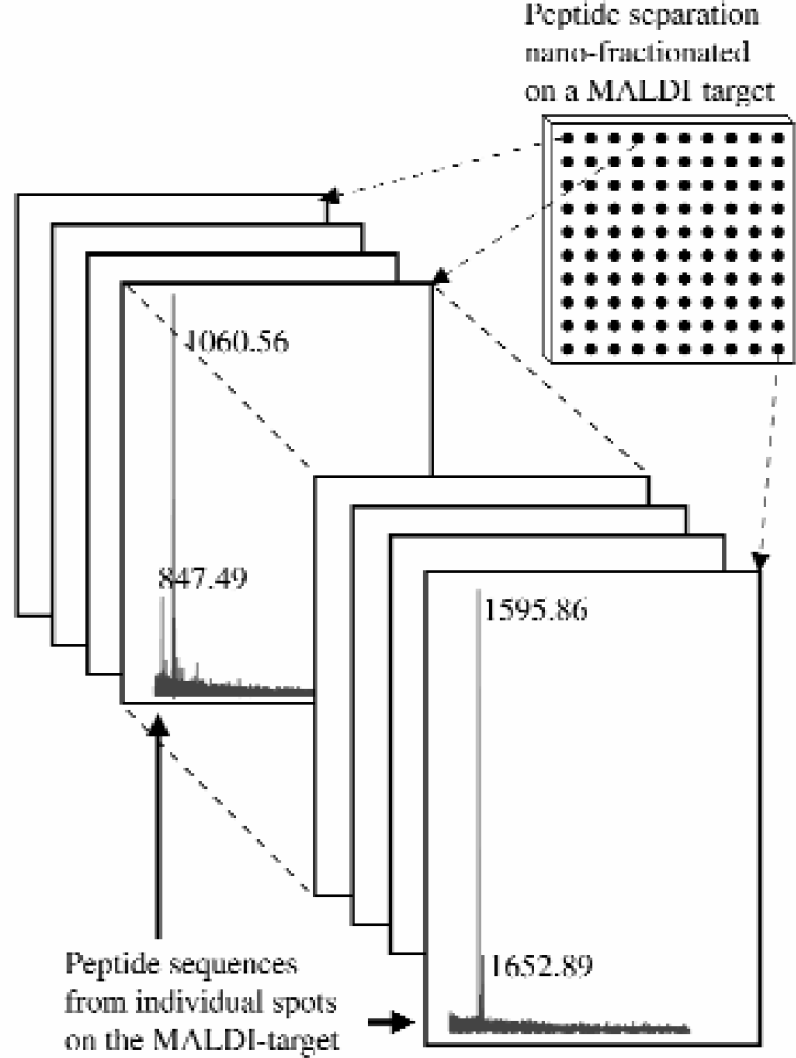
Resulting MALDI-TOF mass spectra obtained after running the fully integrated protein work station described in figure 1.
The corresponding peptide(s) from each sample spot will elucidate parts of the primary structure of the protein. By selecting the monoisotopic peaks of each individual peptide, a peak table was formed from each protein sample. Thereafter, all of the measured peptide masses by delayed-extraction MALDI mass spectrometry were subjected to database searching allowing a mass error of 50 ppm, and the protein was successfully identified.
An important advantage of nano-fractionating the peptide map separation on the MALDI target prior to the TOF MS rather than analyzing a crude protein digest directly is that ion suppression effects are decreased. When the UV-laser ionizes the sample spot some of the peptides suppress the ionization of others, resulting in an incomplete peptide map mass spectra. The nano-fractionation prior to MALDI MS improves these conditions since all the peptides are distributed over the whole high density MALDI target array and thus a lower number of peptides can cause ion suppression in each array spot. An example of the increase in sequence coverage that can be obtained is given in Figure 4 where the sequence coverage of a tryptic digest from goat serum albumin is increased from 34 % to 57%.
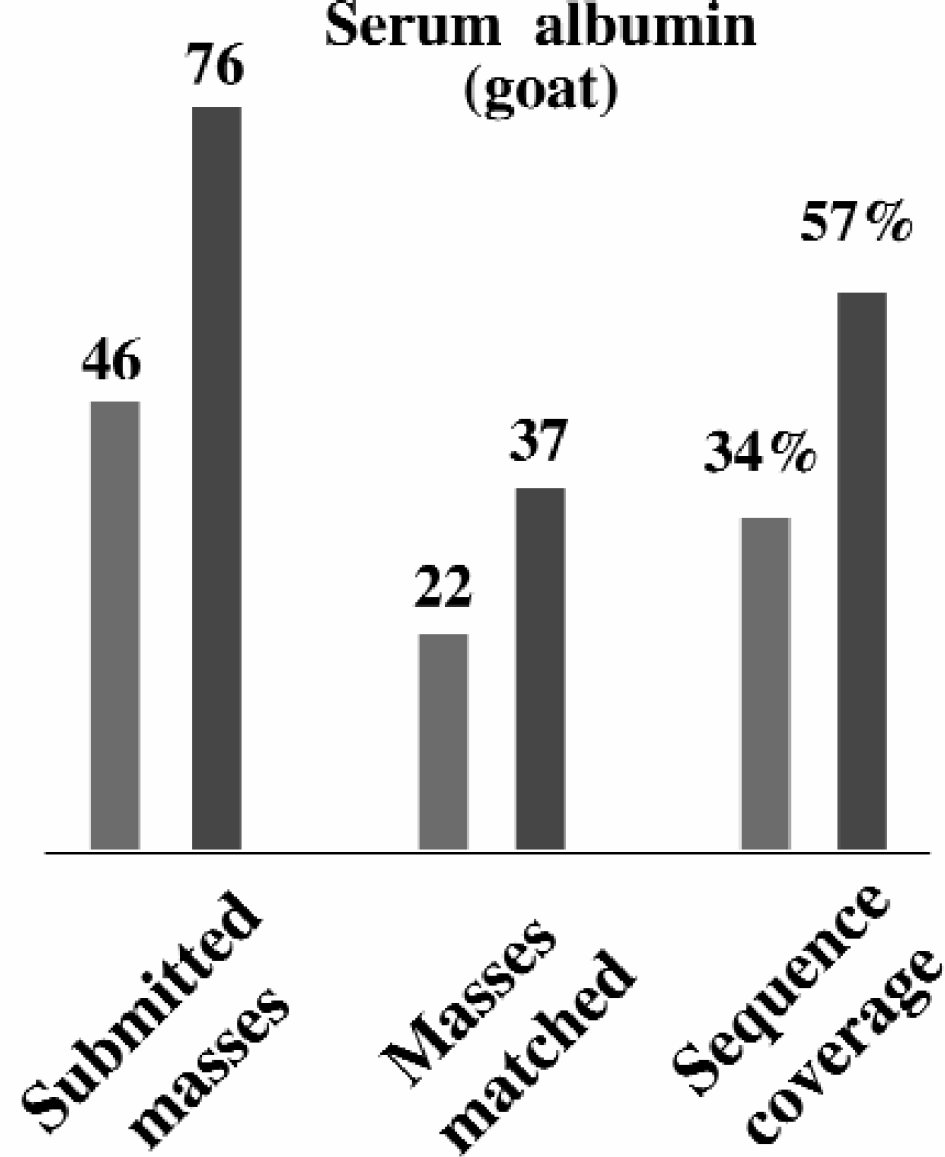
Sequence coverage data obtained from mass spectra on either a crude peptide mix after a tryptic digest or by adding the different mass spectra collected from each of the spots on the nanofractionated MALDI target plate.
CONCLUSIONS
The described micro technology platform is a simple way of interfacing microseparations to MALDI-TOF MS. The system can be automated to a high degree and an increased throughput in protein analysis may thus be obtained. Further optimizations of the microsystem will reduce total internal volumes and thus bring up sample throughput as well as lowering detection levels.