
Abstract
Powerful new experimental methods have been used to monitor changes in gene expression levels as a result of a variety of metabolic, xenobiotic or pathogenic challenges. Here we present a general approach to both statistical analysis and dynamic modeling of gene expression profiles that uses linear response theory. The formalism leads naturally to Markov models of the network reflected in the data, and provides a direct method of classifying genes according to their place in the resulting network. Non-linear and higher order Markov behavior of the network can also be included by a self-consistent method. In a sample data set from yeast, we calculate the Markov matrix and the gene classes based on the linear Markov network.
INTRODUCTION
The analytical problem of finding patterns in time series of expression array data has been attacked recently using the tools of cross-correlation functions and cluster analysis techniques.1,2 These approaches are fundamentally statistical and do not generate models of the underlying genetic network, nor do they naturally extend to a comparison of the data with hypothetical models. In this paper, we describe an approach based on linear response theory and a classical technique from linear algebra called Single Value Decomposition (SVD). Previous workers have also recognized the potential value of SVD in the analysis of expression data.3–6 Their results are promising, and point to the general utility of SVD as a tool to reduce dimensionality and avoid near-singular instabilities that can introduce artifacts into the results. In this work, we use SVD as a tool to analyze linear response models of gene expression, providing a natural means of comparison between data and models. The utility of such linear response models has been noted previously, 7–9 yet they have not been extensively explored.
Dynamic Models of Array Time Series:
The simplest assumption about expression profile data is that the expression state represented in the data from one time point determines the expression state seen at the next time point. This assumption is equivalent to modeling the data by a first-order, Markov process. The linear version of this model is described by a single transition matrix, A, defining the transitions from one state to the next. The expression levels of each of m genes in the two states can be described by column vector,
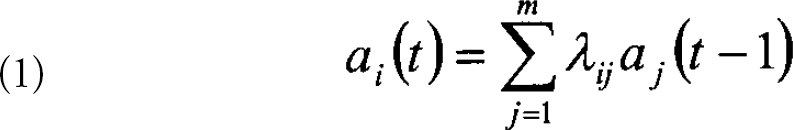
where ai(t) is the expression level of the ith gene at time t and λ is the respective element of the mxm transition matrix. In matrix form, Eq. 1 can be written as: a(t)=λa(t — 1). For a set of data from n different time points, one can form the matrices A(t)=[a(2),a(3),….a(m)] and A(t-1)=[a(1),a(2),….a(m −1)]. Eq. 1 becomes:

Any mxn matrix, A, can be viewed as a transformation from an n dimensional vector space to an m dimensional space. This transformation can be decomposed using a singular value decomposition (SVD): where U is a unitary mxm matrix of (left) eigenvectors, Eis a diagonal

nxn matrix containing the n eigenvalues for the transformation and VT is the transpose of a unitary of (right) eigenvectors.
The SVD technique provides a means to invert a matrix that is singular and that is not square. The transition matrix, λ, can be calculated using Eq. 2 and 3 and gives an easily calculable, least squares solution. 10

Another advantage of SVD is that it can be used to reduce the noise in the system, much in the spirit of PCA. This is achieved by “throwing out of eigenvalues,” in the inversion of the eigenvector matrix. We refer to this as eigenvalue truncation.
The noise reduction effect of eigenvalue truncation can be seen when calculating the transition matrix using Eq. 6. Figure 1 shows the transition elements influencing the induction of pyruvate carboxylase, a pivotal enzyme in the metabolic shift in yeast (from the Stanford data for the diauxic shift experiment). The figure shows the transition elements to pyruvate carboxylase from all 6153 genes without (bottom) and with (top) eigen-value truncation (4 eigen-values retained). As can be seen, the dominant elements change very little in the two cases. However, there is a large reduction of apparent noise in the signal. This noise-reduction feature shows the advantage of using SVD methods.
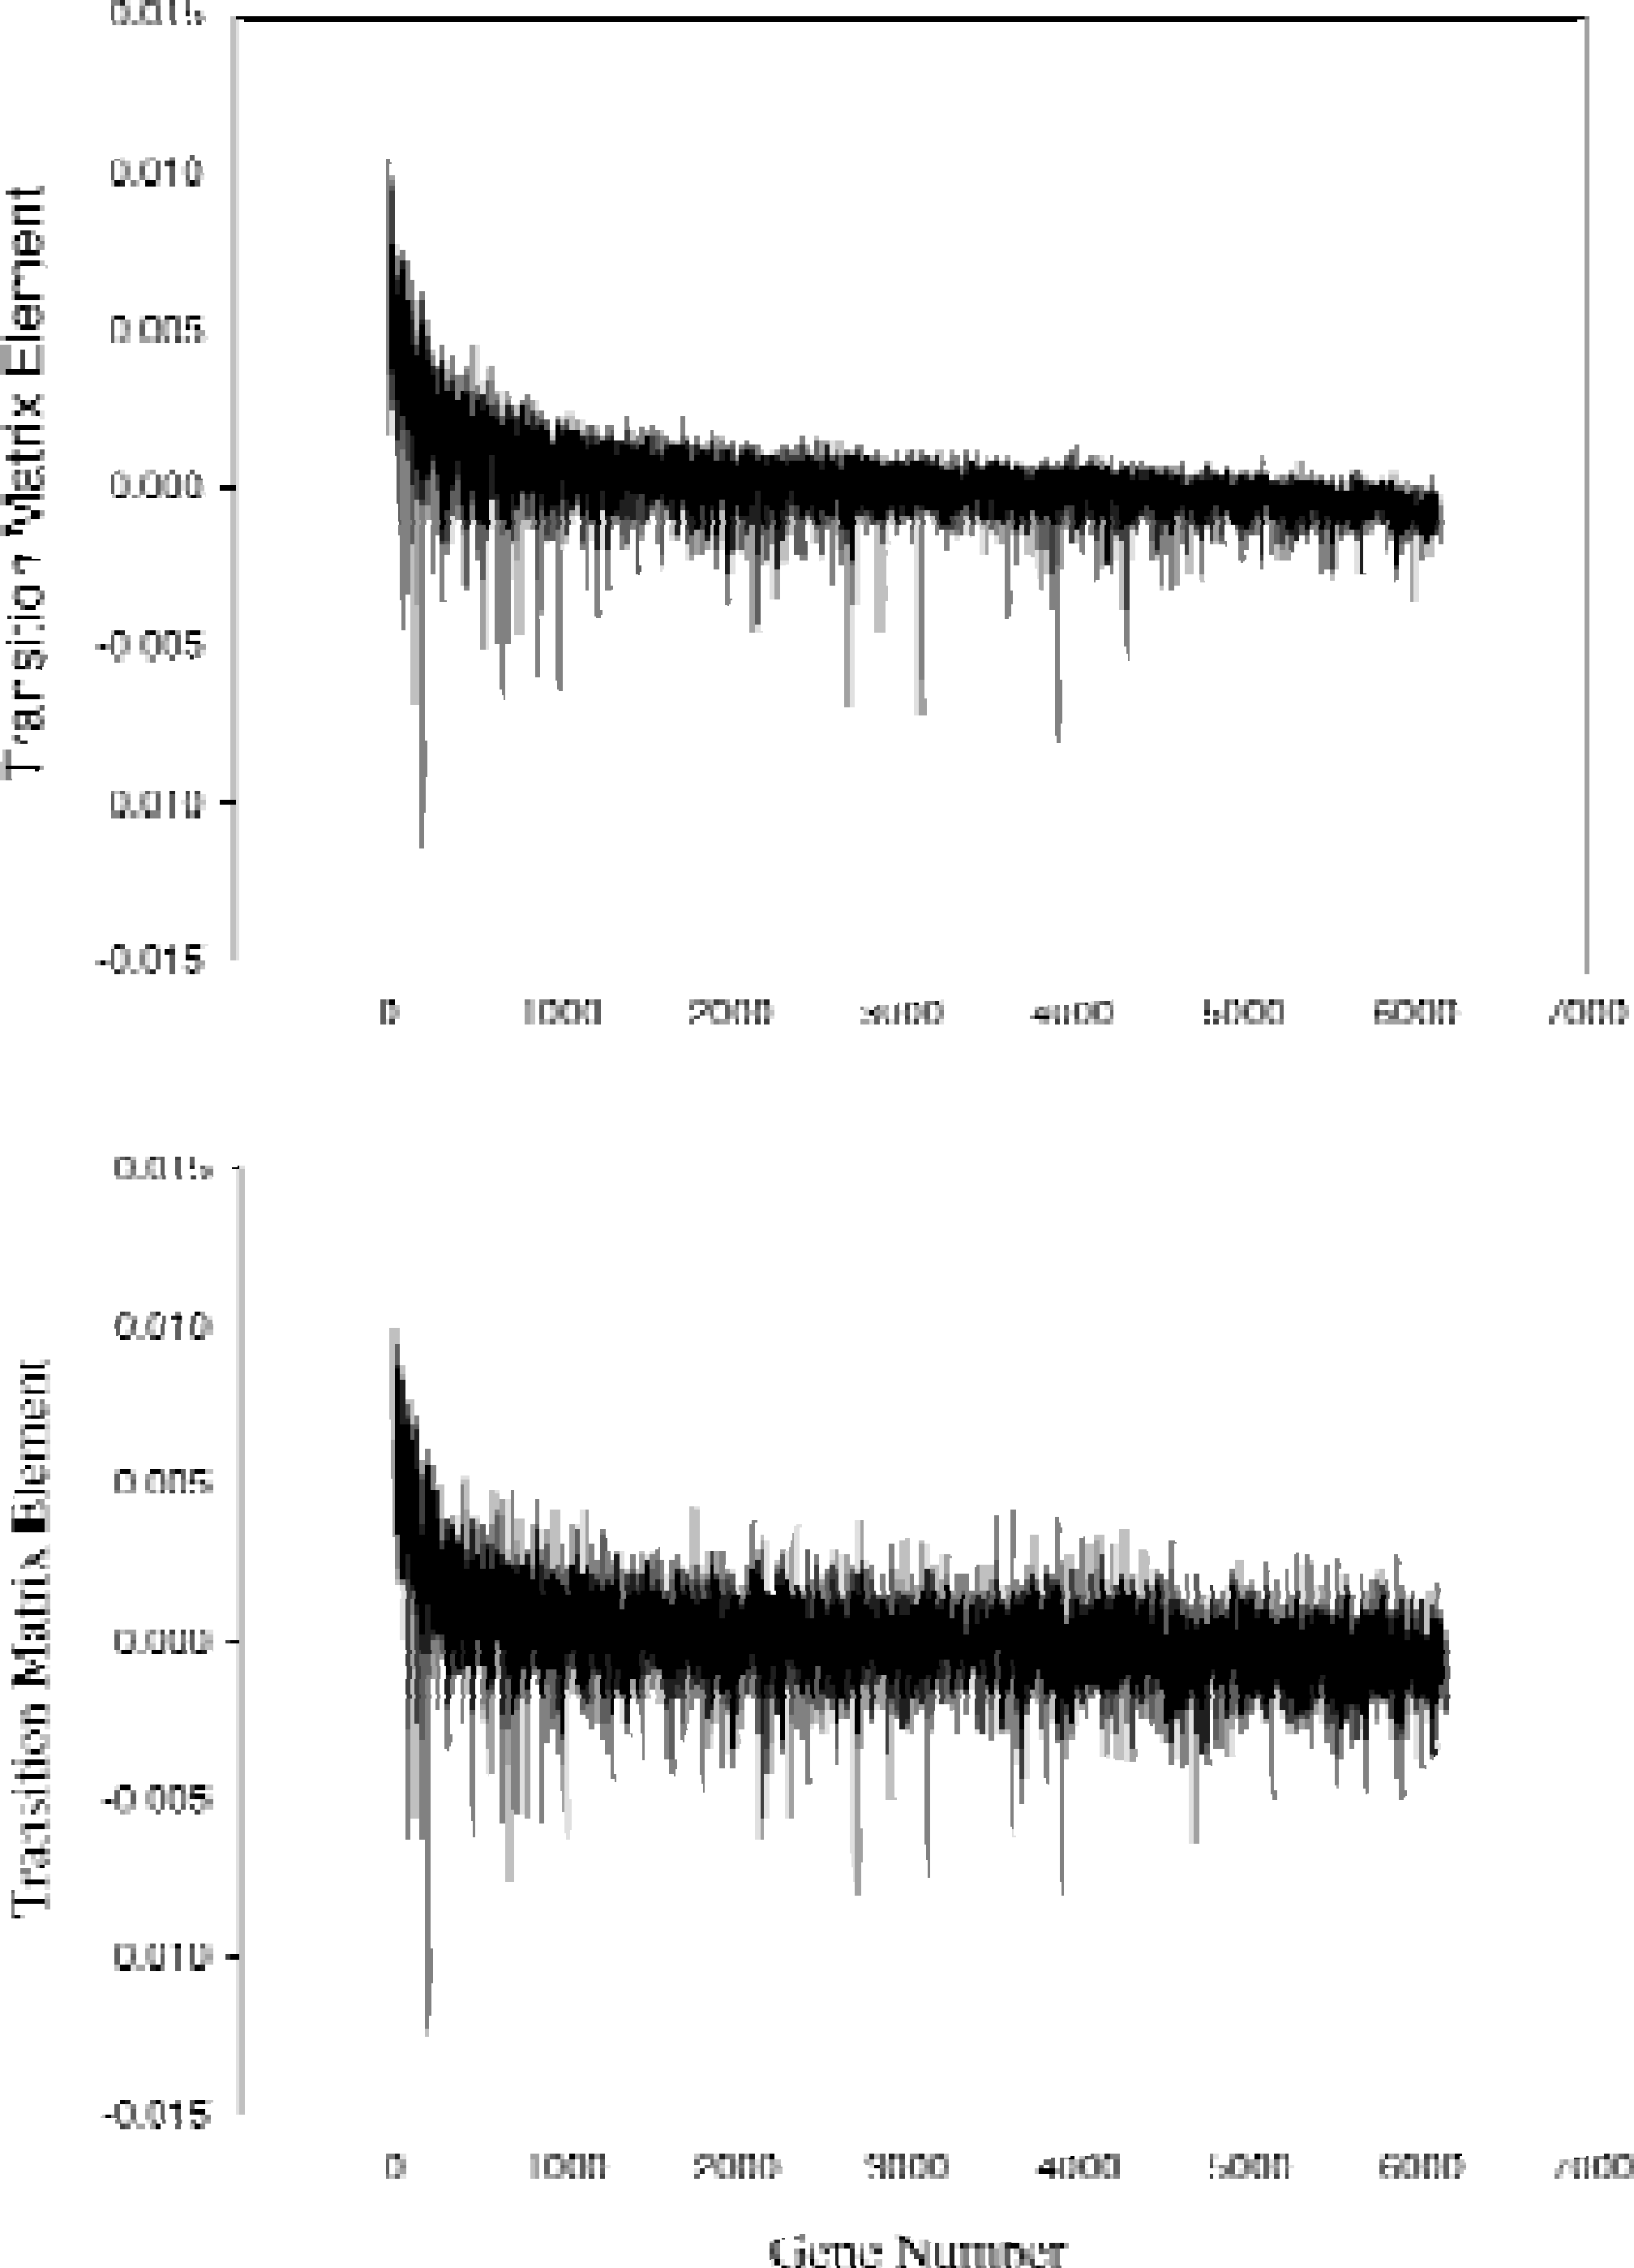
Effects of eigenvalue truncation on the transition matrix elements for pyruvate carboxylase. The first order Markov transition elements are plotted for all 6153 genes showing their effect on the production of pyruvate carboxylase. To p figure shows results when matrix is calculated with 4 eigenvalues. Bottom figure shows the results when all eigenvalues are retained. Eigenvalue truncation removes noise in the data while retaining the magnitude of large transition elements.
We can extend our model to include non-linear effects in a general way. This is done with the following model:

where the λ i are determined in an iterative, self-consistent fashion. While this model may not capture the full specific functional form of the expression dynamics, its appeal is that it builds-in non-linearities related to both the intra-gene correlations (AAT) and the time correlations (ATA). It is anticipated that the behavior of the various transition matrices will lead in an intuitive fashion to more specific models of expression dynamics.
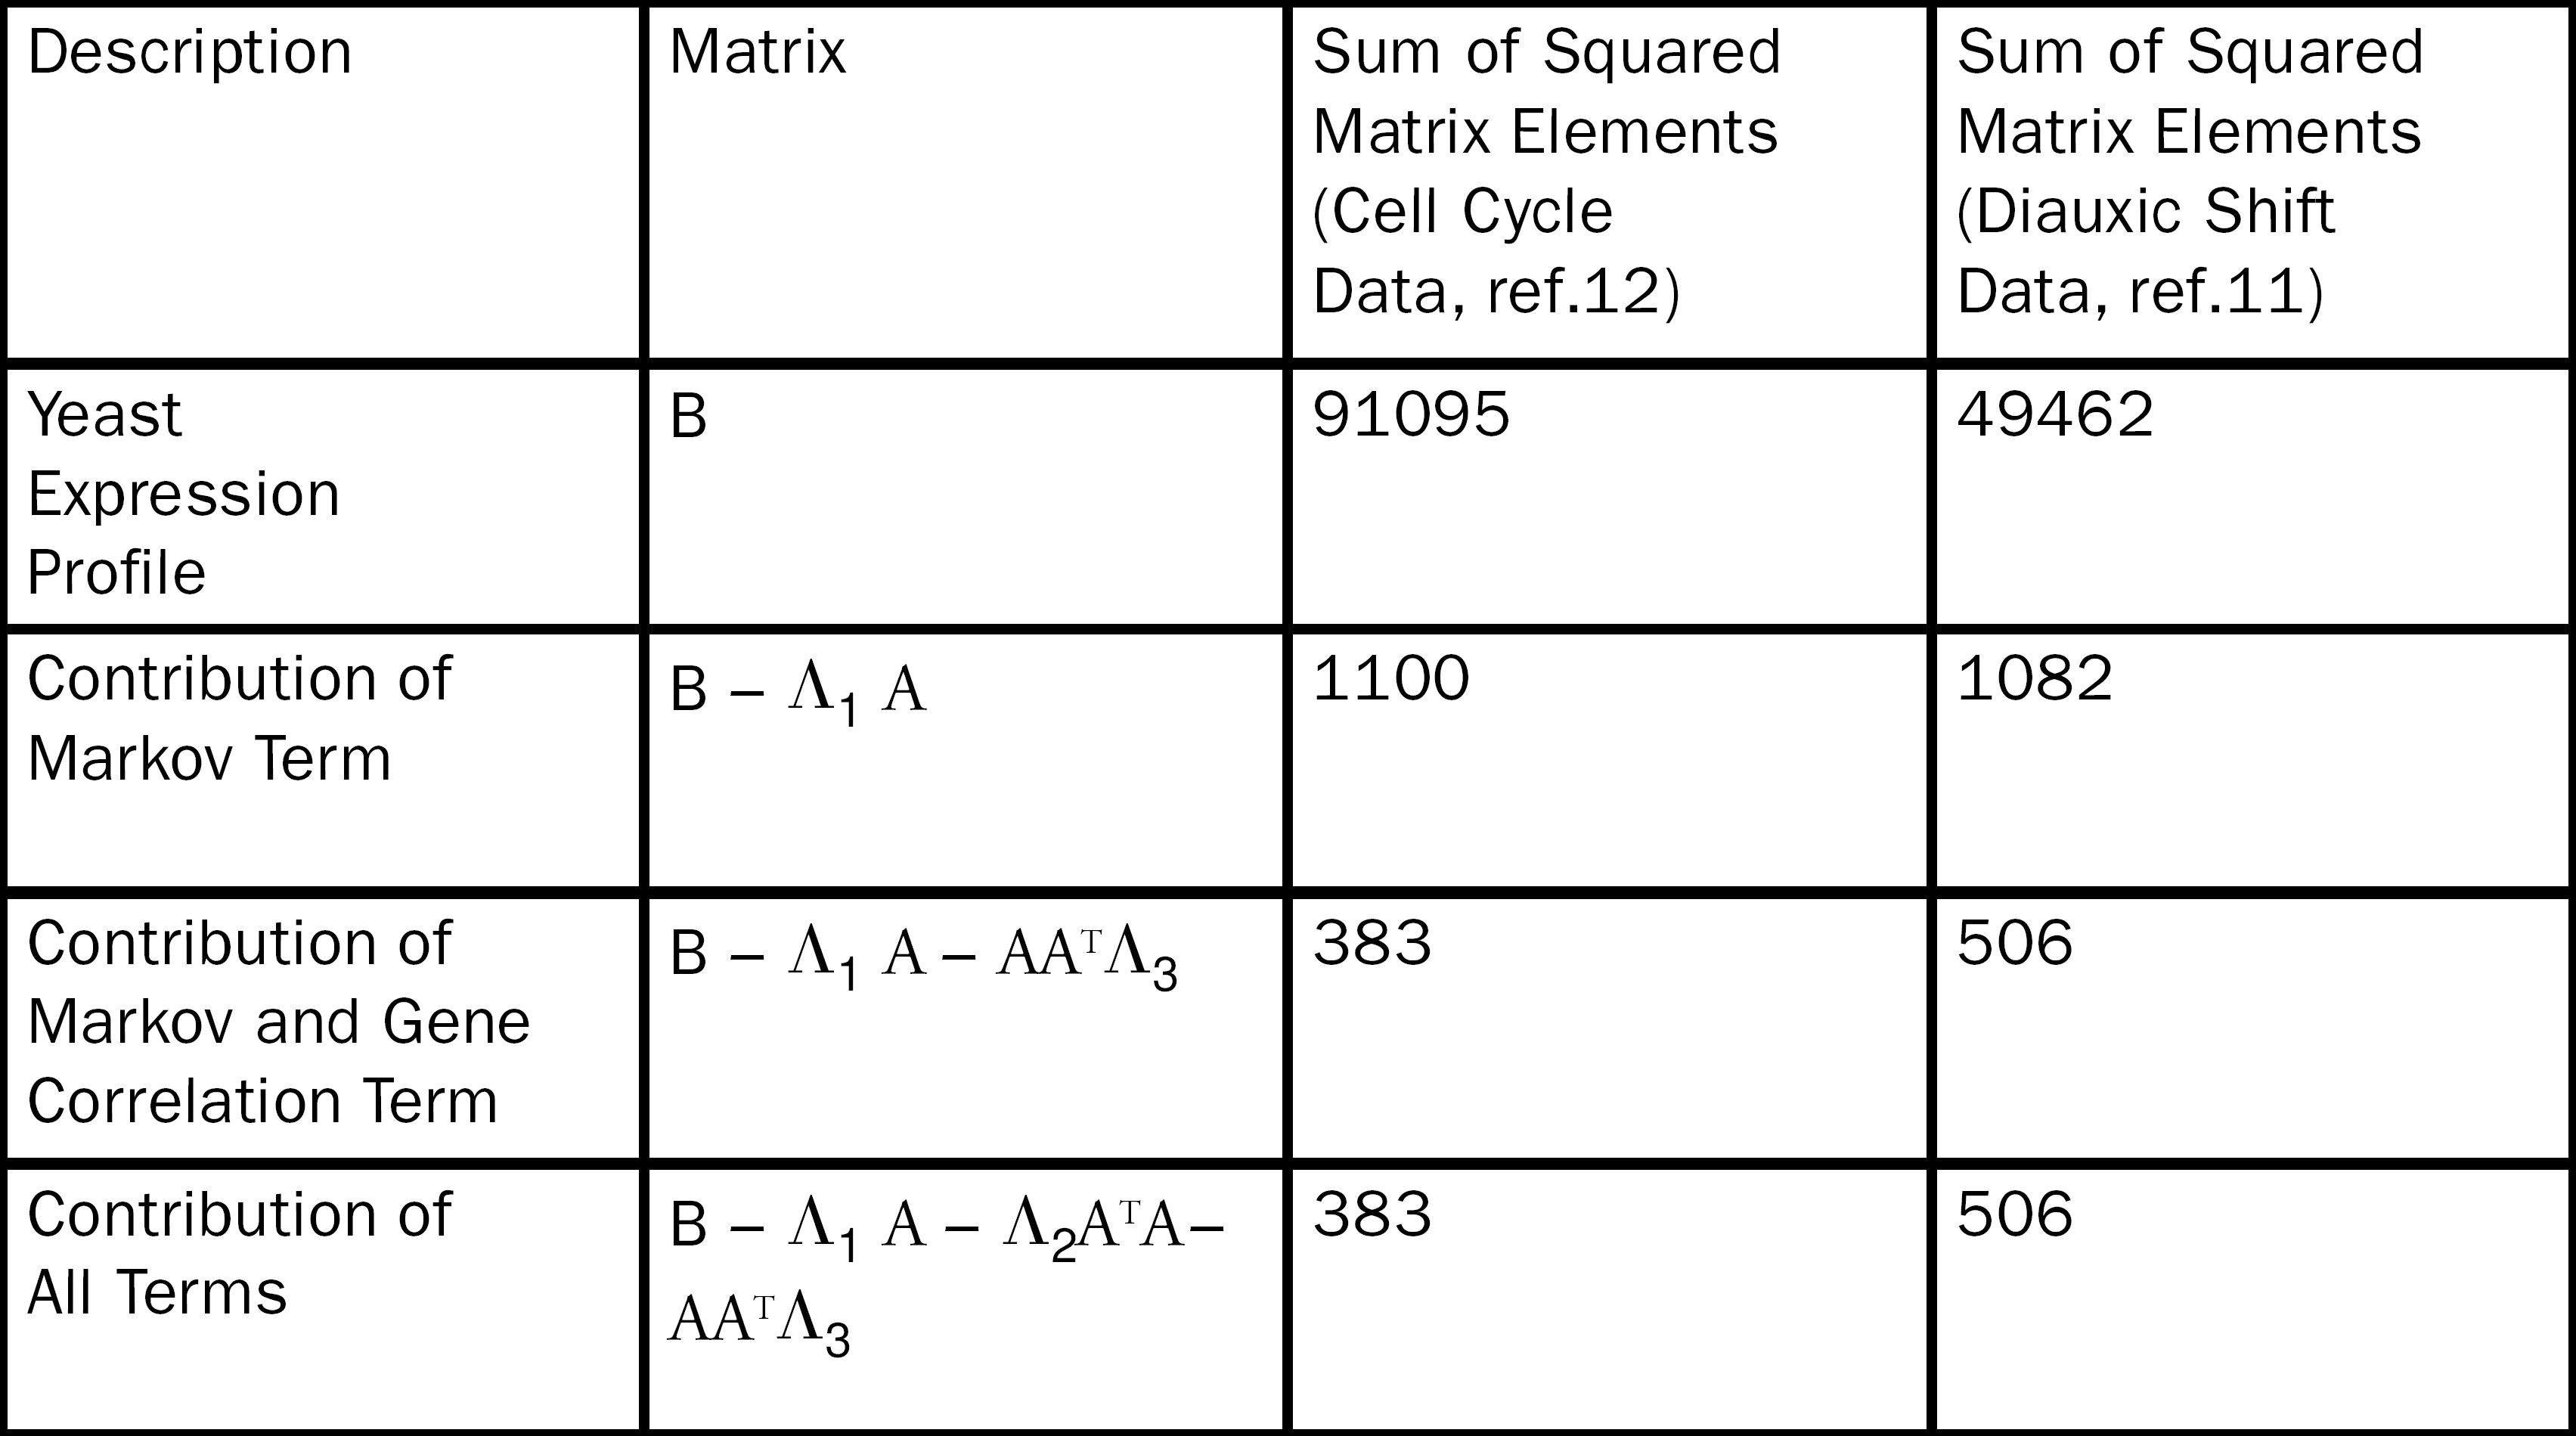
The ability of Eq. 4 to fit yeast expression profiles for the diauxic shift 11 and cell cycle data 12 is shown in table 1. The first order Markov term accounts for the largest amount of the fit and the nonlinear correction due to gene correlations provides a substantive reduction in the sum of squares residual. Interestingly, the non-linear time correlation has no impact on the fit parameter. This is probably a result of the low number of terms in the λ2 matrix. These comparisons reveal the interesting result that even with the inherent, underlying non-linearities in gene regulation, a large portion of the data set can be modeled with a simple Markov process.
GENE CLASSIFICATION SCHEME
The ultimate goal of this analysis of temporal data is to infer details concerning the underlying gene network — which genes show a causal connection to others. The Markov matrices, both linear and non-linear represent the most complete knowledge we can extract from this kind of data using our methods, and directly imply a network by their definitions. To create the network, we create an adjacency matrix by placing all elements above a threshold to unity and elements below the threshold are zero. The resulting matrix now represents a directed graph.
The connections implied by λ1 for the diauxic shift data for a specific, high threshold have been examined. In the present case, our threshold gives connections among 143 genes out of 6153. Pivotal genes for these connections are ACS1 (acetyl coenzyme A synthetase) located on chromosome I, and CDC27 (cell division control protein 27), located on chromosome II. All the connections we observe are between genes in the proximity of the chromosomal positions of these two genes. It is clear that there are many genes with the same or similar connections. This suggests that these genes should be classified together. We can use this general idea to define formally a natural classification scheme based on the dynamical network in which the genes are clustered into classes we call dynamical classes.
The scheme is a simple one that can be described as putting all genes with identical network connections (same inputs and same outputs) into the same class. In other words, the network graph is reduced by this procedure to one in which all identical nodes have been classed together producing a reduced graph that has only unique nodes. Genes that are influenced in identical fashion by other genes, as implied by this co-classification, are likely to be co-regulated. Thus, the dynamical class leads directly to the natural regulatory patterns of the expression system. Using the dynamical classification scheme, the network implied by this reduced matrix is shown in Figure 2.
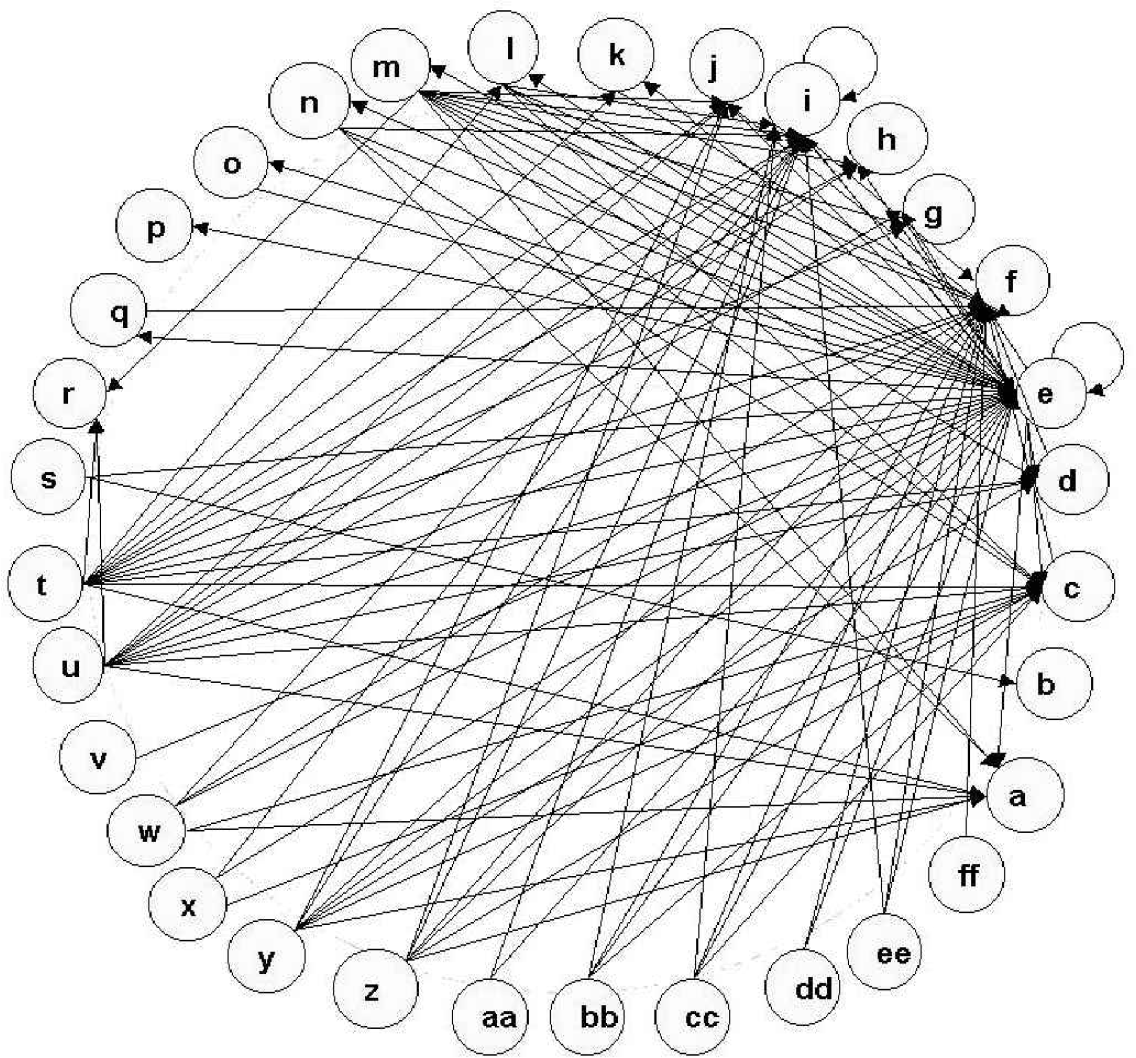
Dynamic classification and connectivity of genes. The dynamical classification reduces 143 genes to 32 classes. The directional connectivity between these classes is shown on the graph. The ORFs that are members of each class are given in the supplementary material. Classes with large numbers of connections have the following membership: c(TY1B), d(SCT1), e(CDC27), f(RPL1), t(FUN43), u(CNE1, YAL066W, TFC3, MDM10).
It is important to compare results from the dynamical classification using the transition matrix with those obtained from conventional cluster analysis. One must bear in mind that there need not be an exact correspondence between gene clusters and dynamical classes. In particular, genes that are regulated together may well cluster together, but if particular members of this population influence the expression of other genes, they will be in a different dynamical class from their co-regulated genes. The clustered genes can be examined to ascertain whether their transition matrix inputs (arrows leading into the gene) would put them into the same dynamical class and under identical control. An examination of the clusters in the previous work, 8 in the context of dynamical classes indicates that while the dynamical class analysis is a fundamentally different analysis, it is in this case largely consistent with results established from a conventional cluster analysis.
CONCLUSIONS
Our SVD formulation of a general dynamic model of gene expression networks appears to give a broad and general framework for consideration of the problems encountered in gene expression profile analysis, both as a formalism and as a data analysis method, and to yield a simple, robust classification method. The model extracted from the data can also be used directly to classify genes by an inherently self-consistent, fully transitive method, based on their dynamical properties within the network. This strong classification method groups all genes together that have identical connections. This grouping can be thought of as identifying common, parallel elements within the network. The method has the advantage of providing a natural interpretation of the models.
If you are interested in seeing more articles like this in JALA, please email