
Abstract
Microarray technologies have emerged as key tools for genomic expression analysis for the purposes of studying disease states, identifying drug targets, and profiling time-, tissue- or stage-dependent changes. The resulting volume of data generated necessitates the use of bioinformatics tools to find interesting gene expression patterns, to identify statistically significant changes across experiments, and to provide additional tools relevant to data mining.
We have developed a comprehensive workbench solution, GeneSpring™, which (1) comes with an intuitive interface incorporating organized file management, (2) handles data from multiple array formats, (3) includes multiple data display formats, (4) includes a suite of statistical clustering tools, and (5) incorporates automated annotation and cross-referencing.
We will discuss the set of algorithms collectively designed to facilitate gene function identification from large scale genomic expression experiments.
INTRODUCTION
The current challenge to realizing the promise of array technology is now due more to the availability of suitable and systematic methods for expression data analysis than to access to valid array technologies. One issue is whether part of the problem lies in the lack of hypotheses driving array experiments. Certainly, a hypothesis will help in focusing analysis efforts, but after addressing the hypothesis, there may yet be more meaningful information to be tapped from the volume of data generated. Much of the value in expression analysis should be expected to come from the generation of new hypotheses based on heretofore unexpected connections found in the data. This requires planning and executing a comprehensive analysis from a comprehensive set of expression profiles and remains an ongoing challenge for microarray investigators.
In this paper, we outline the set of tools that comprise GeneSpring as a means to survey current methods of analysis.
ORGANIZING THE TOOL SET: THE GENESPRING INTERFACE
The GeneSpring interface is constant among the Windows, Macintosh and UNIX platforms on which it is available. The main window is divided into three vertical panels: a Navigator Panel for file management, a Genome Browser Panel for visualizing expression data and a Color Key for the data points displayed in the Genome Browser Panel.
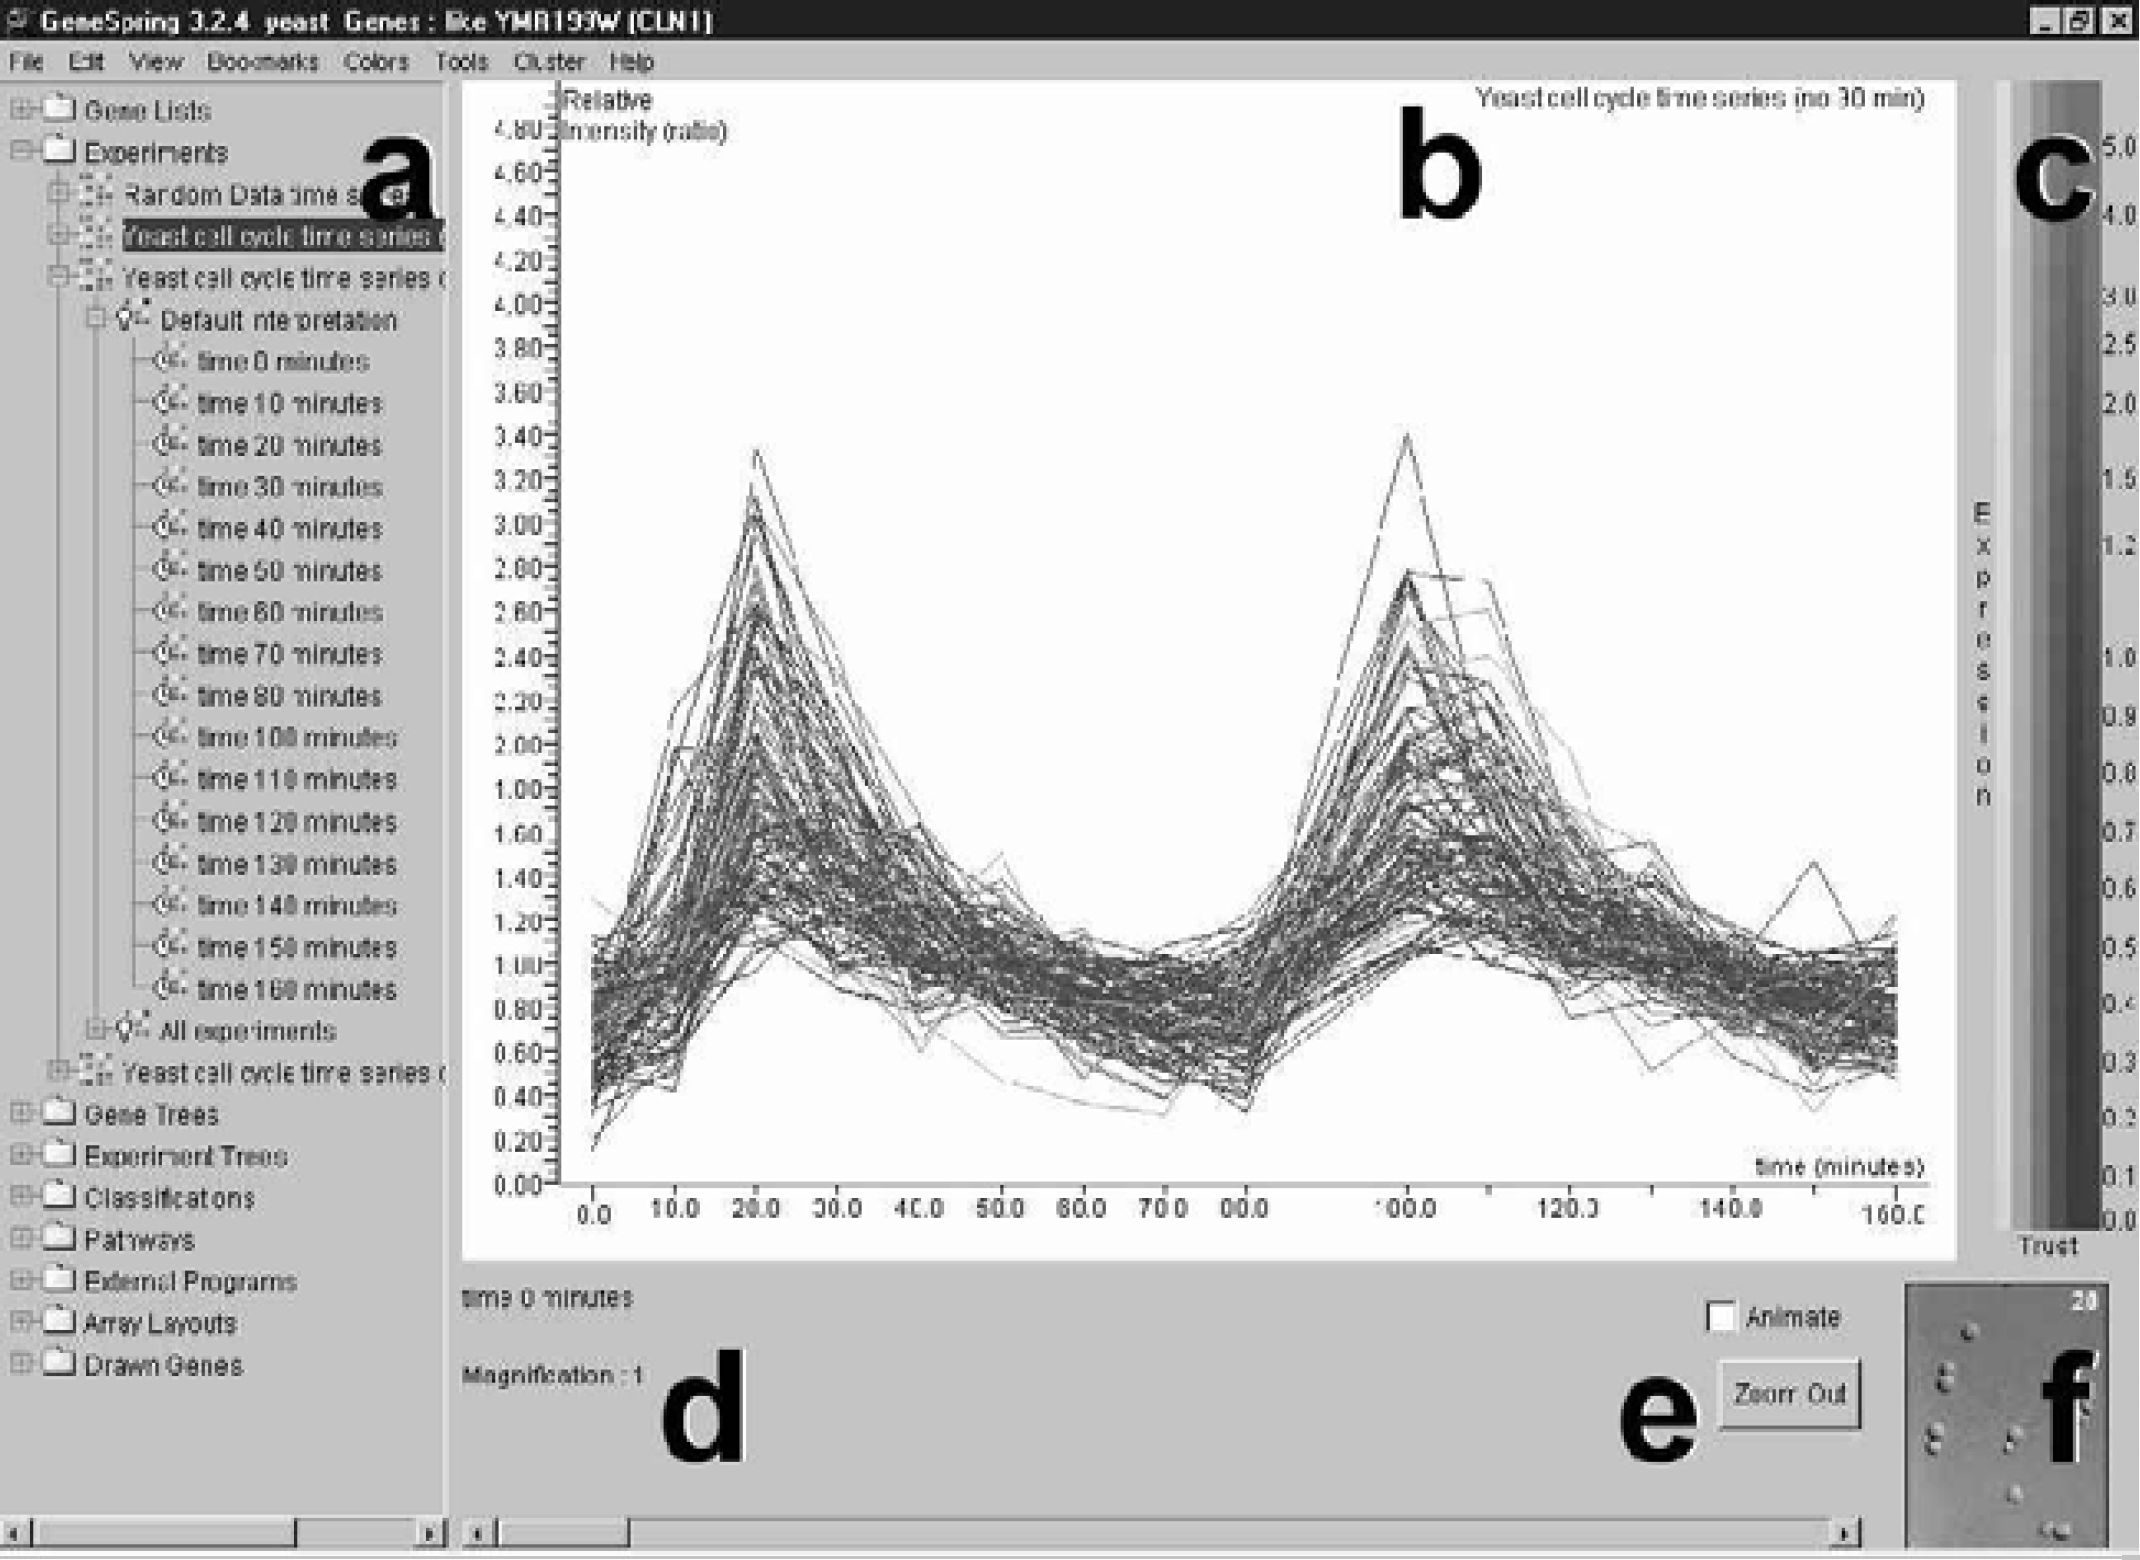
Main Window of the GeneSpring Interface. The main window is divided into three vertical panels, (a) the Navigator Panel, (b) the Genome Browser Panel and (c) the Color Key, as well as a lower footer panel, which includes (d) a parameter and magnification specification area, (e) animation button, animation scroll bar and zoom out button, and (f) associated image display area.
Most visualization formats and analytical tools are accessed via pull down menus. On a Windows platform, right-clicking the mouse when the cursor appears over the Display panel yields additional Pop-Up Menus from which views can be further customized.
DATA IMPORT: THE NEED TO ACCOMMODATE MULTIPLE ARRAY TECHNOLOGIES
Array technologies will differ by the output format and by the reference information available for normalization that allows for valid comparisons to be made across conditions. GeneSpring incorporates an Experiment Wizard that queries the user for information relevant to translating the output imported as a tab-delimited text file to an appropriate display. This includes specifying the normalizations required and the parameters defining each condition.
It is important to identify the specific objectives of array investigations before reviewing the analytical tools available. Investigators may wish to:
Identify differentially expressed genes in a pair-wise comparison.
Identify new candidates in a pathway under study.
Postulate function for poorly characterized genes (i.e. ESTs).
Generate expression signatures of profiles for phenotypes or disease processes of study, then generate successively refined pro files (i.e. developmental stage-specific, disease progression-state, tissue-specific).
These efforts all contribute towards the larger goal in functional genomics of building up a gene interaction network for each organism which identifies the function of each gene product in terms of the full set of its protein-protein and protein-DNA interactions and the strengths and downstream effects of each of those interactions.
MAKING THE INFORMATION MEANINGFUL: VISUALIZATION OPTIONS
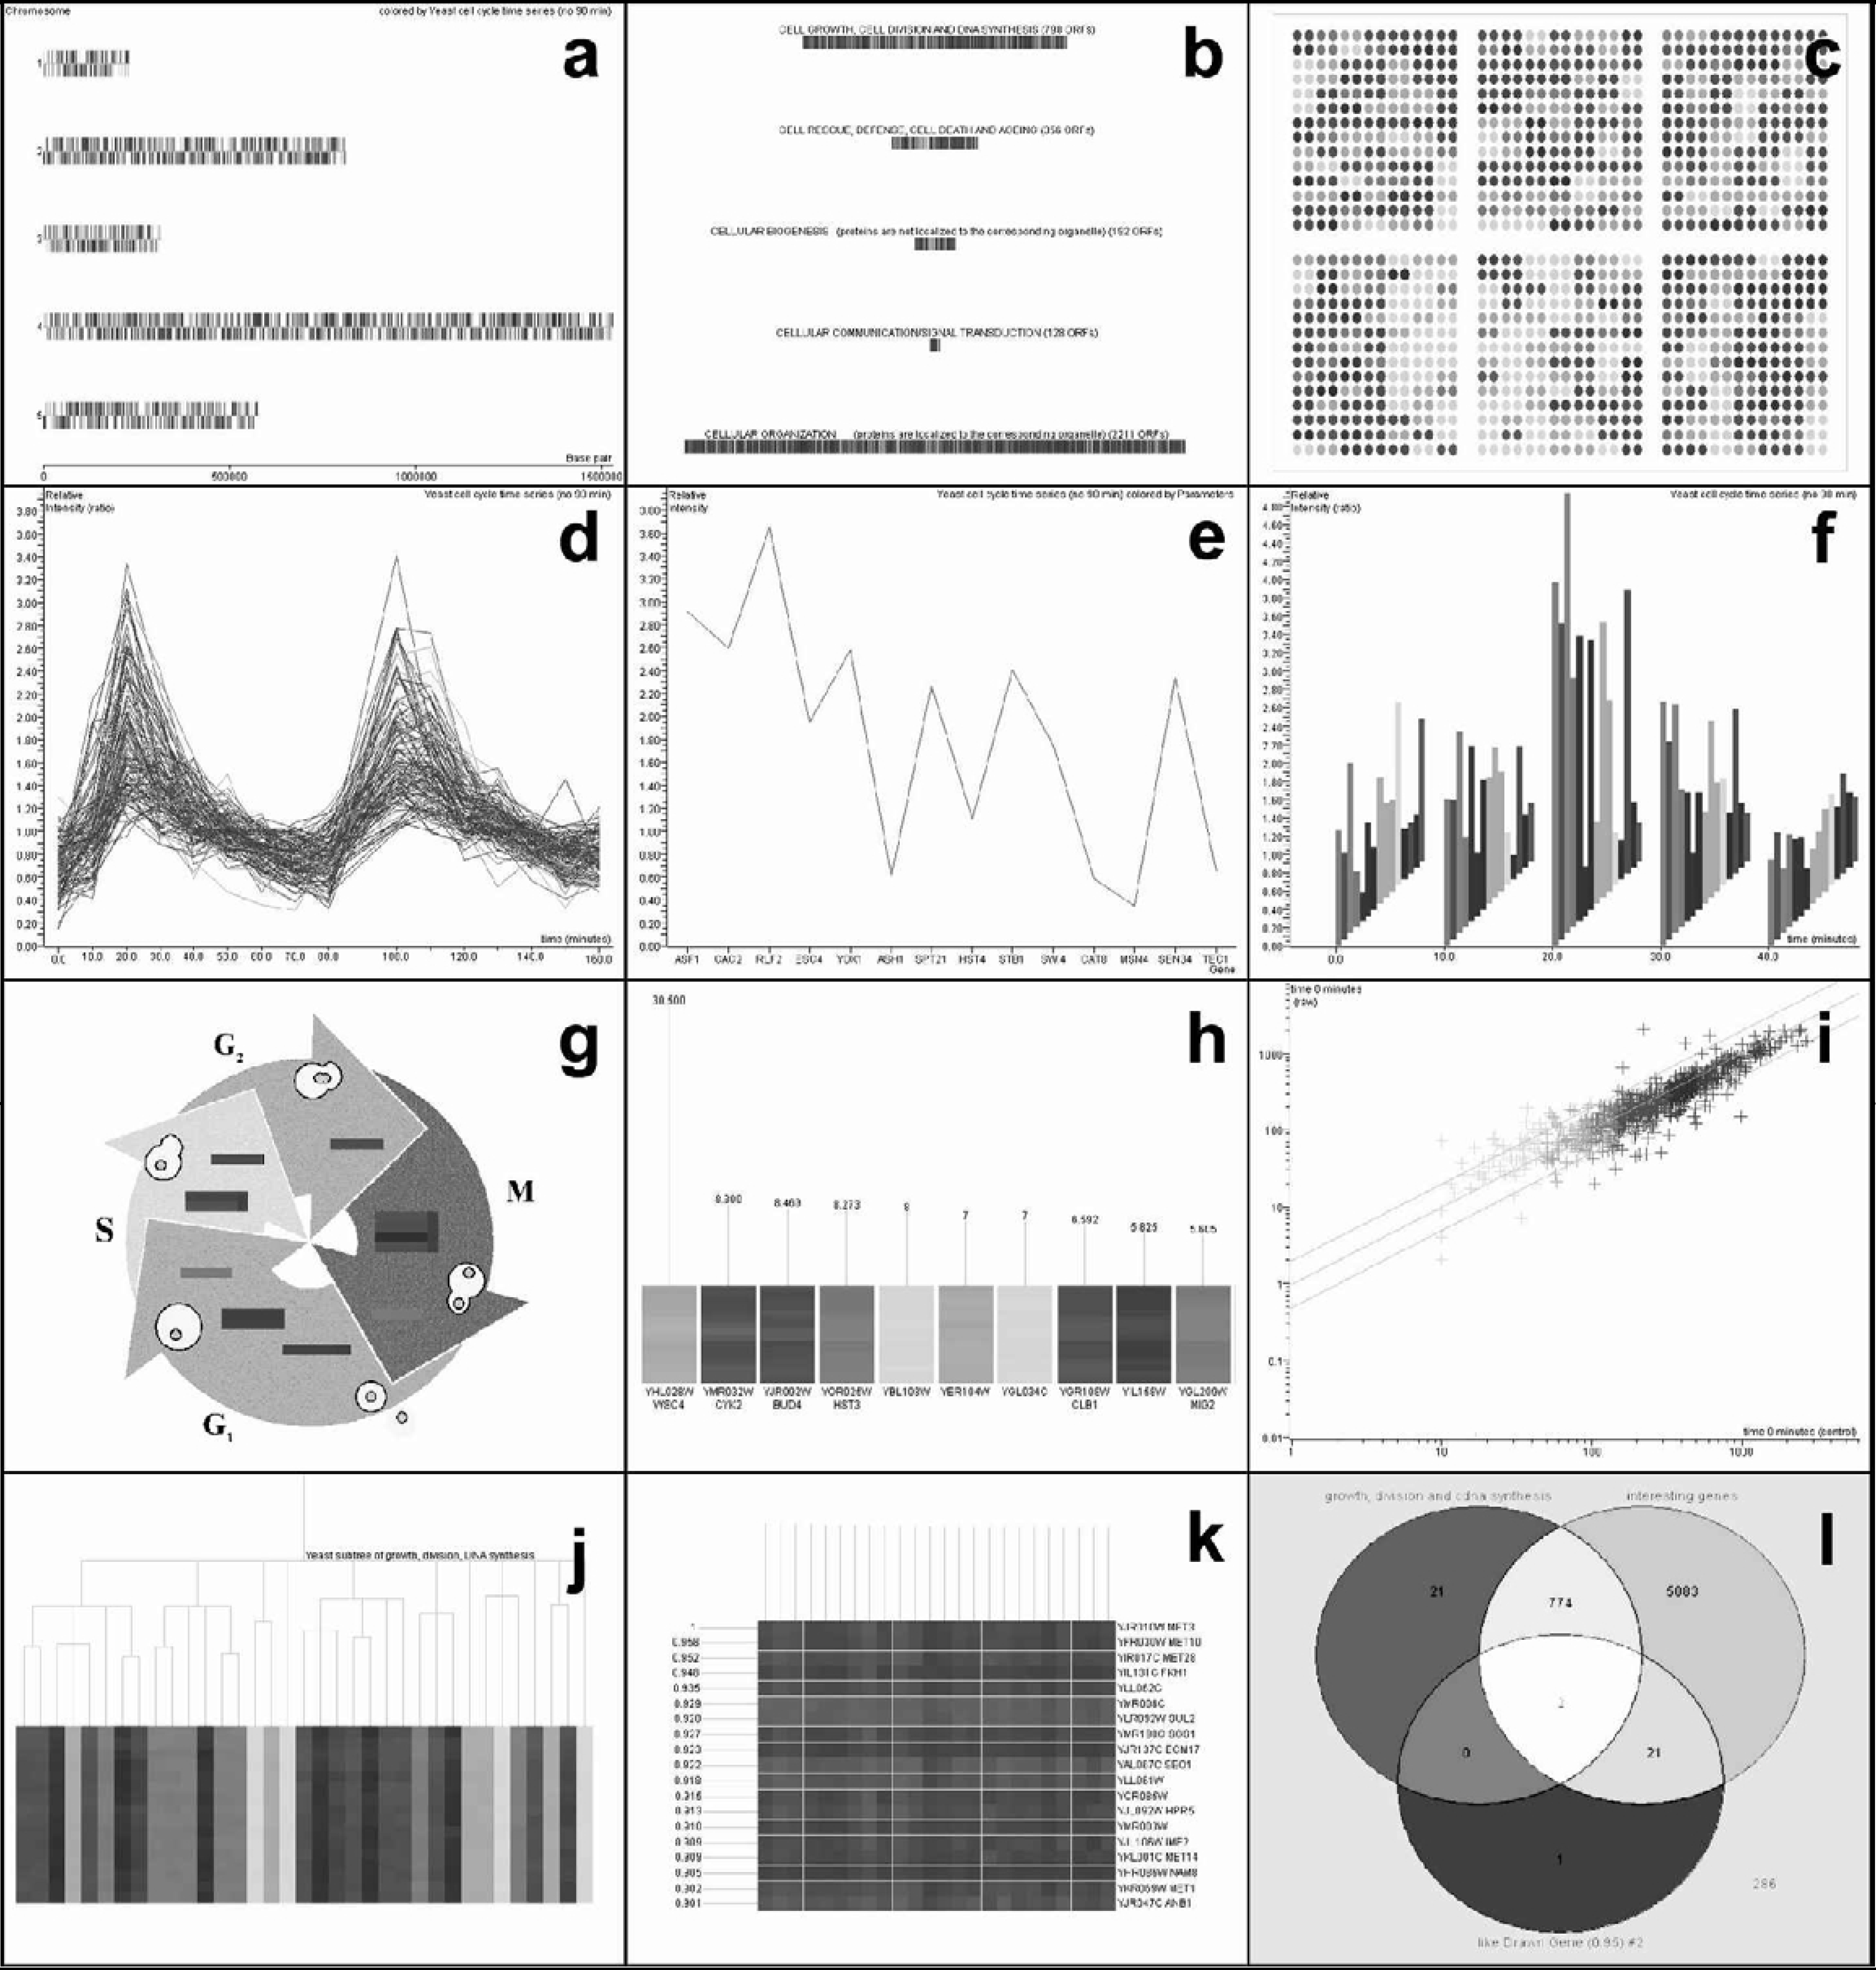
The first step in making the data obtained from sampling thousands of genes comprehensible is to offer appropriate visualization options. A relevant graphic can provide an overview of expression at one time point or condition or be alternatively informative when comparing expression across experiments for a smaller subset of genes. By default, data points or genes in most views are colored by expression level for a given experiment, with hue across a two-color spectrum representing level of expression and saturation serving as a cue for data reliability. Users can opt instead to use coloration to specify (1) parametric values, (2) defined classifications, such as clustering sets or predefined functional classes, or (3) genes' locations within sets or intersections of a Venn Diagram.
Specific visual display formats include: (1) Graph View, a plot of expression level against the conditions of the experiment; (2) Physical Position, a display of gene expression data over chromosomal or plasmid maps; (3) Classification View, a display of genes categorized by function or another defined classification; (4) Array Layout View, a schematic representation of expression data over the positions of genes as gridded on the array; (5) Graph-by-Genes View, a continuous plot of expression levels against genes on the x-axis; (6) Bar Graph View, a bar graph representation of expression level of each gene for each condition of the experiment; (7) Pathway View, an overlay or mapping of expression data onto a 2–dimensional image (.gif or .jpeg file), representing a pathway; (8) Ordered List, a display of genes in ranked order of a set of associated values; (9) Scatter Plot, a plot of two sets of variables for data points against each other; and (10) Compare-Genes-to-Genes View, a matrix displaying correlation co-efficients for expression profiles for pairs of genes.
The total number of data points for which expression data is displayed can be reduced from the full set by choosing a subset of genes which have previously been saved as a gene list in the Navigator Panel. Zooming and Panning options allow the user to change the magnification in the Genome Browser view.
ANALYSIS TOOLS
Filtering Tools
Subsets of genes can be identified and saved as gene lists by simple criteria matching. So, for instance, a list can be generated for genes which exhibit a specified fold-increase when comparing two experimental conditions. A restricted set of genes chosen for further analysis may also be generated by specifying a maximal allowable percentage variation among replicate samples or by specifying threshold signals in order to consider only genes for which reliable expression data has been obtained.
The ‘Find Similar’ feature identifies expression patterns similar to a specified pattern using a chosen distance metric and a minimum required correlation co-efficient.
Clustering and Pattern Discovery Tools
Genes that respond similarly to the changing conditions of an experiment are more likely to share similar functions or more likely to be involved in a common pathway than genes responding differently. Thus, it would be useful to divide genes into groups based on expression profile similarity. Clustering algorithms represent a set of methodologies employed for this purpose. In many cases, the metric distance used to determine relative similarity (i.e., standard correlation, Euclidean distance, Pearson correlation, etc.), is not fixed; thus, the result of a particular clustering is determined both by the clustering methodology and the chosen metric distance.
Biologists are most familiar with hierarchical clustering due to its use in genomics to generate phylogenetic trees. In the context of gene expression, a tree of genes is built by successively finding the two most similar gene expression patterns from the full set. 3 The pair of genes identified in the first iteration comprises a sub-tree of the final tree and the average profile of this sub-tree then serves as the representative profile in subsequent iterations to determine the next most similar pair of profiles from which to make a new subtree larger from the previous by an additional branch. The final result is a tree of all genes. Hierarchical clustering can actually be obtained in two dimensions when experiments are similarly clustered.
Another method, the K-means clustering algorithm, divides genes into k equal-sized groups where k is a number chosen by the user. 2
Self-organizing-maps (SOM) is a heuristic process 4 for grouping genes. For a set of genes sampled over n conditions, a grid of a times b centroids is set arbitrarily in n-dimensional expression space where a and b are values chosen by the user. Then, as a means to find representatives of a × b clusters, some of which may represent biologically relevant clusters, the algorithm shifts the centroids towards clusters of the data-points through an iterative process which attempts to minimize the sum of Euclidean distances between data points and nearby centroids.
Principal Components Analysis is a means to represent the variation in expression data in n-dimensional expression space by generating a set of n orthogonal vectors. A first component vector is generated which accounts for as much of the variation in the data as possible. Subsequent vectors are generated to successively account for the variation remaining.
Pathway Analysis and Similarity Searching
While the above-mentioned pattern discovery methods attempt to group genes without additional information, existing information can and should be exploited to integrate the expression data with current knowledge. GeneSpring facilitates this through several features. Firstly, the GenBank identification number associated with genes can be used to update a list with annotations like keyword, common name and others imported from GenBank, LocusLink and UniGene. A second feature allows the user to make new gene lists based on these properties. Users can also generate their own gene lists based on function or other categorizations. Thirdly, GeneSpring incorporates automated cross-referencing such that whenever a new gene list is generated as the result of an analysis within GeneSpring (i.e. upregulated genes), all similar gene lists (p-value<0.05) existing in the Navigator folder are identified. GeneSpring reports the P-value, the probability that the new list and the similar gene list share common genes by chance based on the size of the two respective lists and the total number of genes on the array. This automated cross-referencing is also incorporated into hierarchical clustering wherein the node of each subtree is treated as a new gene list and into k-means clustering and SOM wherein each set is treated as a gene list.
One additional feature is worth mentioning. When in the Pathway Display format, the user can choose a position on the pathway and invoke the ‘Find genes which may fit here’ feature. For this, GeneSpring identifies genes not displayed on the pathway as candidates based on the similarity of their expression profiles to neighbors at the point selected on the two-dimensional image, versus more distant neighbors.
As the volume of data rapidly increases, data storage, data retrieval and higher-level data mining will drive the development of new bioinformatics tools. And this should allow even more knowledge to be gleaned from microarray analysis, further realizing the promise from the most exciting current means of probing biological systems.