
Abstract
This presentation was first given at The Second Cherry Blossom Symposium - Japan Laboratory Automation, April 2000. It is reproduced with the permission of the organizers. For further information contact:
INTRODUCTION
As automation of clinical testing advances, quality has come to be required of clinical testing systems. CLINIEEL (Clinical Expert Engine Library), the zone verification method on results distribution, which was developed through the experience of Laboratory Automation System (LAS) and Laboratory Information System (LIS), is a real testing result verification system A&T produces as a system integrator. This is not as an extension of an operational processing system but the core of Total Automation System. Furthermore, as the step toward testing support and diagnosis-support system, CLINIEEL supports clinical testing with excellent quality.
The zone verification method on results distribution is a new verification method which was developed by cooperation of A&T and Masashi Chiba, Tokyo Metropolitan Toshima Hospital. Its purpose lies in reduction of over re-testing. Over re-testing means needless re-tests. The re-testing rate of the conventional method is so high that it is of no use. Potential for diagnosis-support tends to be stressed, but it is important in the first place, to steadily get clean data. On the condition that testing values are reliable, diagnosis-support becomes possible. Therefore, the zone verification method can be said to be testing support.
THE BASIC CONCEPTS OF THE ZONE VERIFICATION METHOD
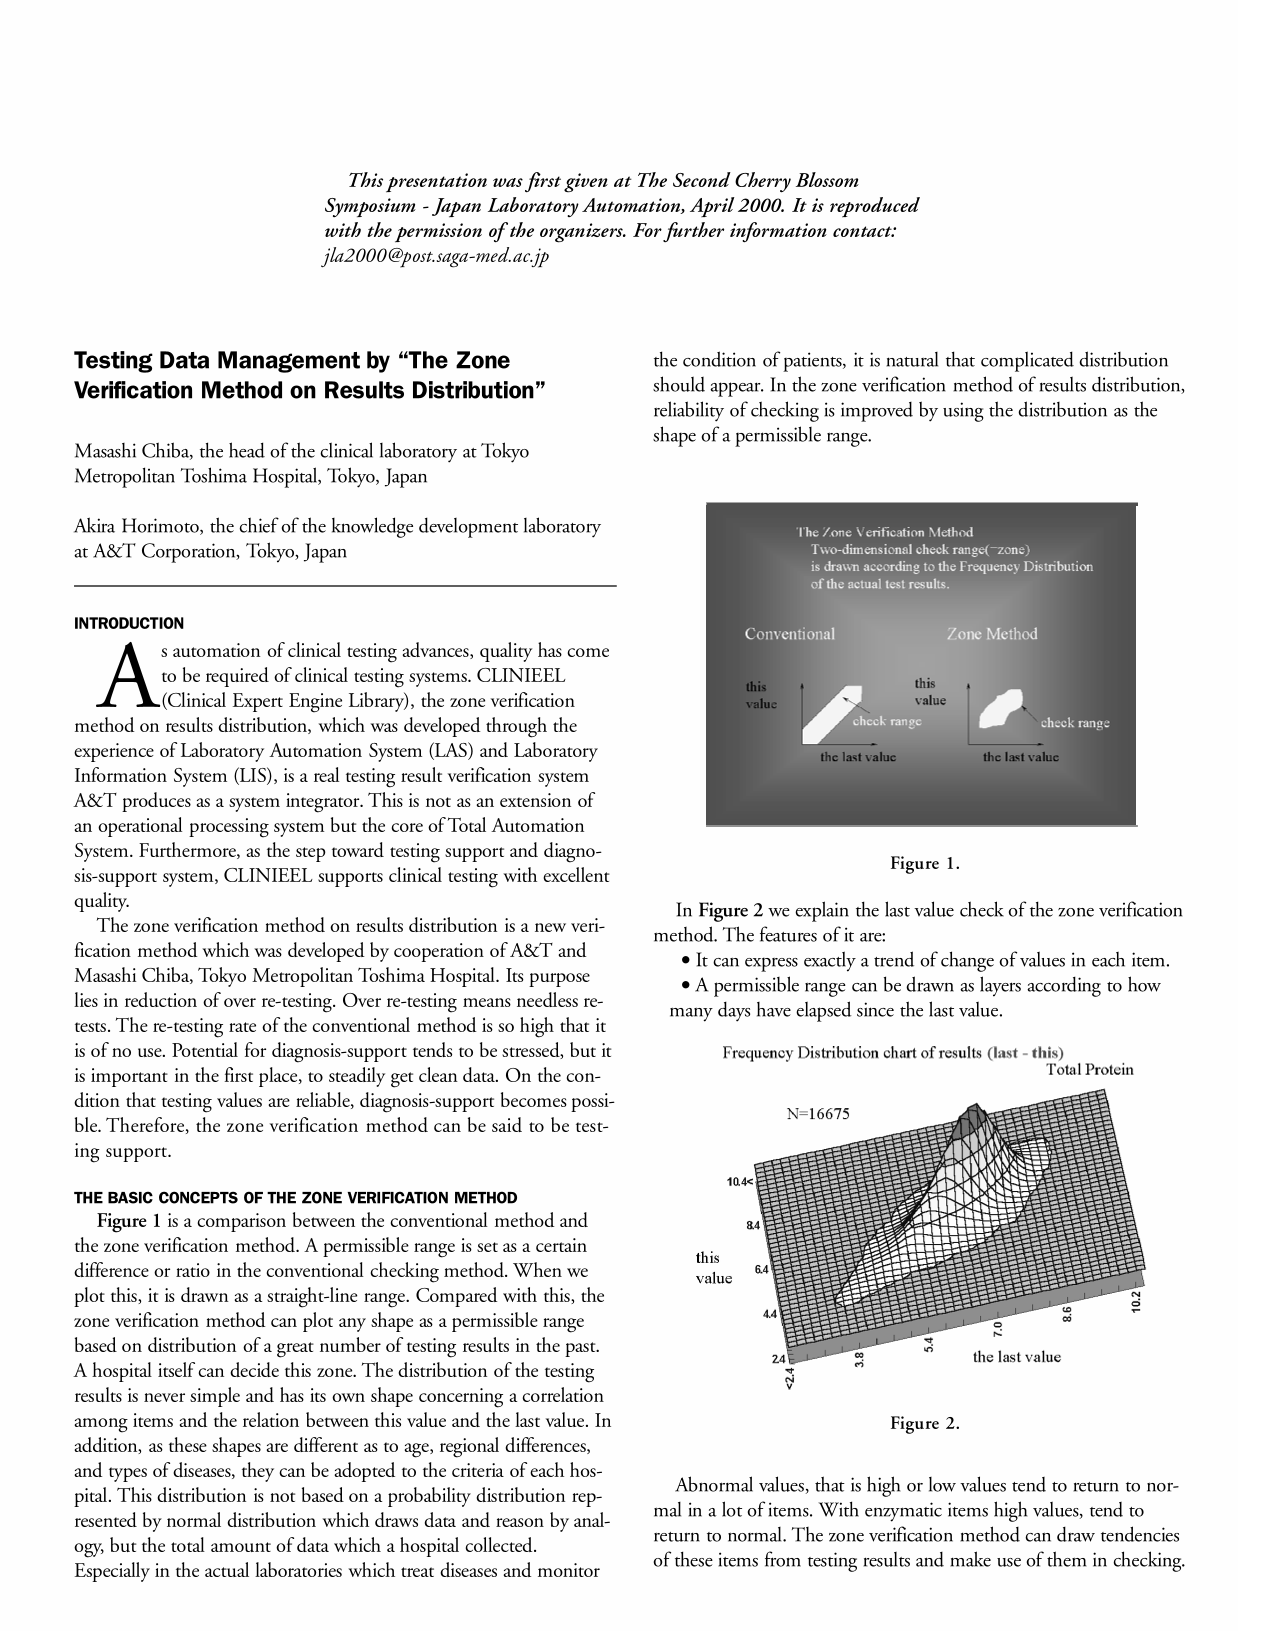
Figure 1 is a comparison between the conventional method and the zone verification method. A permissible range is set as a certain difference or ratio in the conventional checking method. When we plot this, it is drawn as a straight-line range. Compared with this, the zone verification method can plot any shape as a permissible range based on distribution of a great number of testing results in the past. A hospital itself can decide this zone. The distribution of the testing results is never simple and has its own shape concerning a correlation among items and the relation between this value and the last value. In addition, as these shapes are different as to age, regional differences, and types of diseases, they can be adopted to the criteria of each hospital. This distribution is not based on a probability distribution represented by normal distribution which draws data and reason by analogy, but the total amount of data which a hospital collected. Especially in the actual laboratories which treat diseases and monitor the condition of patients, it is natural that complicated distribution should appear. In the zone verification method of results distribution, reliability of checking is improved by using the distribution as the shape of a permissible range.
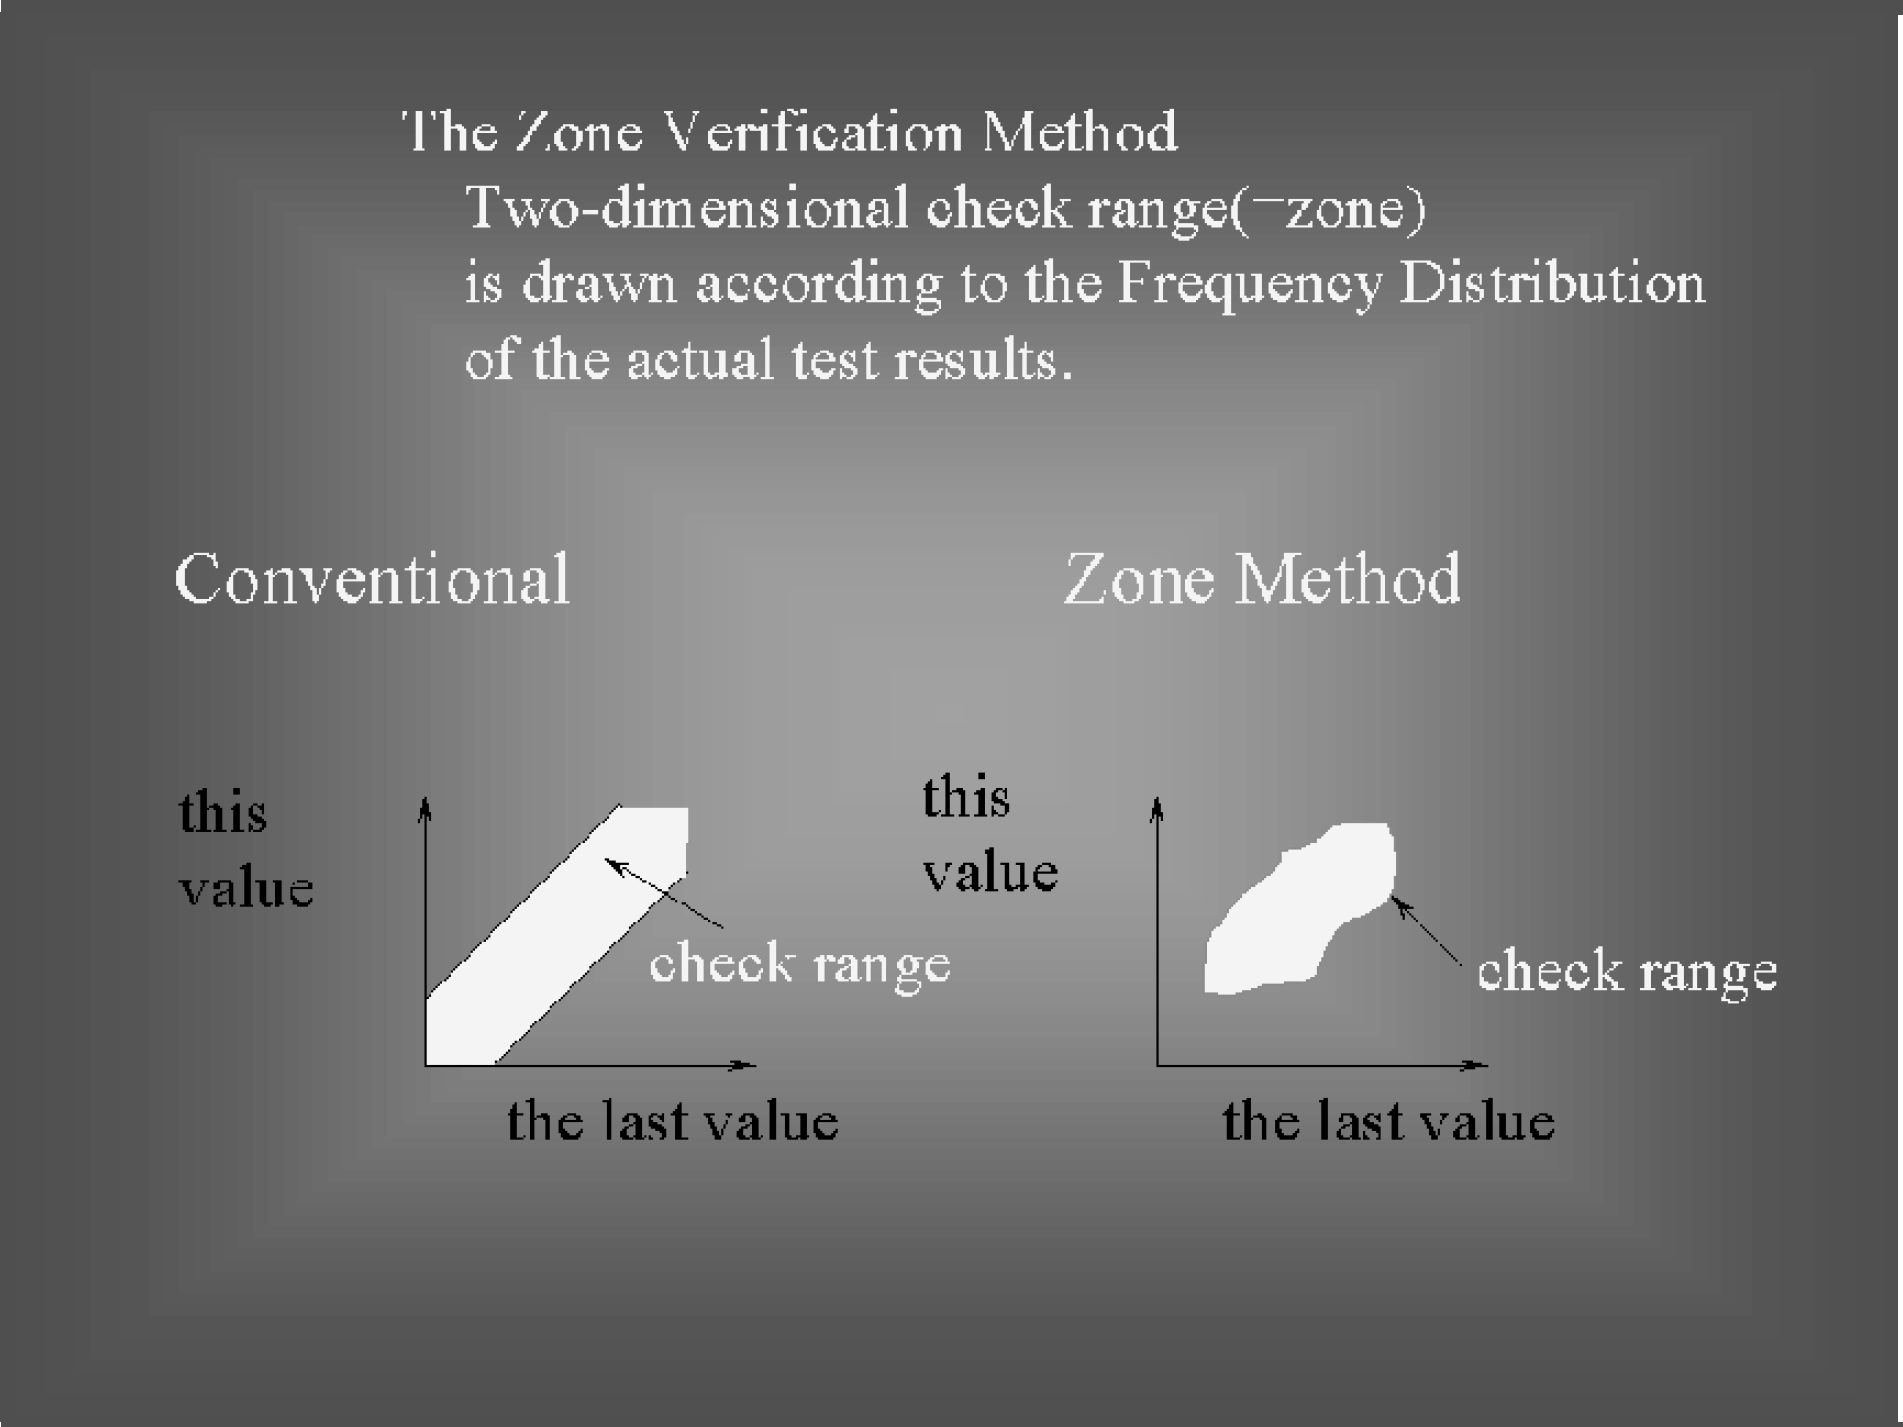
In Figure 2 we explain the last value check of the zone verification method. The features of it are:
It can express exactly a trend of change of values in each item.
A permissible range can be drawn as layers according to how many days have elapsed since the last value.
Abnormal values, that is high or low values tend to return to normal in a lot of items. With enzymatic items high values, tend to return to normal. The zone verification method can draw tendencies of these items from testing results and make use of them in checking. A zone is shaped not by a statistical calculation but accumulation of a large quantity of testing results in facilities. Therefore, the more tests you carry out with an item, the more accurate zone you can have.
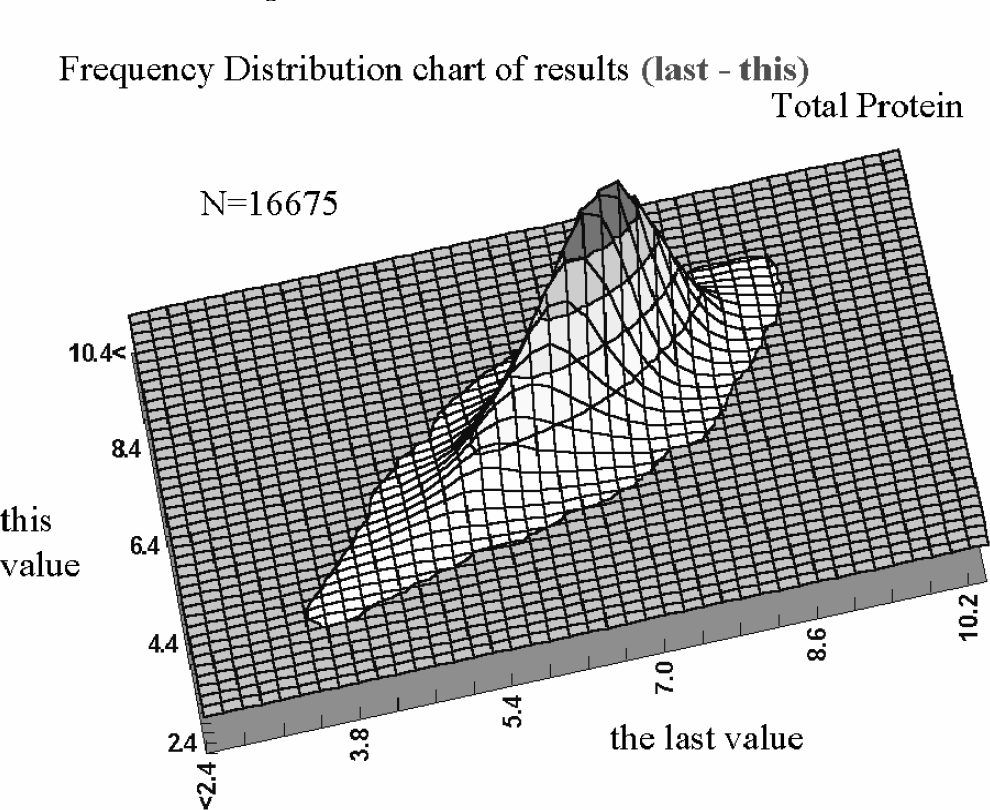
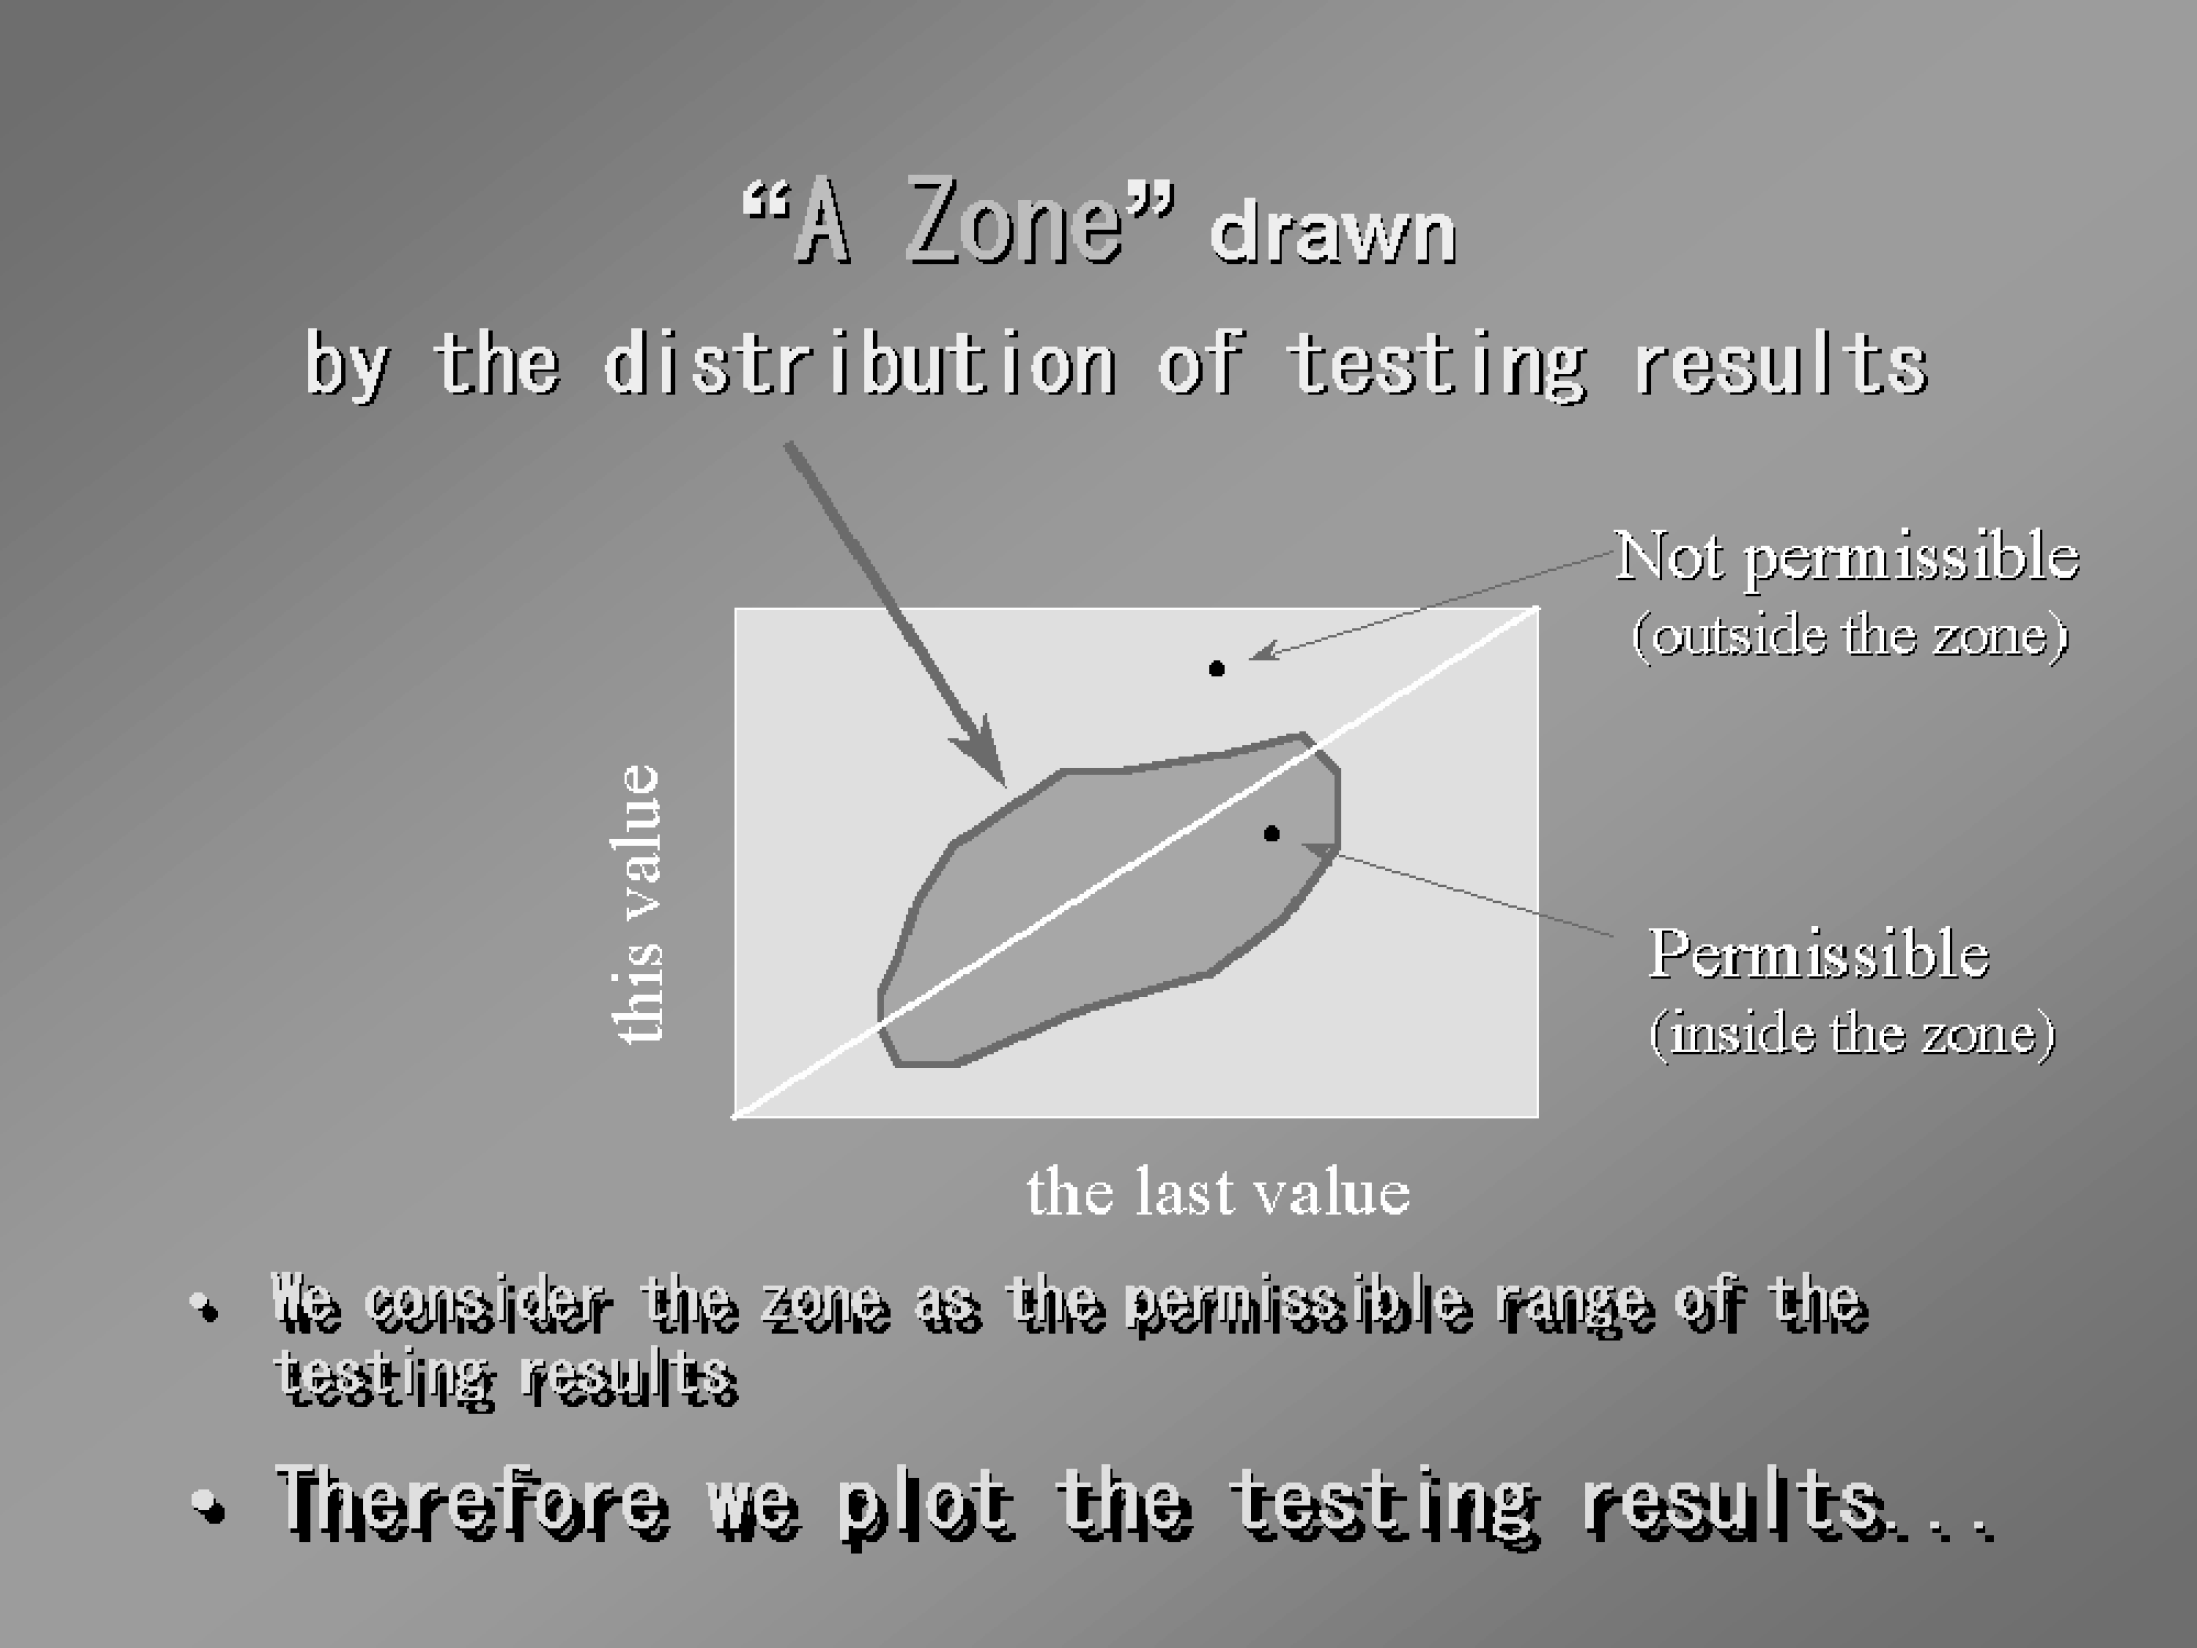
A diagonal line in Figure 3 means this value is equal to the last value. In the zone verification method we draw a permissible zone based on a distribution of a large amount of testing results. A testing result is judged by whether it is inside the zone or not.
Concerning an inter-item correlation we can get a frequency distribution chart of testing results on two items, that is, three-dimensional distribution based on a large amount of results by choosing arbitrary items in a X axis and a Y axis (Figure 4).
Frequency Distribution chart of results (inter-item)
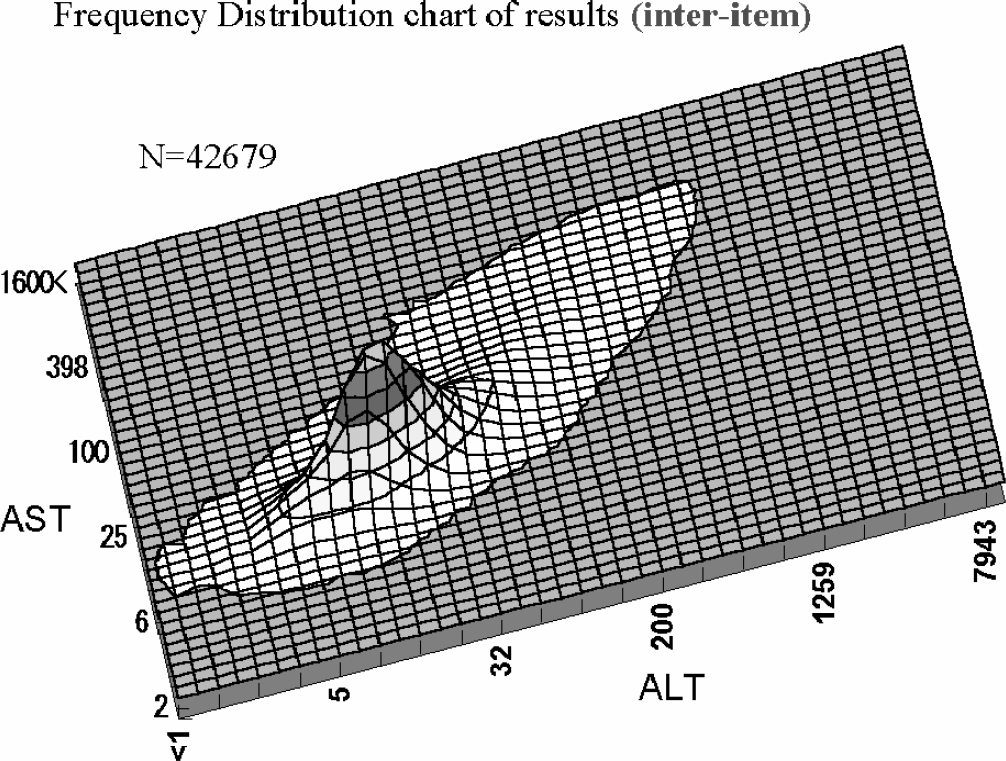
Based on this results distribution we draw a permissible range as a zone. As we can draw any shape likewise, we can have a zone in accordance with more actual distribution, whether there is a correlation between items or not. Interestingly enough, the new condition of a disease can be discovered by an abnormal value. That is, if a specific disease and result distribution between items should be connected, we can point out a possibility of a disease from a testing result. In this regard an analysis of results distribution between items has the potential for Diagnosis-support. Furthermore, we take note of the number of days which passed since the last value and draw a permissible range as layers. That is, we draw different permissible ranges according to whether the last value is that of seven days ago or four weeks ago (Figure 5).
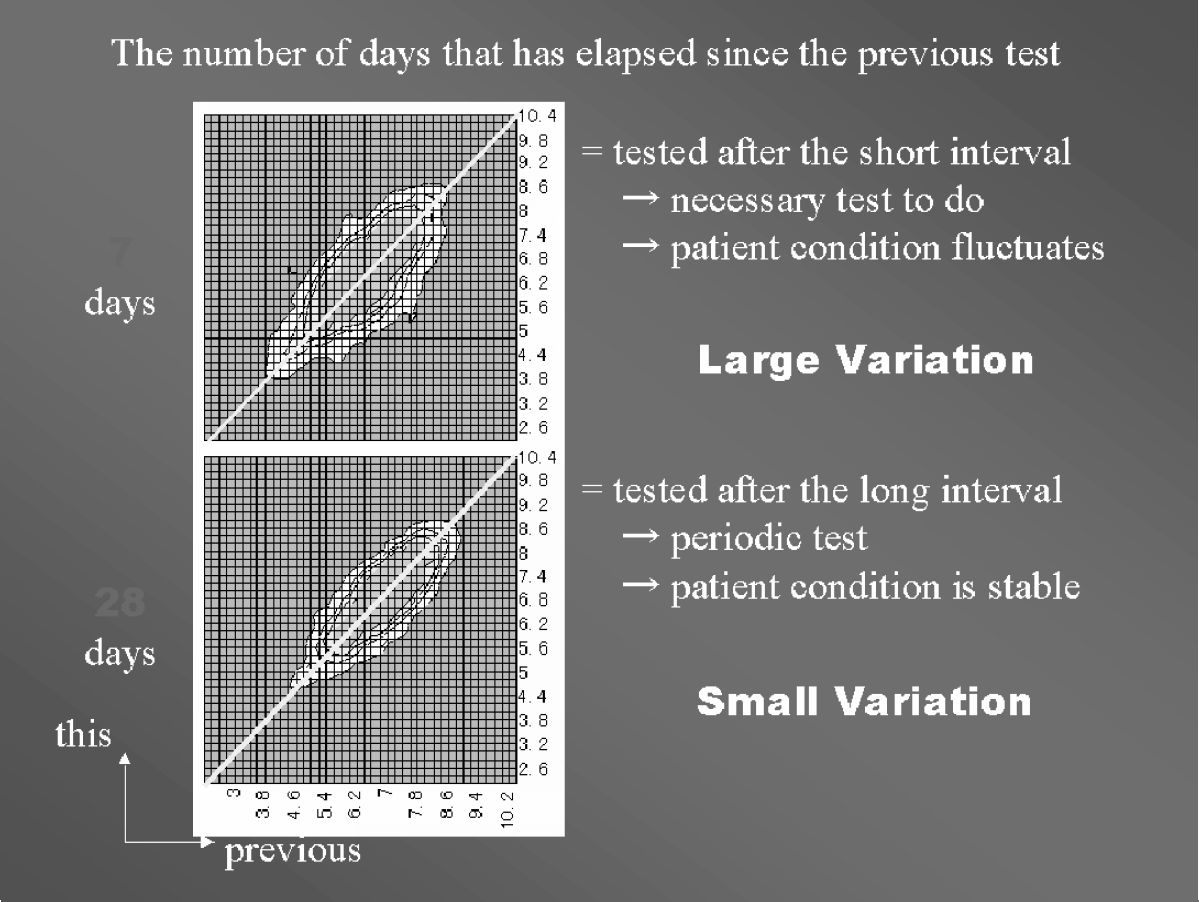
We can think a medical decision exists in terms of the number of days. Speaking of the number of days that passed since the last value, that the number of days is small means frequent tests were needed under treatment. That is, it is conceivable that doctors want to know changes by treatment and dosing immediately. As a matter of course, fluctuations in testing results are large. On the other hand, that the number of days is large means testing was not needed during the interval. Naturally, fluctuations in testing results are small. This is based on the fact that distribution of testing results is different according to the number of days which have passed. We can regard this as a big feature of the zone verification method. To doubt a rare phenomenon or a phenomenon which we rarely experience is the basic concept behind the zone verification method. We could say this is more human (in the sense of expert) judgement.
A FULLY AUTOMATED RE-TESTING SYSTEM
More fully automated re-testing systems can be realized by installing the zone verification method. Although there was automated re-testing system before, the verification logic was too simple to be sufficient. This zone verification method is the logic of result verification. Compared with the conventional method, it is highly logical. We call it A fully automated re-testing system, in the sense of adding the practical verification logic to the automated re-testing mechanism.
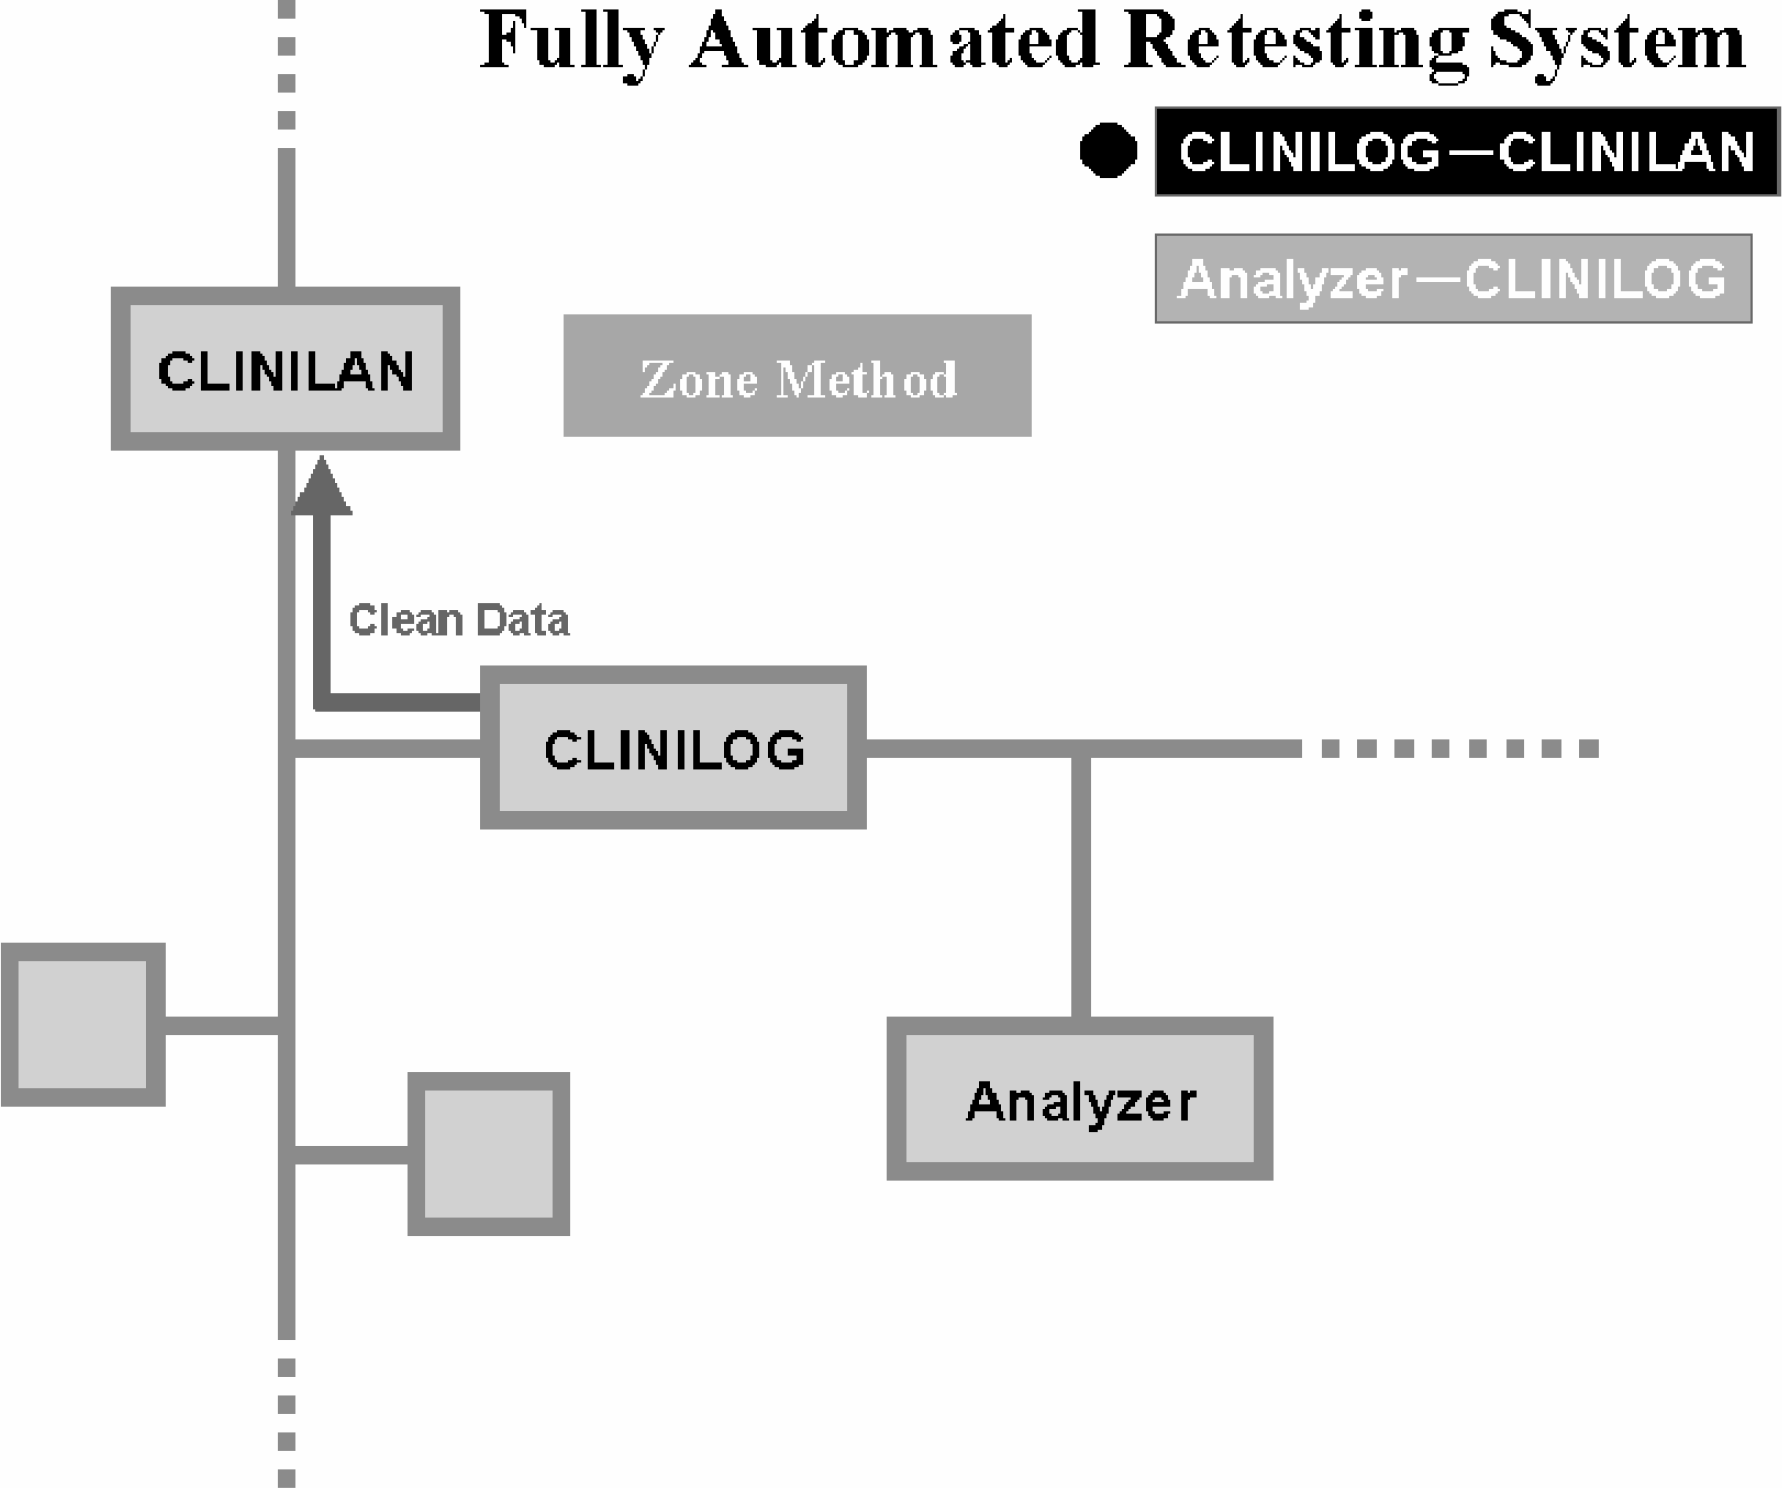
We can construct an automated re-testing system by combining the zone verification method with Laboratory Information System (LIS) and Laboratory Automation System (LAS). The zone verification method CLINIEEL can be installed in our transportation system, CLINILOG. Re-tests are automatically carried out inside LAS by sending requests with the last values from a higher system and only the clean data can be sent to a higher system. With analyzers outside the transportation we can construct an automated re-testing system by installing the zone verification method in our clinical laboratory information system CLINILAN. In this case CLINILAN judges the first, testing results and orders analyzers to retest. Analyzers which received re-testing requests re-test automatically and send results back to CLINILAN. CLINILAN can automatically send these data as clean data to a hospital system.
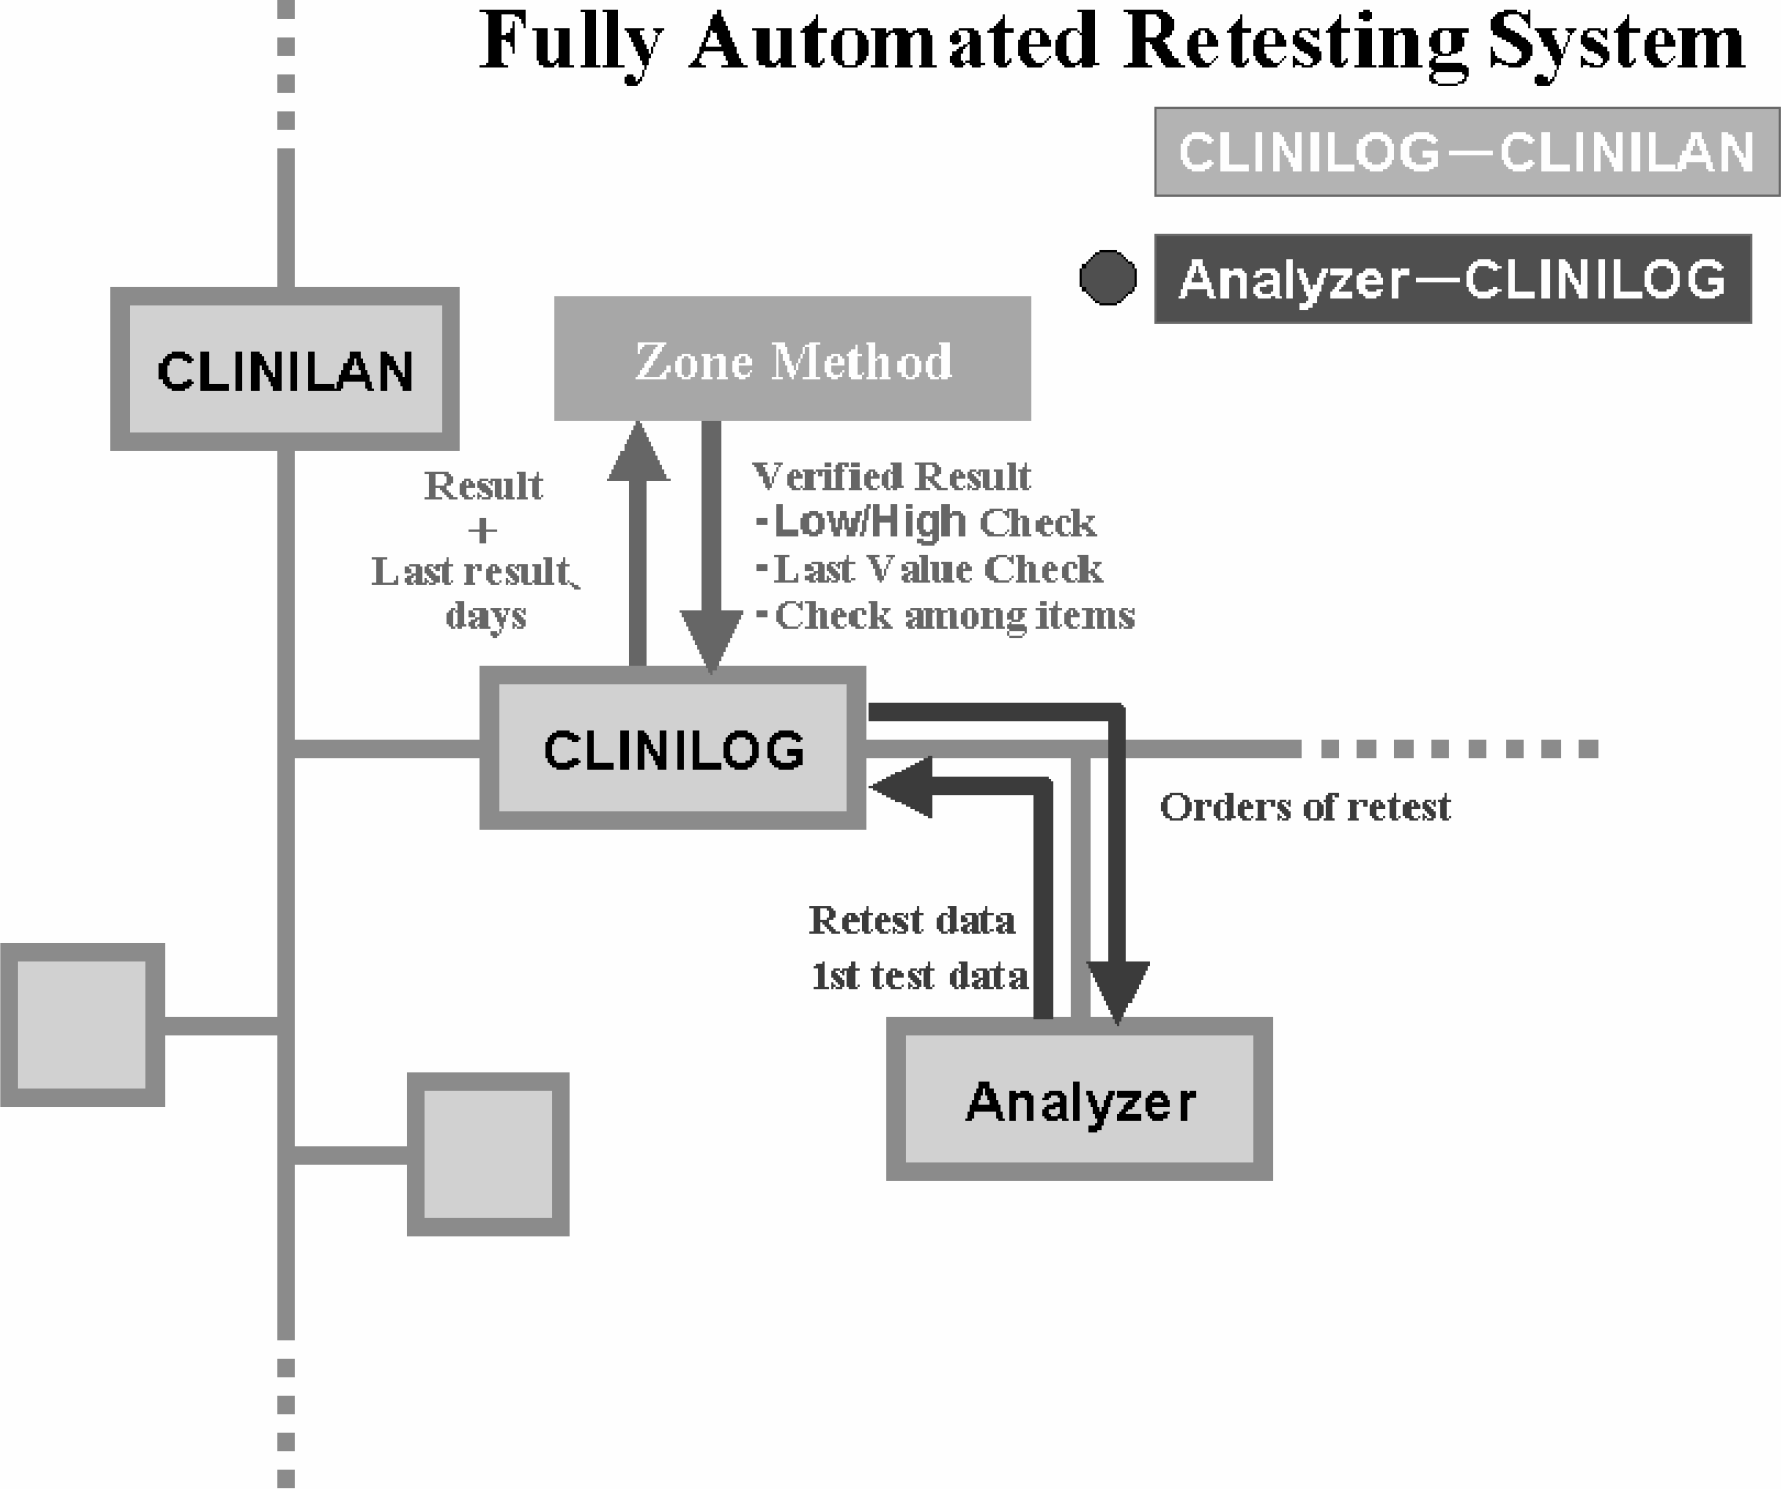
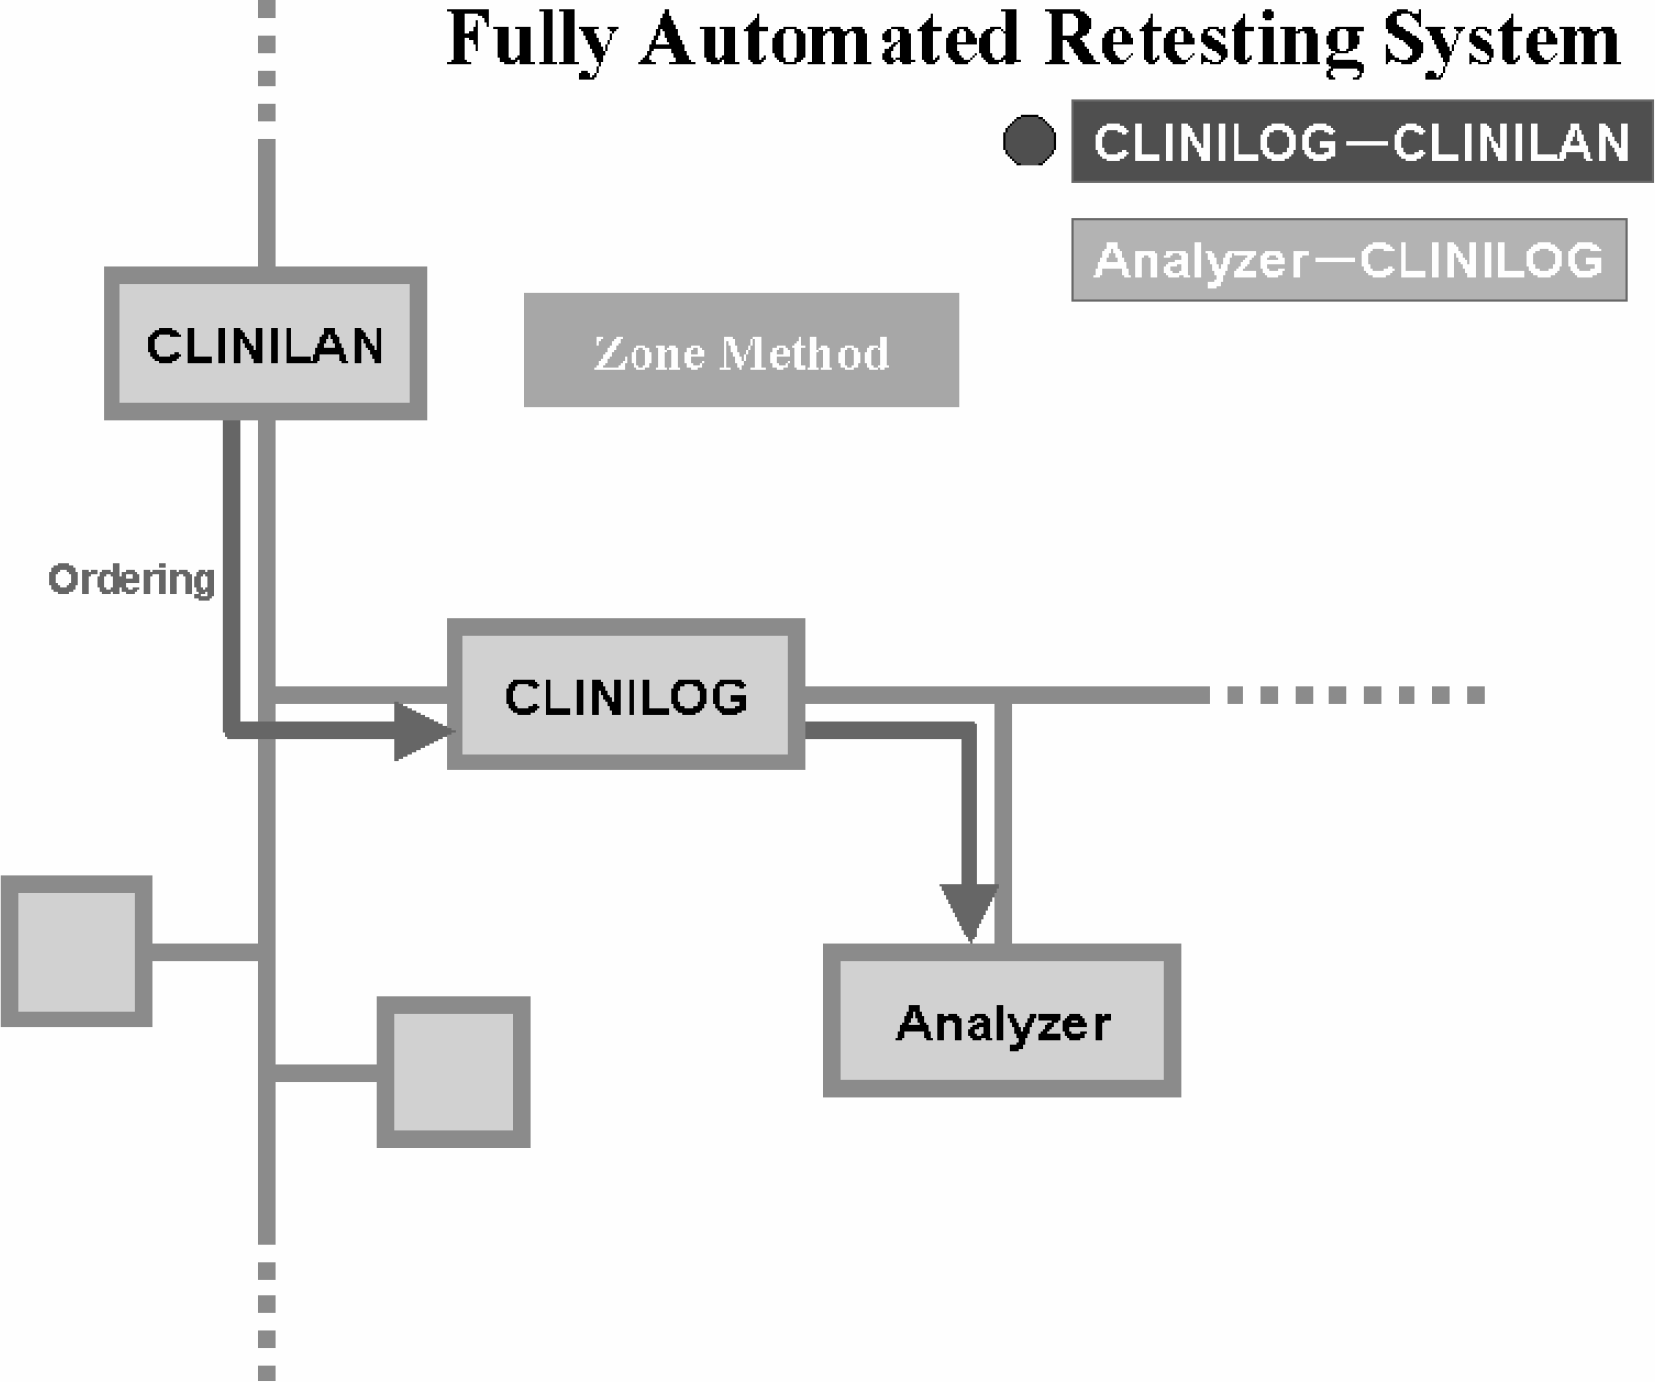
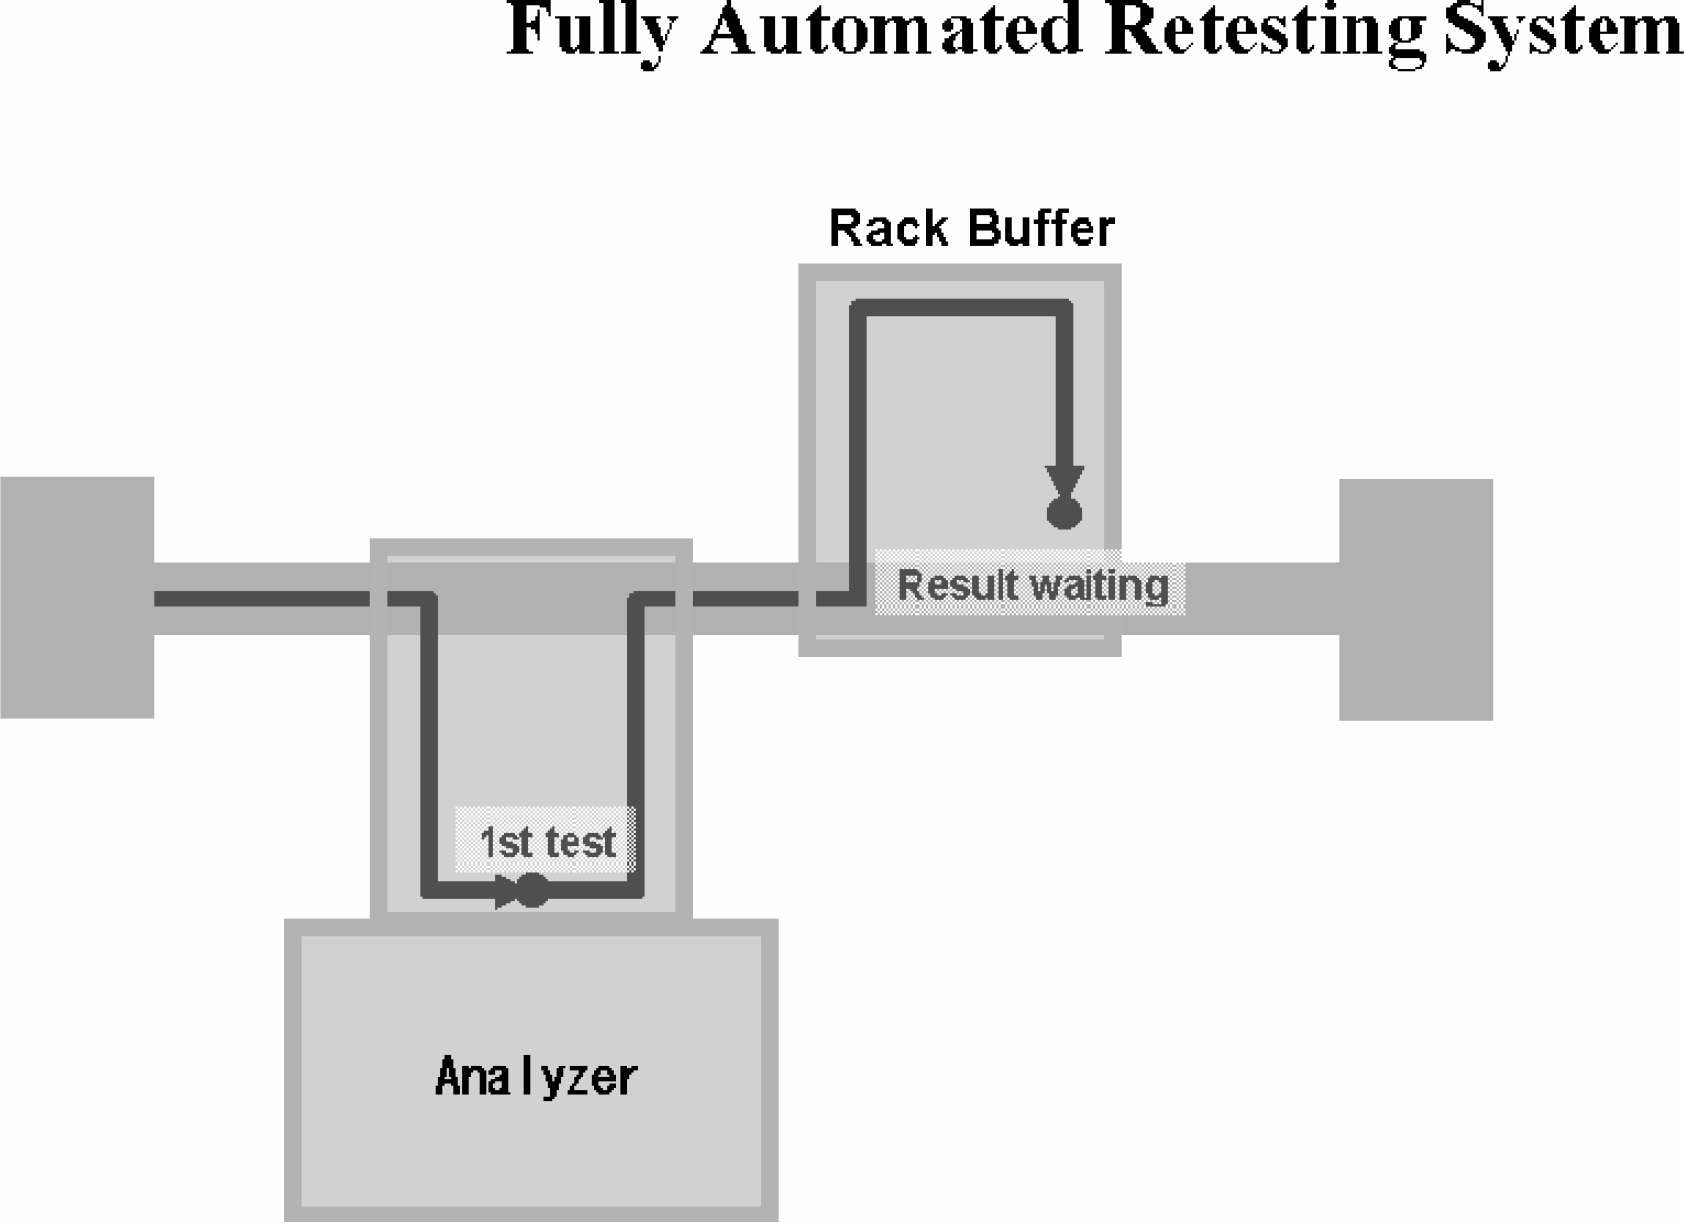
First, CLINILAN, Laboratory Information System, orders analyzers inside CLINILOG to make an analysis (Figure 6). When an analysis is made by orders from LIS, the data is sent back to CLINILOG and the zone verification program inside CLINILOG makes a check on the last values and so on. In case the data are abnormal, CLINILOG itself orders analyzers to re-test. Re-tests are automatically made inside LAS (Figure 7).
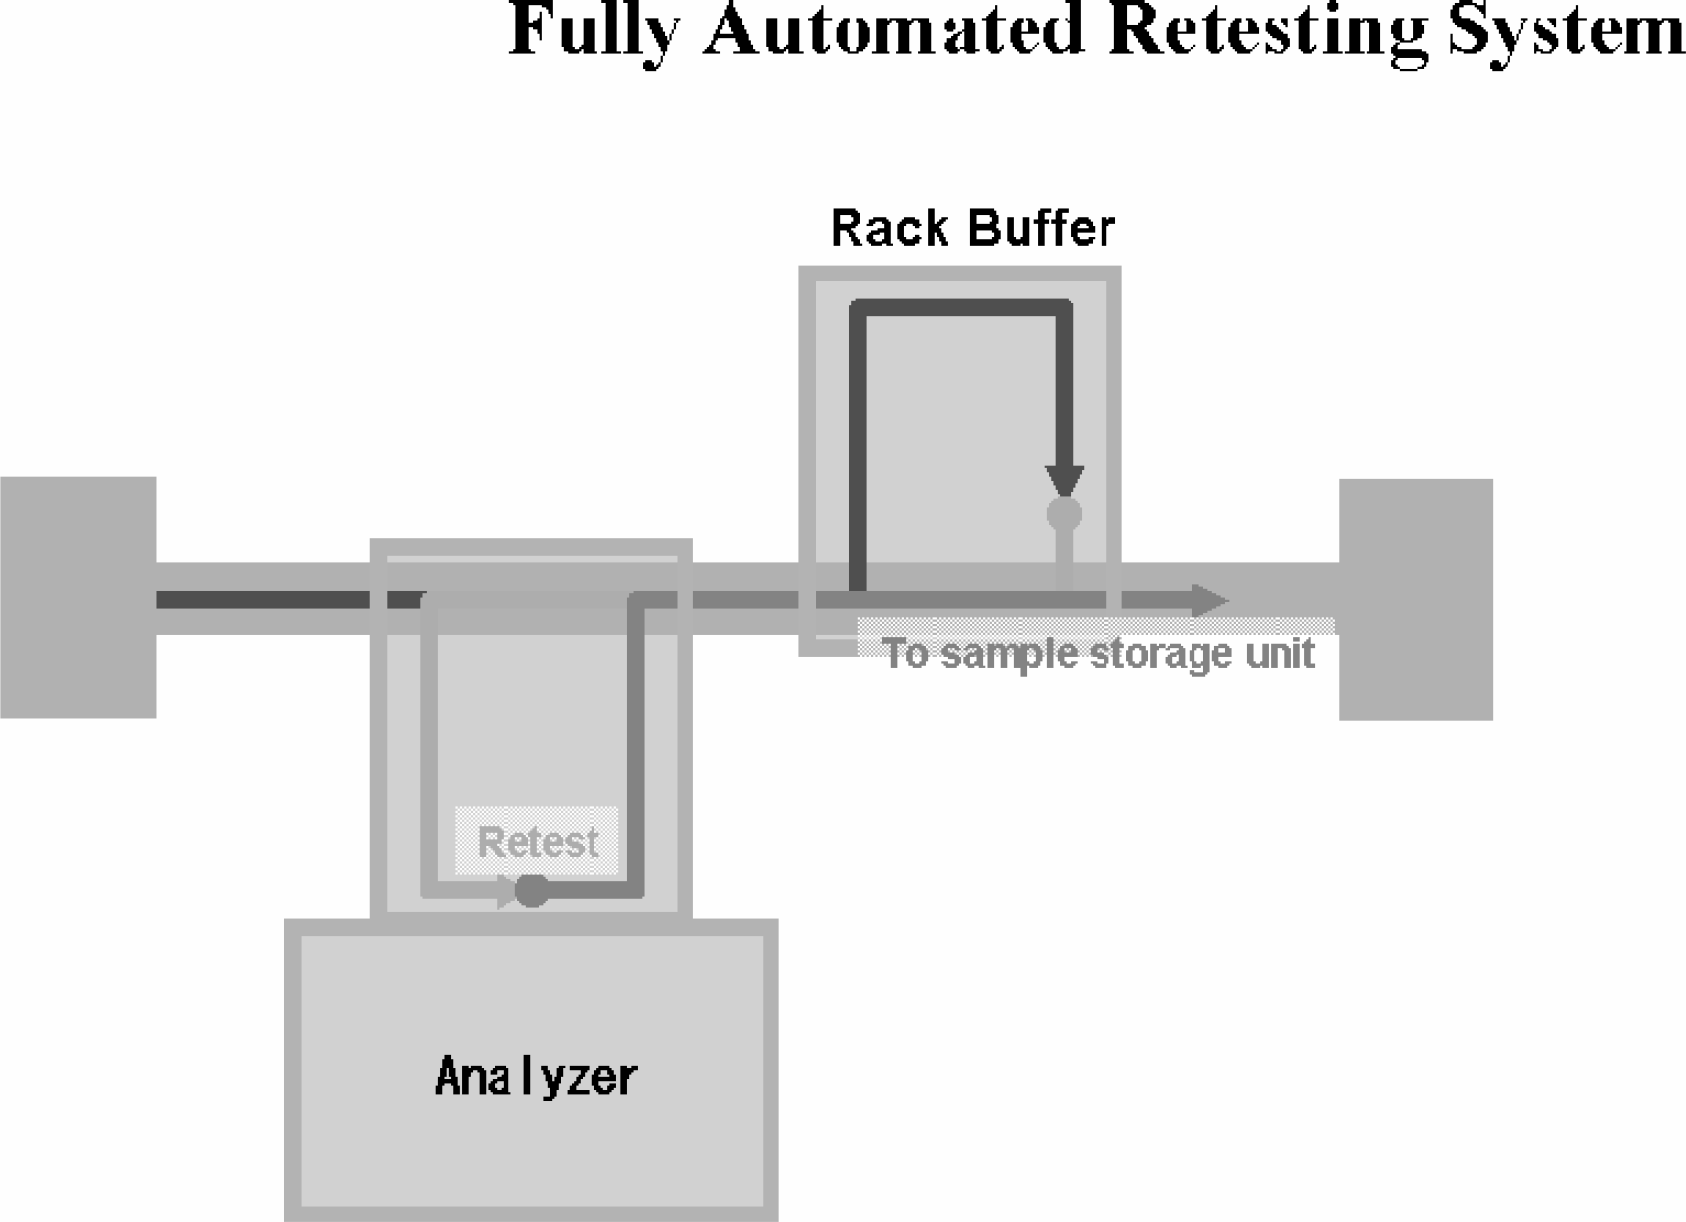
Only clean data can be sent to a higher system after re-tests are automatically run inside LAS. Clean data means the final data. In the zone verification method the first testing data by orders from LIS is not necessarily final data (not decided as final results). So we call the final data after re-testing clean data. These clean data area sent back to LIS through CLINILOG (Figure 8).
One of the systems which supports the fully automated re-testing system is the virtual multi-line method of CLINILOG (Figure 9, Figure 10). This transportation method is essential technology for making a transportation system integrated and compact in size. In the virtual multi-line method many kinds of analyzers are connected to one transportation line, and control transportation in a highly sophisticated way. This is made possible while controlling the transportation system as a whole. Therefore, while monitoring a transportation system as a whole, such as what sample is in the transportation system, where it is, and how analyzers are working now, this method responds to highly intelligent requests, such as when a sample should be sent to the line, what should be measured by what analyzer depending on the first measurement result, and what sample needs to be sent back for re-testing. For example, a rack which carries samples with requests for clinical chemistry and serology drops in at a chemistry analyzer and an immunology analyzer on its way. A rack which carries whole blood samples with requests for hematology drops in at a hematology analyzer, and a rack of samples with requests for coagulation/fibrinolysis drops in at a coagulation/fibrinolysis analyzer on its way. We think one can understand this virtual line has the logical system as if there were some transportation lines. If we took systems like this in the functional level of the conventional transportation system, it would be impossible to make most of the processing capacity of each analyzer due to congestion and confusion of samples on the line. This virtual multi-line method makes it possible to realize the function and processing capacity, which used to need multiple lines, by one transportation line. Therefore, it is very beneficial in terms of both costs and space. Furthermore, it has the advantage of reducing the amount of one sample as we can measure a lot of items by one sample without aliquoting.
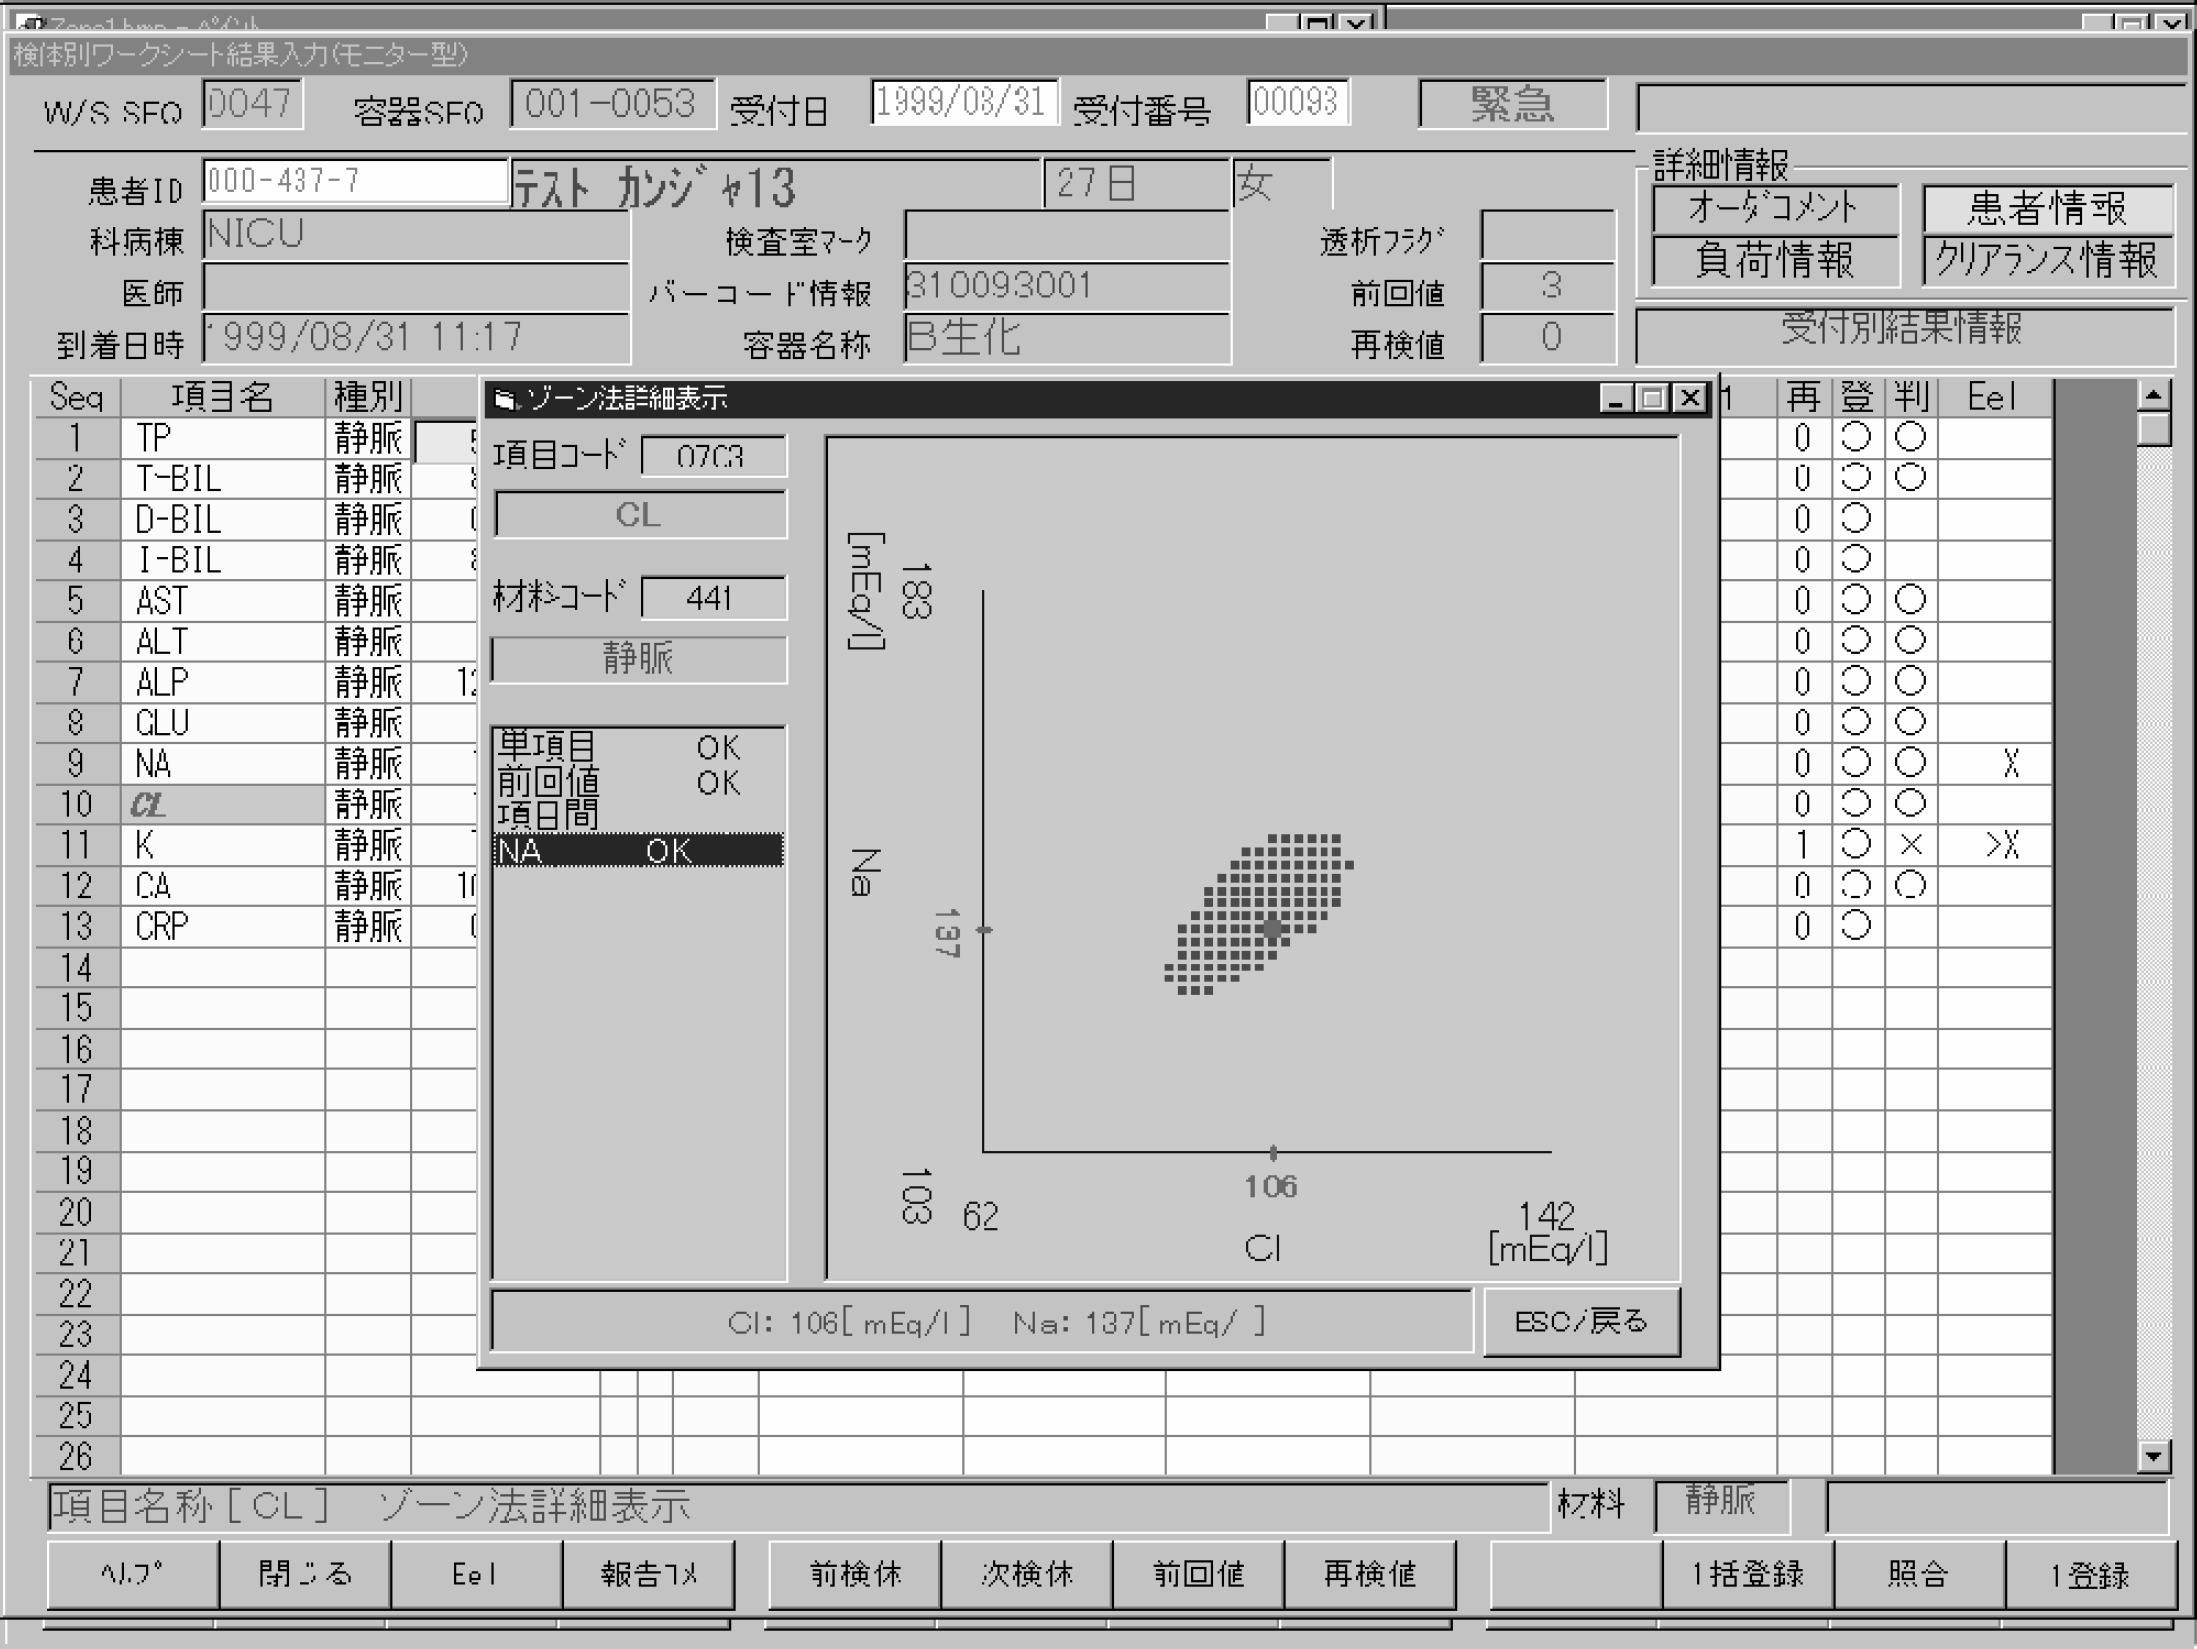
In the actual operation you can see results on the online monitor. The online monitor checks data of analyzers on-line in real time. In case abnormal data arise, the testing data which were requested and displayed by clicking. If an item which was requested is appointed by the zone verification method, the testing data is displayed with a zone by clicking an assessment of the item. You can see graphically what type of abnormal data it is. By making computers play this part, it becomes possible to construct an automated re-testing system. The screen (Figure 11), displays a testing result of Cl and a zone which shows a correlation between the last value and this value. The latest testing result is plotted by a red dot.
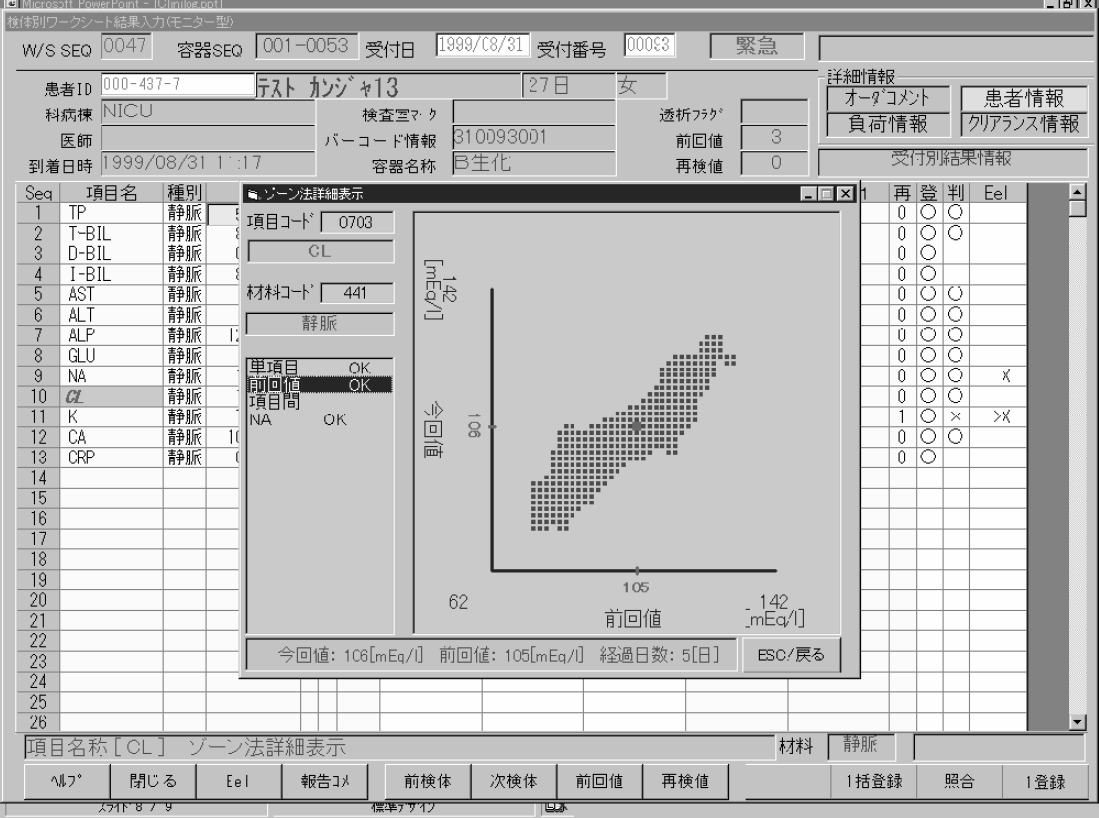
Figure 12 is also the online monitor screen. Figure 11 showed a testing result of Cl (the last value and this value). This one shows a correlation between Na and Cl. Likewise, a red dot of this testing result is plotted, and is included within a range of a zone.
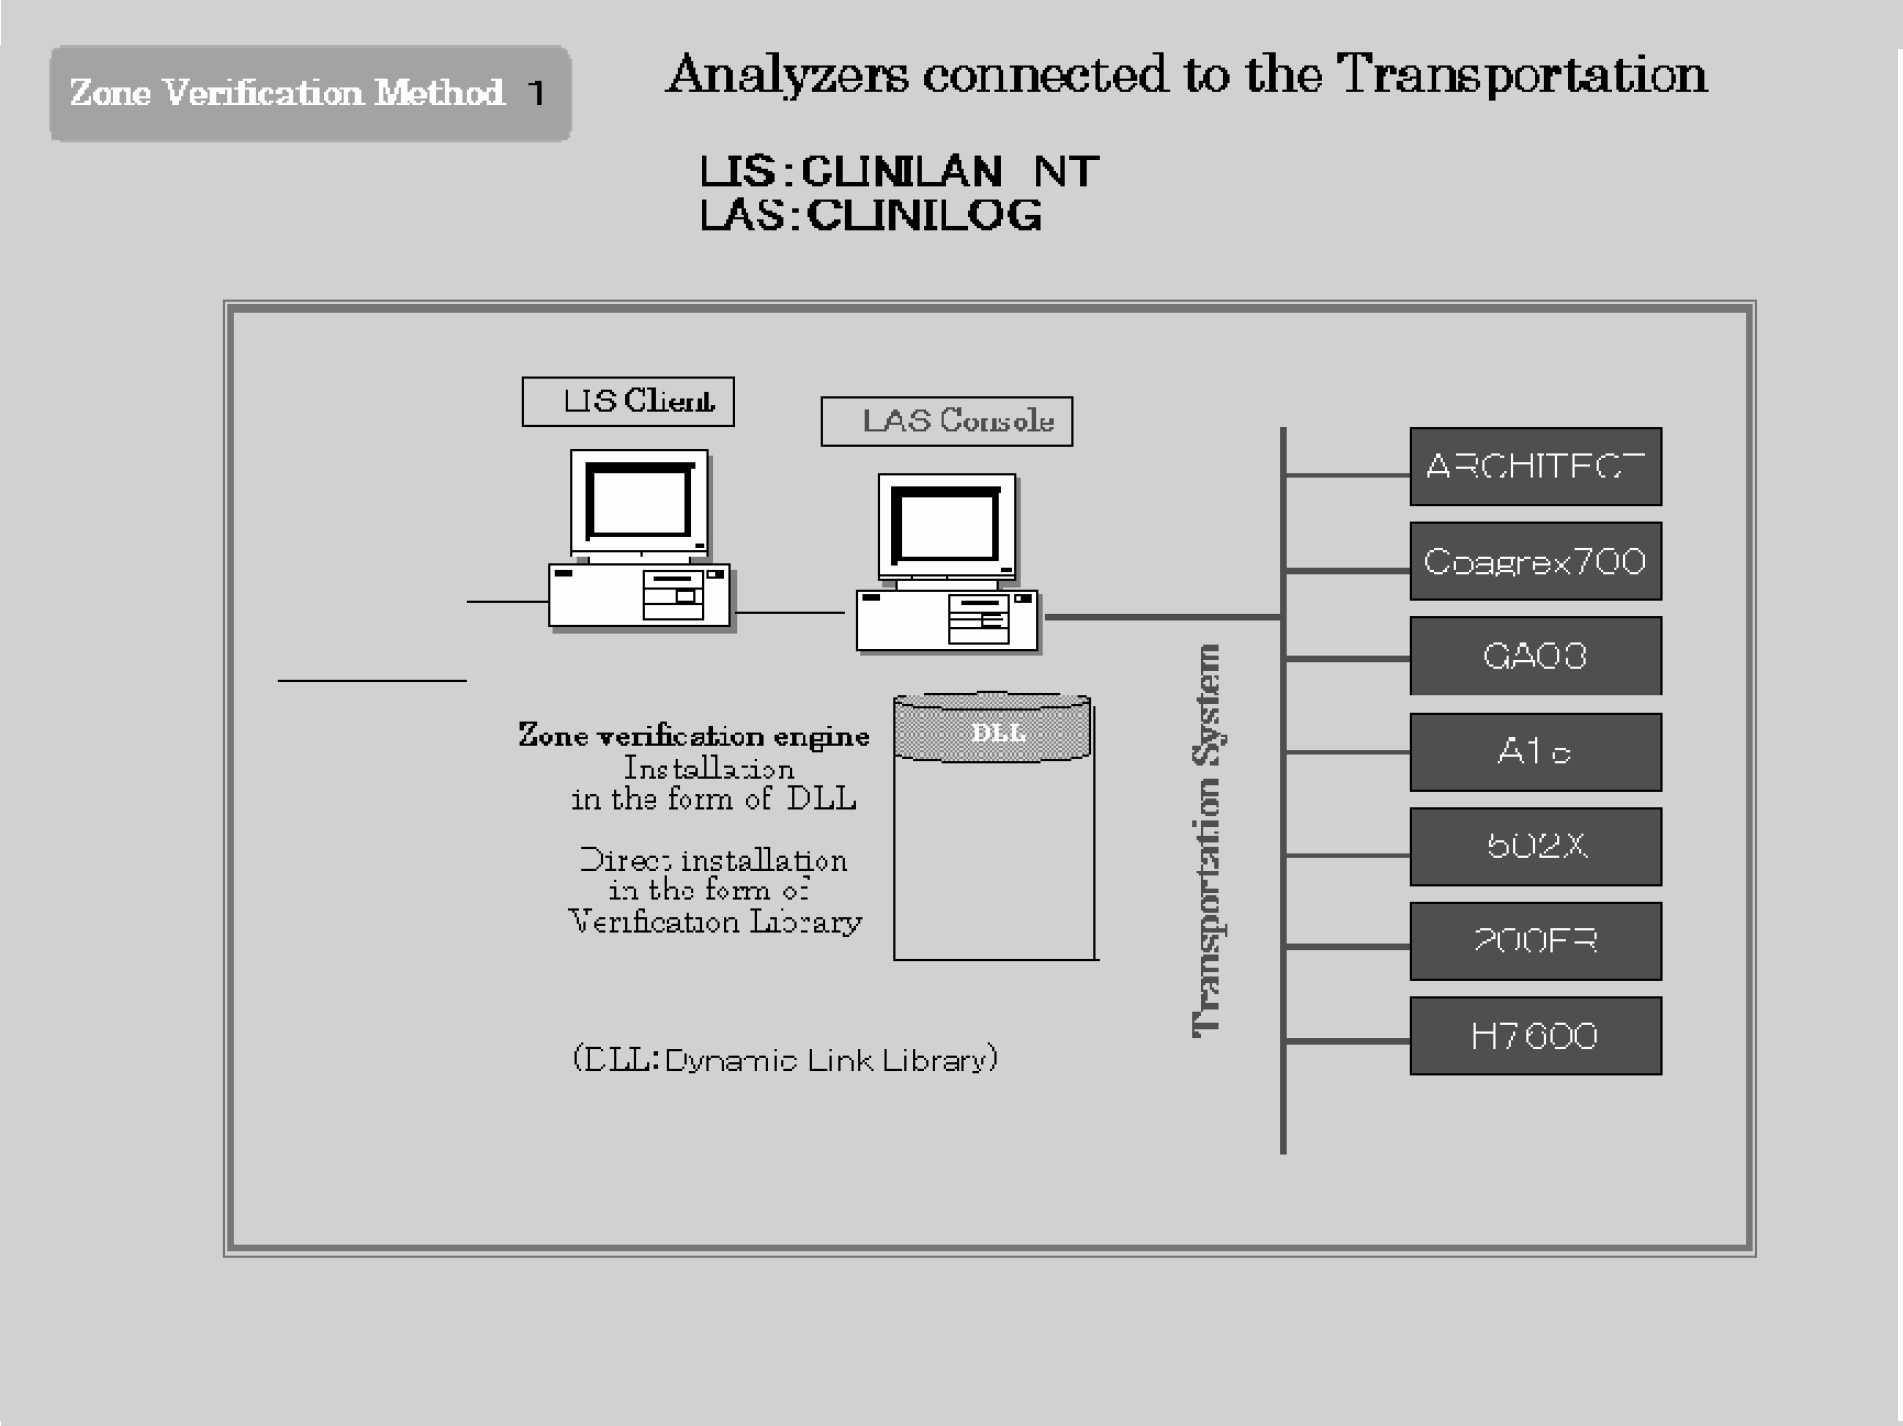
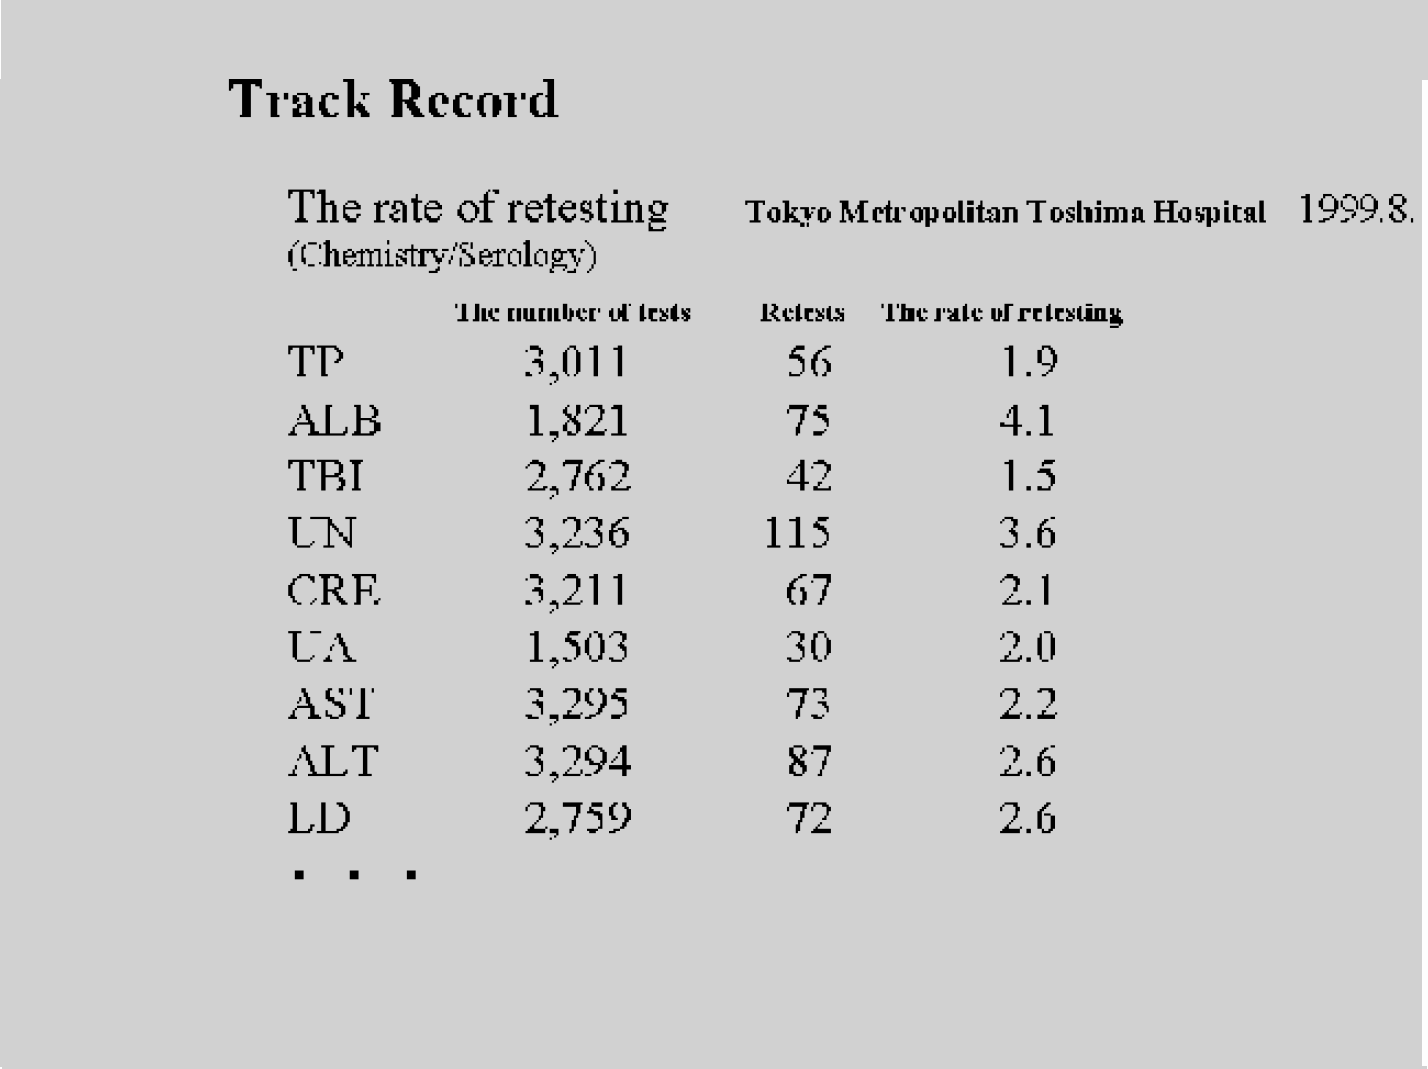
In an example which adopted the zone verification method (Figure 13), CLINILAN NT is used as Laboratory Information System and Windows NT is used in CLINILOG, Laboratory Automation System. The function of the zone verification method is built into both LIS and LAS. LIS Client is set up in each testing section, such as clinical chemistry, hematology, immunology, and general. One LAS console has control over the whole LAS. A group of functions and data which are processed in common by more than one software is called Library. To use this on-the-fly is DLL (Dynamic Link Library). This is a common system with Windows. Data verification by the zone verification method is equipped as DLL. Tokyo Metropolitan Toshima Hospital which installed the zone verification method has achieved the low re-testing rate as is shown in Figure 14.
POTENTIALITIES
When we plot the testing results of patients in each department, for instance, with creatinine and White Blood Cell (WBC), different zones are plotted as to each department (Figure 15, Figure 16).
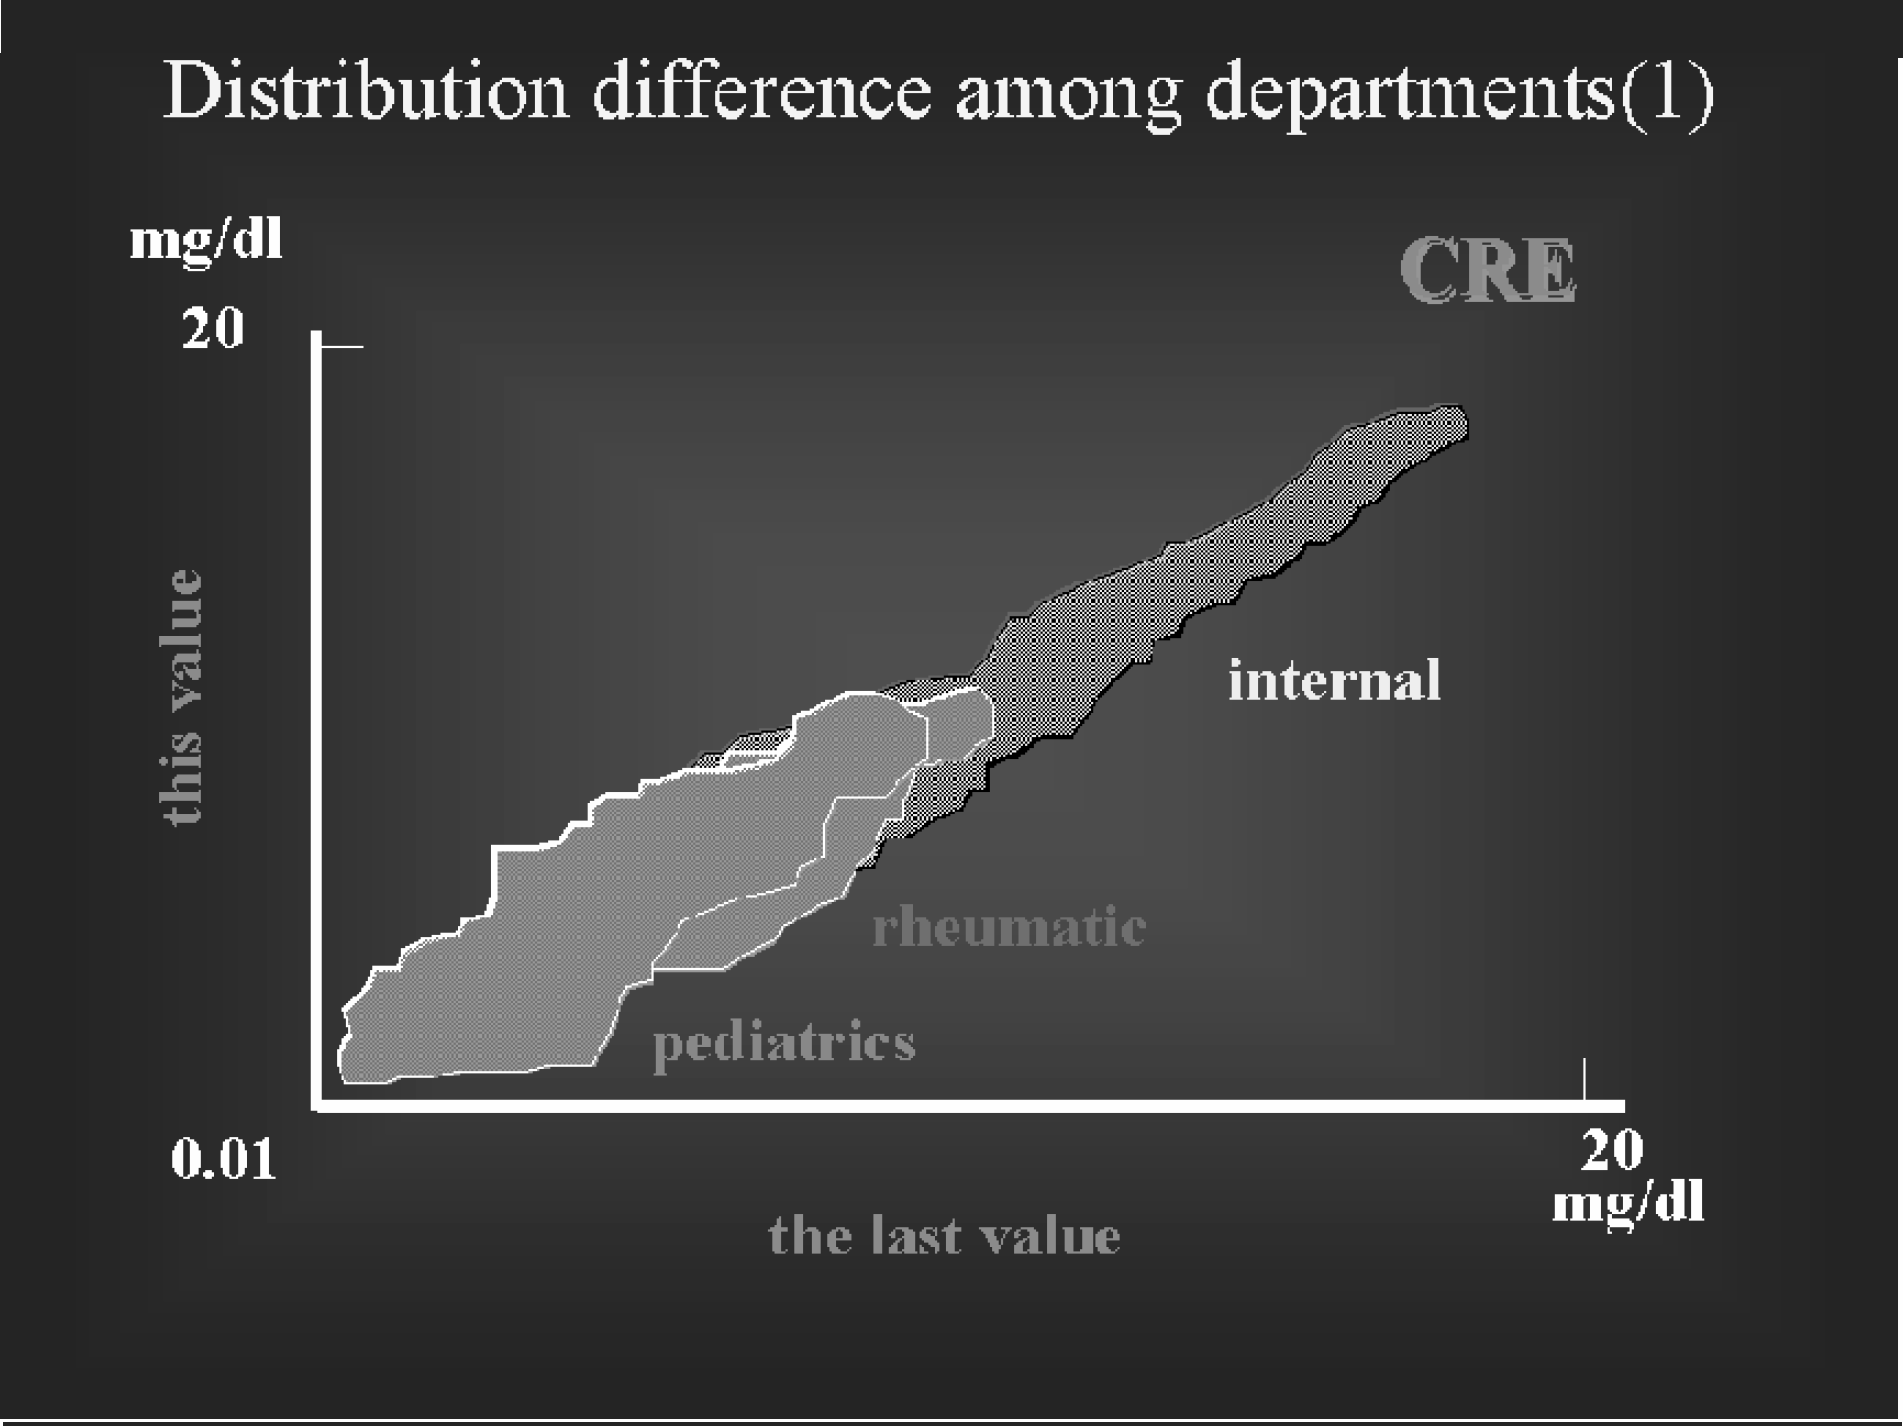
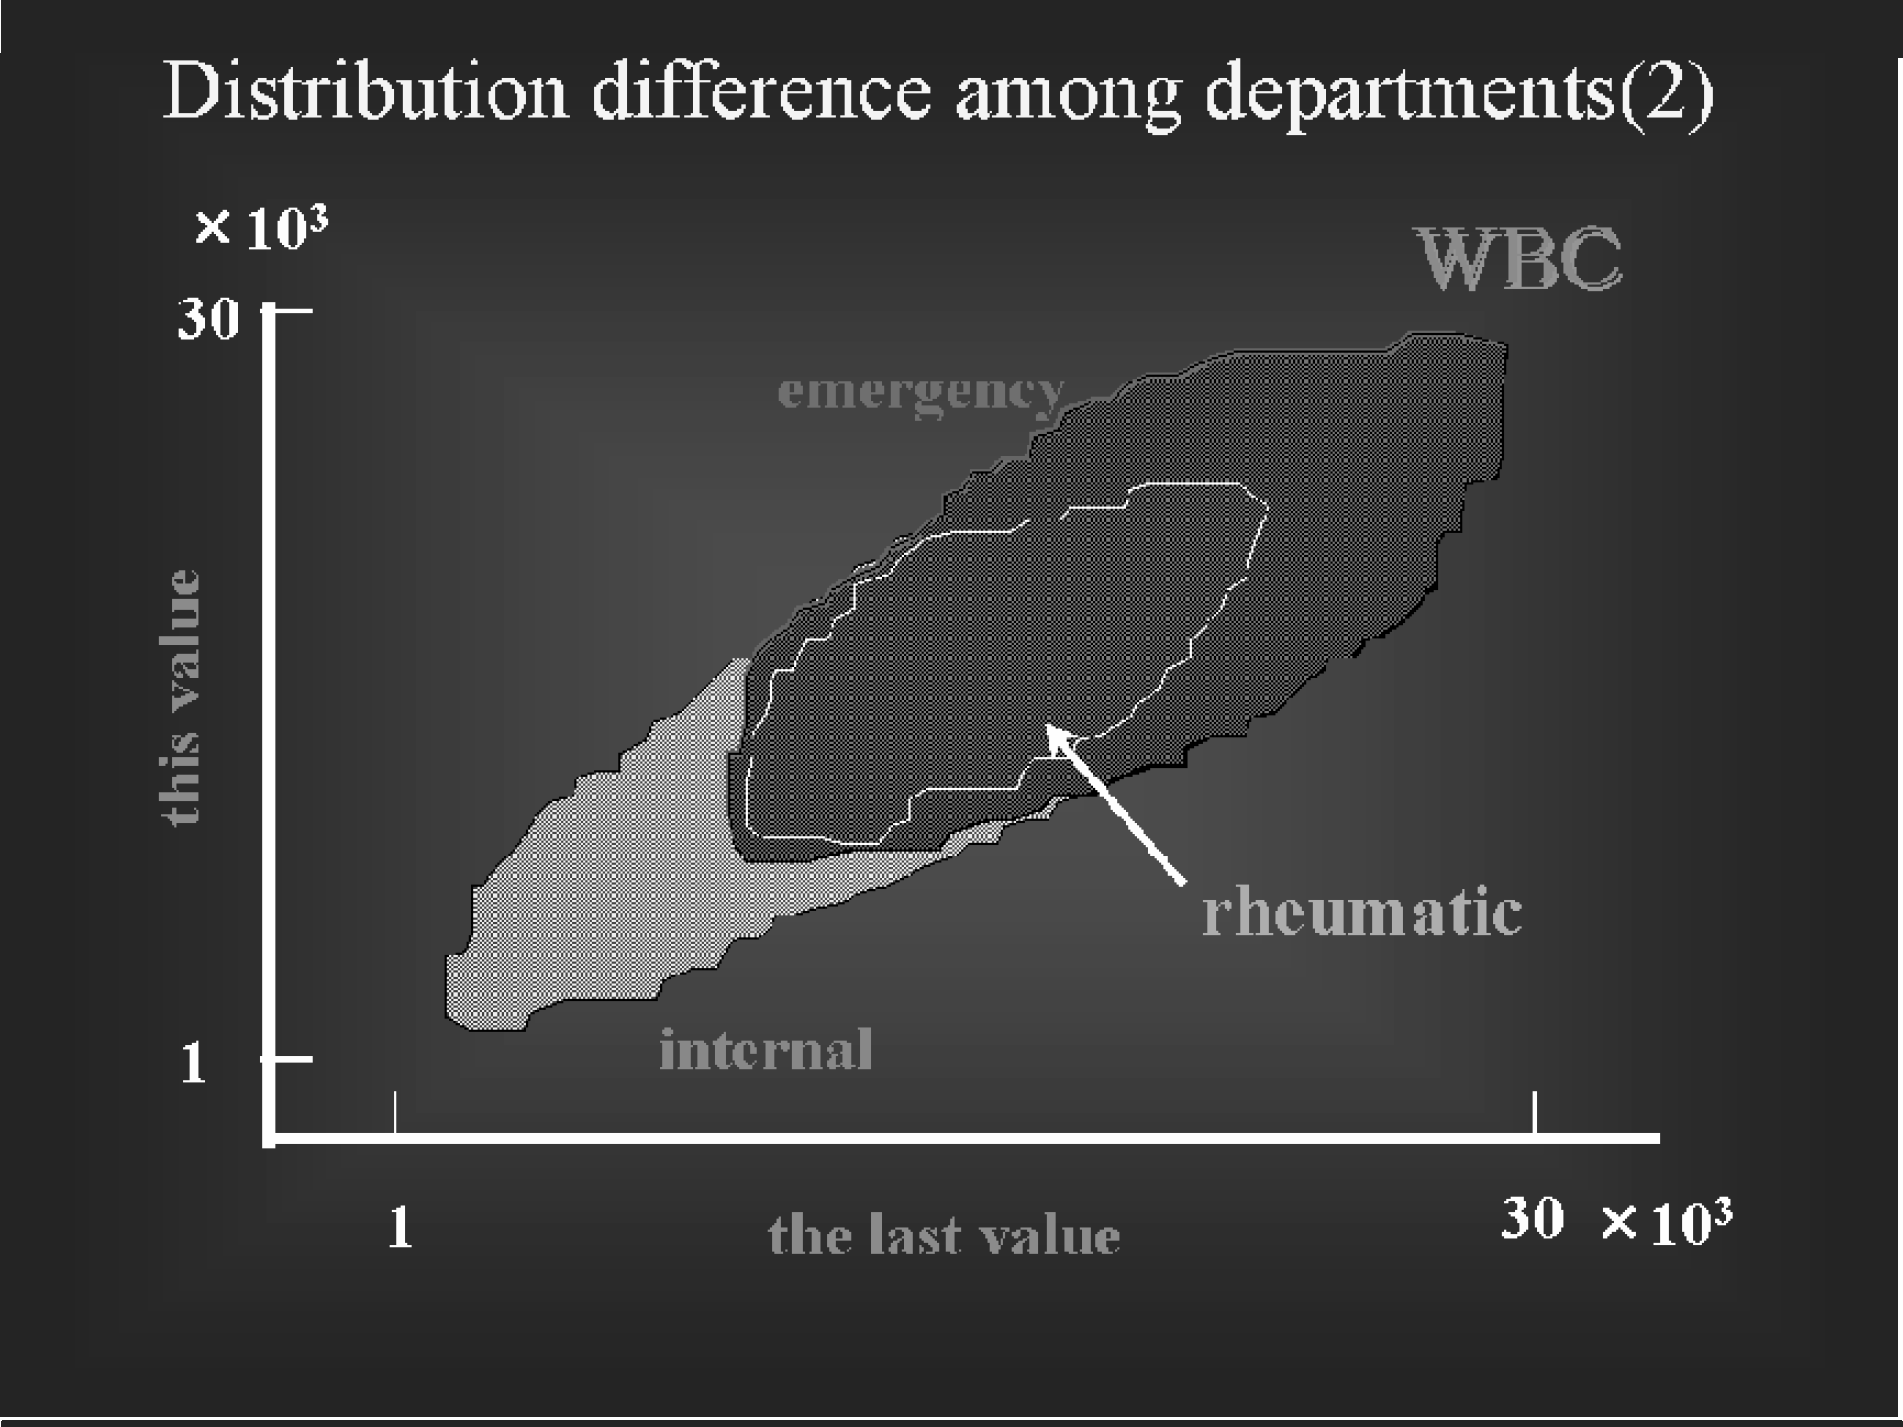
By these zones we can see that it is strange for a dot of a testing result of a patient in a department to be here. We can suspect testing errors and mistaking samples in case of abnormal values. The name of a department is data which clinical laboratories always have, therefore more detailed verification is possible by that. Furthermore, as departments mean differences of diseases, there may be potential for diagnosis-support for the future.
It is very difficult for even experienced doctors to always diagnose without prejudice. To think about matters not on the basis of intuition but Evidence Based Medicine (EBM) has become common. A testing result is a fact. Although a correlation between testing results and diseases, examination data are not necessarily clear at present, the large amount of testing data in clinical laboratories seems like treasure. If we get something significant by analyzing a correlation between testing results and diseases, examination records through the zone verification method on the basis of patients' medical records and dosing records, we think we can call it evidence in EBM. If we could make sure of the correlation and make good use of it, construction of a practical diagnosis-support system becomes possible. Thus, the zone verification method can be a tool which has potential for EBM and diagnosis-support.