Abstract
Microfluidic flow conditions allow the design of highly effective, yet simple devices for on-chip sample preparation and cleanup. Over the past few years, Micronics has developed a number of novel microfluidic structures that are compatible with complex samples such as whole blood or contaminated environmental fluids. The H-Filter is a technology based on the parallel laminar flow of two or more miscible streams in contact with each other. Such streams do not mix, but chemicals contained in these streams can diffuse from one stream into the other, with smaller molecules diffusing faster than larger ones. This principle can be used, for example, to remove salt from a solution containing DNA, or to extract smaller molecules from whole blood. The T-Sensor is based on the same laminar flow diffusion principle, but combines sample preparation with self-calibration and detection. These devices can be used not only in stand-alone research and point-of-use testing applications, but they can also be integrated, as sample preparation modules, into existing laboratory systems.
INTRODUCTION
Over the last 5 years, a variety of microfluidics-based total analysis systems (μTAS) have been presented, with the promise of enabling miniaturization, faster response times, and simplification of analysis procedures. These devices, as developed in various research groups, and now beginning to be commercialized (e.g., by Caliper Technologies and Orchid Biosciences), generally consist of a small microfluidic chip, surrounded by a substantial, typically desk-top-sized analysis instrument [1–5]. While further integration of electronic and fluidic components may allow additional miniaturization, we believe that more substantial miniaturization, automation, and cost reduction can result from utilizing some of the inherent properties of microfluidics.
One avenue for further miniaturization and integration of μTAS elements is to eliminate as many power-consuming and otherwise complex elements of existing analysis instruments as possible, and replace them with passive components that operate on power sources such as gravity, air pressure, absorption, capillary forces, or simple manual actions.
In this paper, we present examples of such microfluidic functional elements, including mixers, separators, and detectors, as well as complete microfluidic devices that function entirely without any moving parts or external power sources. These devices lend themselves to applications such as ultra-low-cost disposable qualitative and semi-quantitative medical and environmental assays for home, office and field use, and for sample or reagent preparation tools that provide processed liquids for downstream analysis or synthesis.
MICROFLUIDIC DEVICES
One such device is a hydrostatic-pressure-driven disposable microfluidic detector card, based on the T-Sensor (diffusion-based detection) method [2,5,6–13] (Figure 1) that combines the ease of use of a paper test strip with the versatility of a microfluidic system.
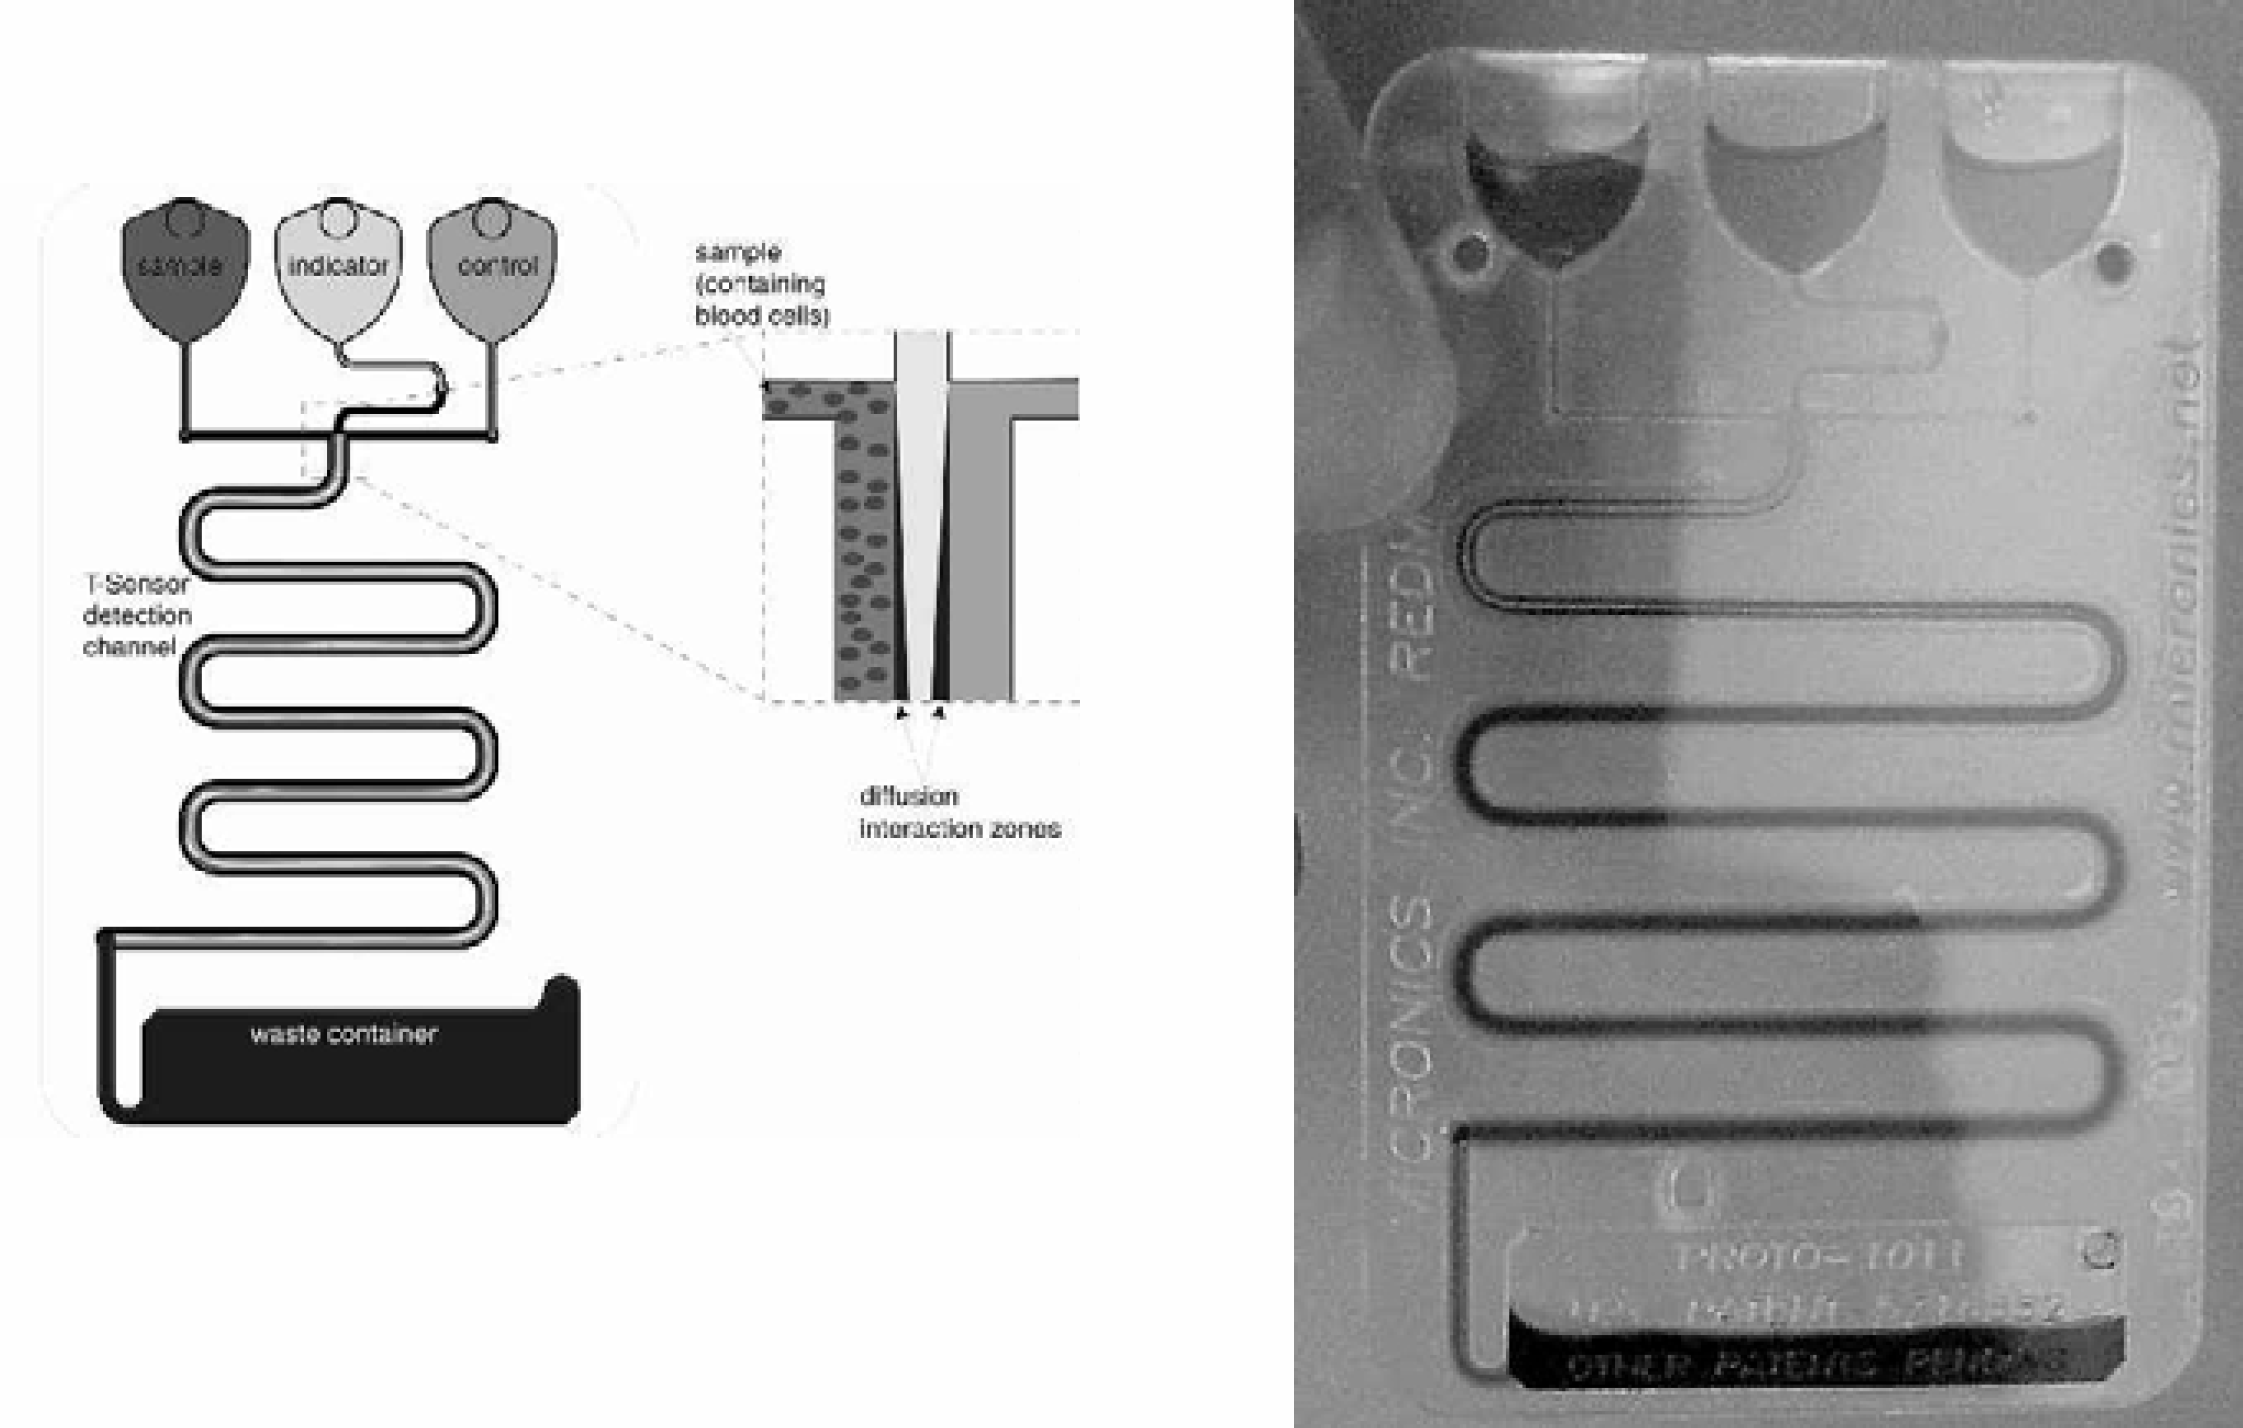
Hydrostatically driven integrated T-Sensor design. A sample is put into the top left reservoir, a reagent (e.g. an indicator dye) is put into the top middle reservoir, and a reference solution with a known concentration of analyte is put into the right reservoir. The comparison of the intensity and position of the two diffusion interaction zones allows a semi-quantitative analyte determination. The photograph on the right shows such a T-Sensor in operation as it determines the pH of a buffer solution.
Another passive device (Figure 2) can separate chemical compounds by their diffusion coefficients (based on the H-Filter method [7,9,12]) and produce several microliters of cleaned-up sample in one minute for further processing. Such a device requires no power or moving parts and can be used as a simple and cheap replacement for a centrifuge.
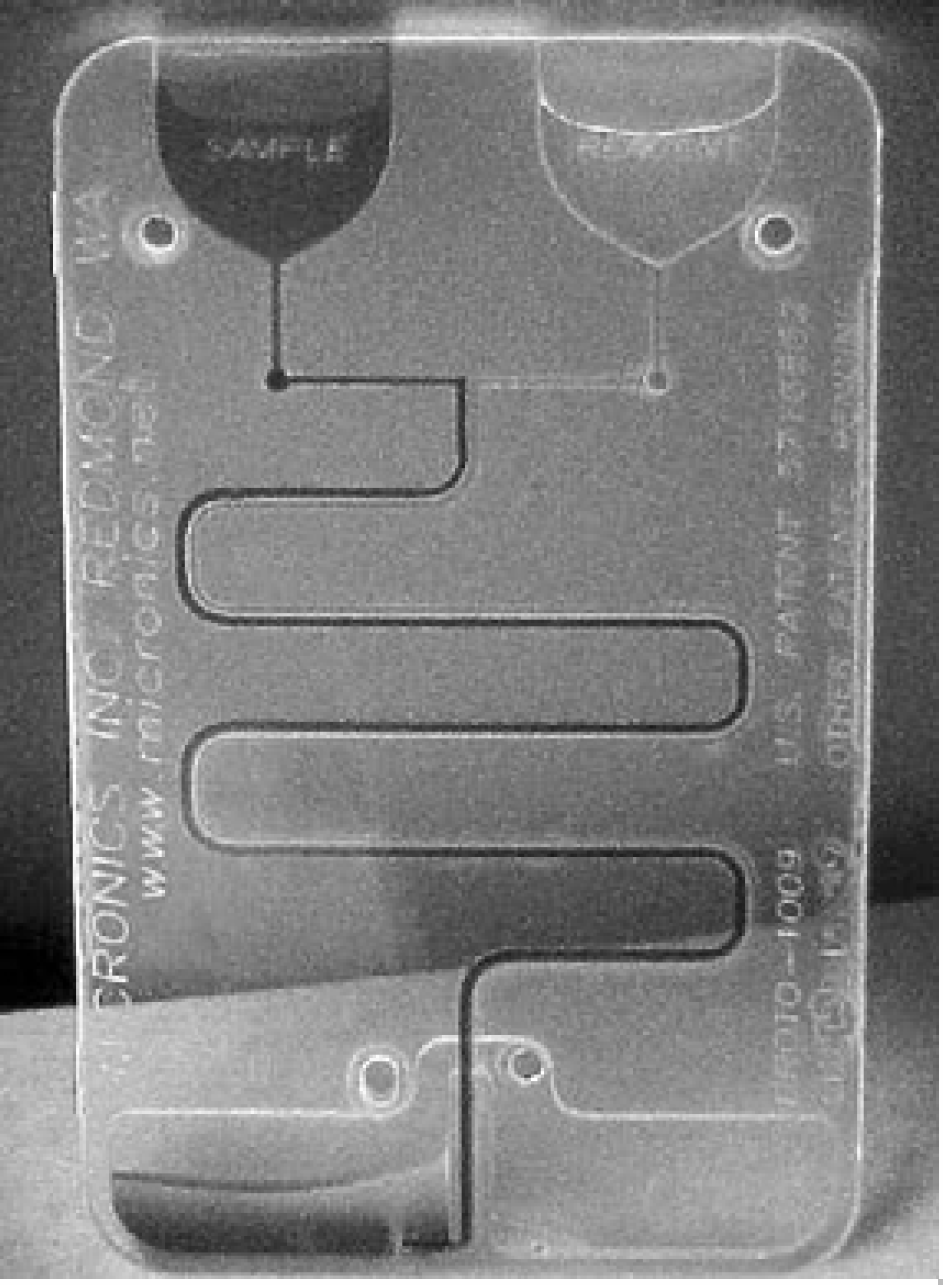
Hydrostatic pressure driven integrated H-Filter design; the figure shows an H-Filter experiment in progress (illuminated with a UV lamp). A sample (e.g., blood) is put into the top left reservoir, and an acceptor reagent (e.g. water or saline) is put into the top right reservoir. Two parallel laminar streams will flow. Smaller components of the sample stream will diffuse into the acceptor stream. The two parallel flows are then split up into two separate reservoirs (at the bottom of the drawing) that are connected only through a common vent. The left reservoir then contains the sample solution with a reduced concentration of the extracted component, and the right reservoir contains the acceptor reagent containing the extracted reagent. Both reservoirs can then be harvested from the cartridge for further use, or be processed through further integrated microfluidic structures.
The two devices discussed above are both driven by hydrostatic pressure. We have also developed devices based on alternative passive driving methods, such as absorption and capillary force. Figure 3 shows a T-Sensor with a built-in absorbing pad that acts as both a fluid driver and a containment cell for waste.
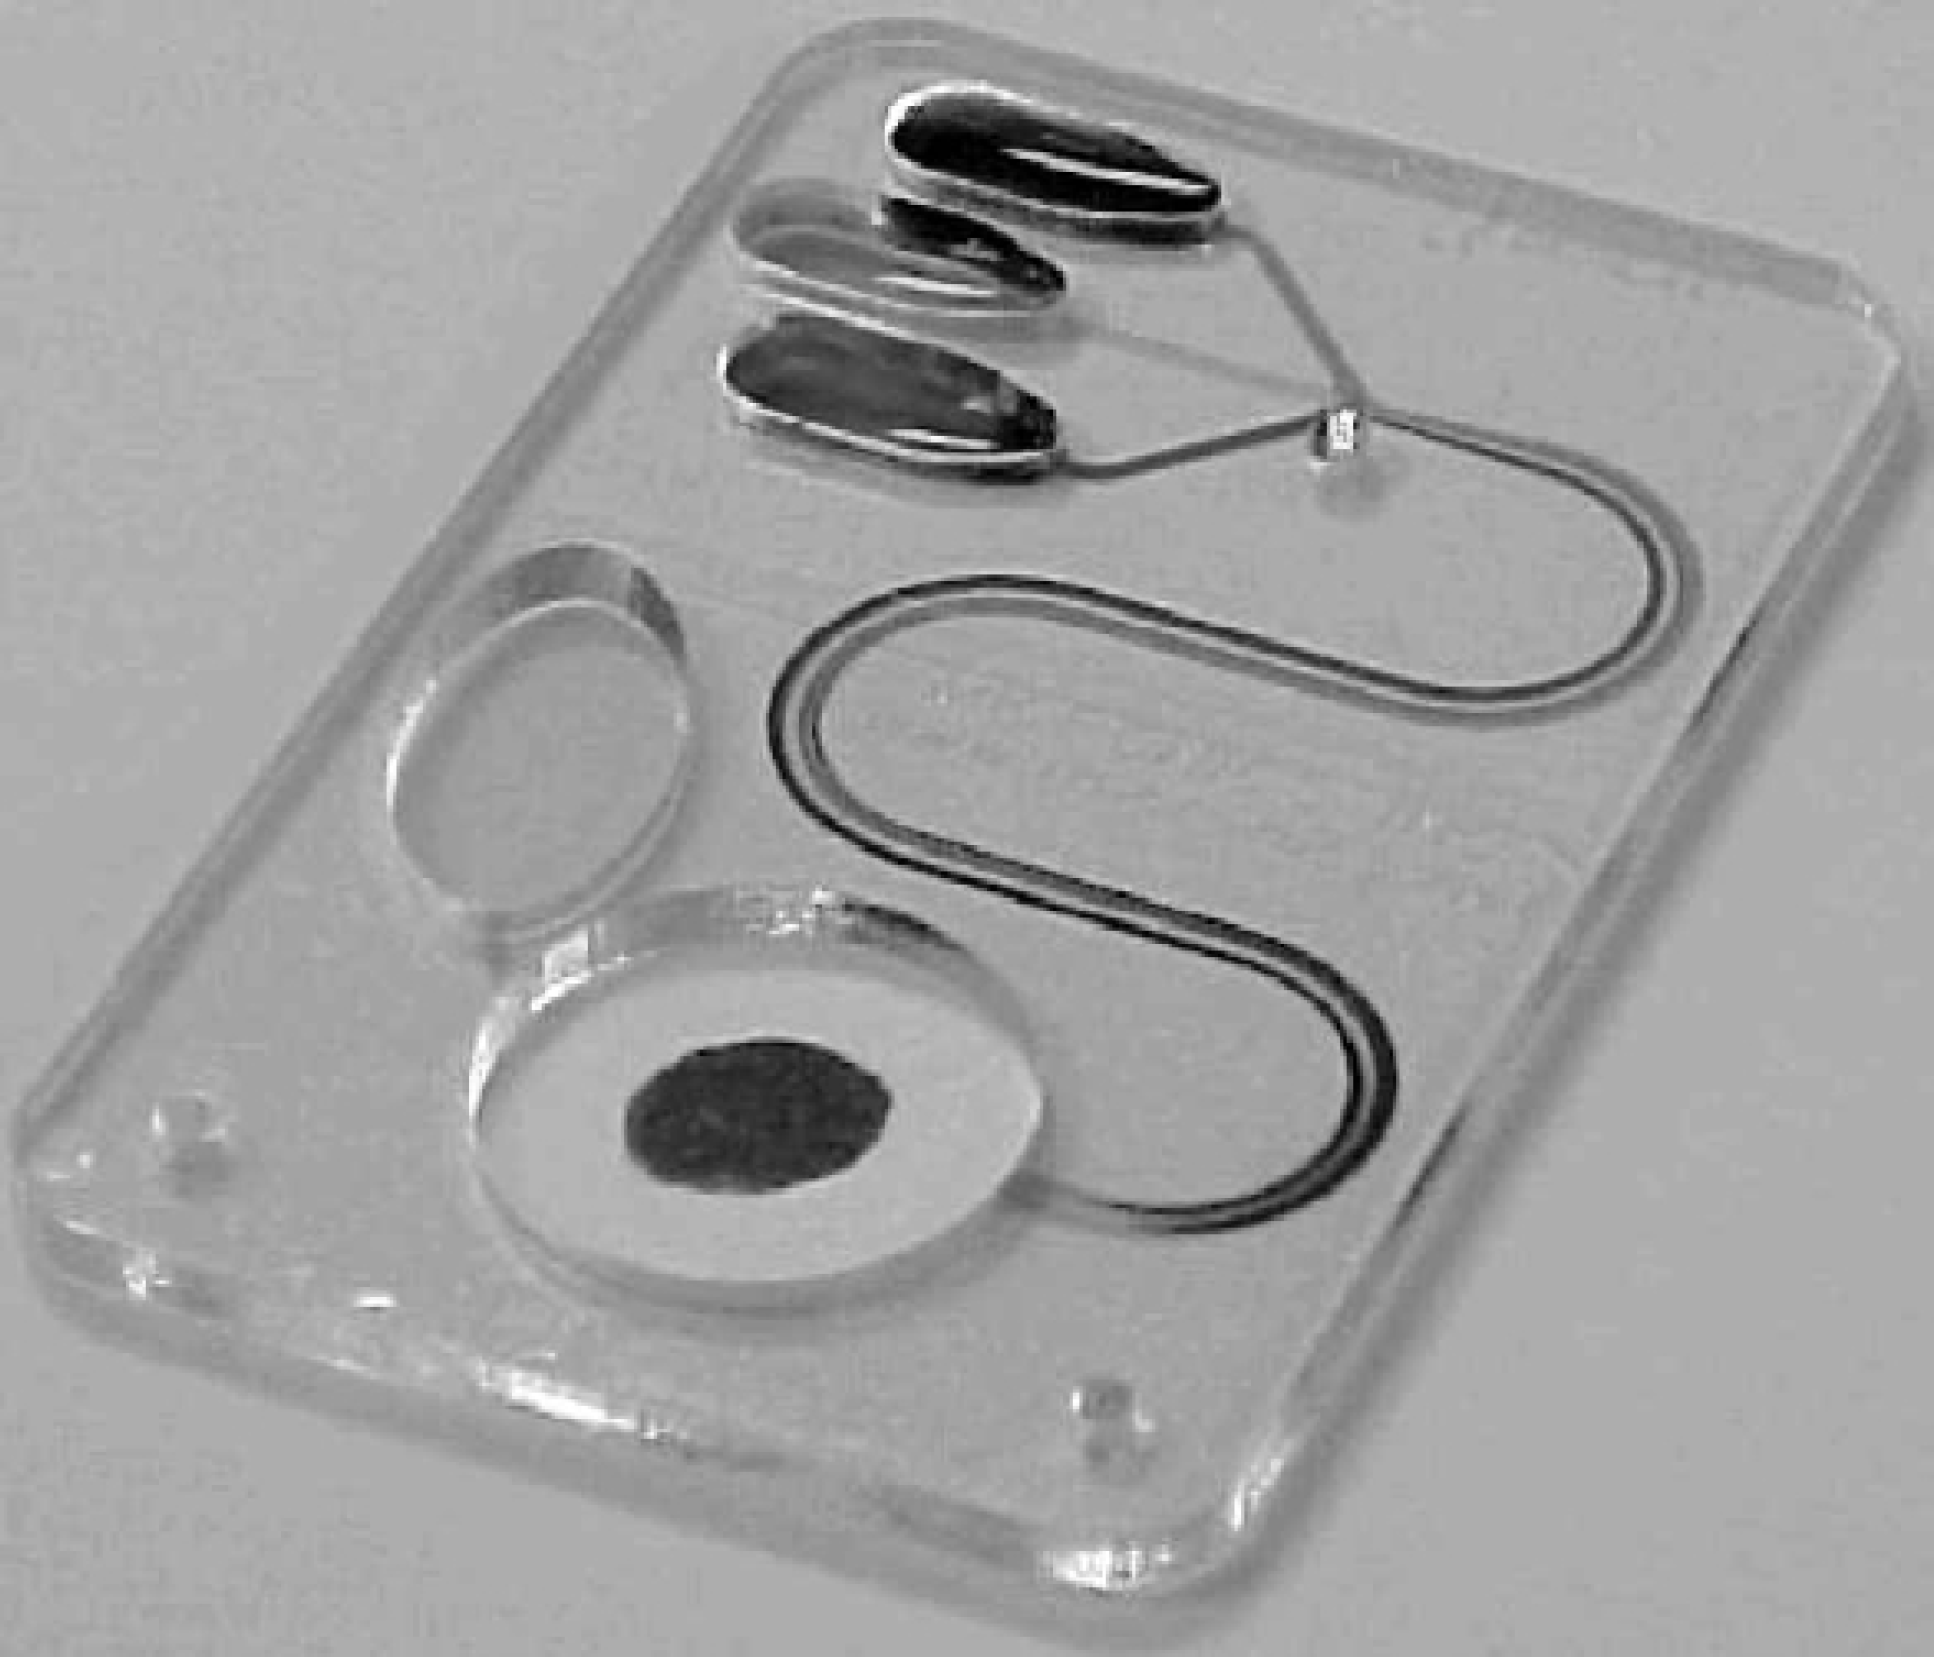
Absorption driven integrated T-Sensor design; the fluid is initially aspirated using capillary action, and then flow-controlled by the absorption pad.
We have also developed a novel microfluidic check valve design that allows the design of complex, yet fully passive, multi-step analysis cards. Figure 4 shows the design (far left) and the use of these valves in an integrated microfluidic circuit (left).
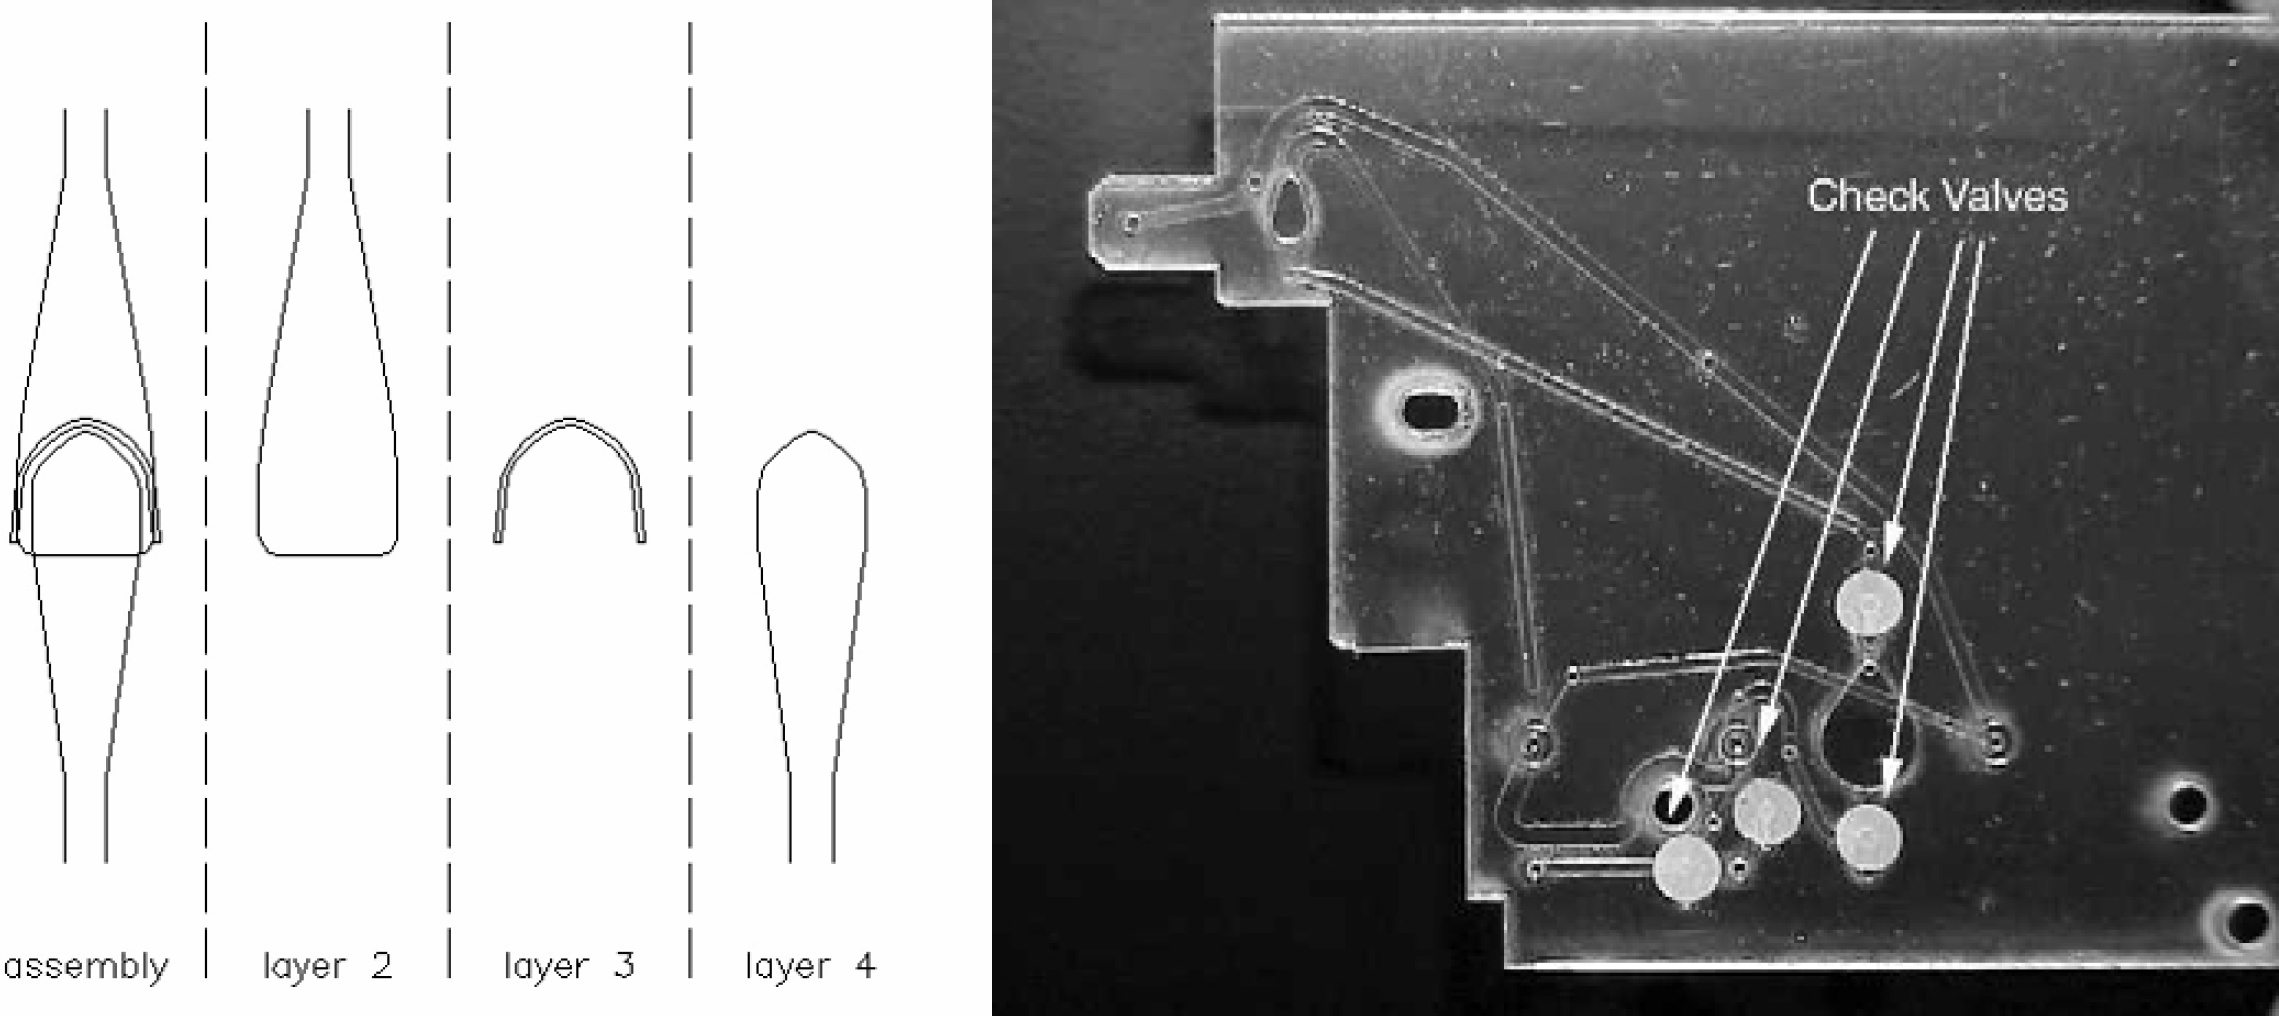
Microfluidic check valve design (left) and its use in a disposable cartridge (right).
As an example of how our devices can interface with a machine-controlled analysis system, we have developed a hematology cartridge that is designed to determine red cell and platelet counts, hemoglobin concentration, a white cell differential count, and various other derived parameters (see Figure 5). For this card, a number of sample processing issues had to be resolved. This cartridge contains a variety of sample preprocessing structures, including mixers, diluters and chemical reactors.
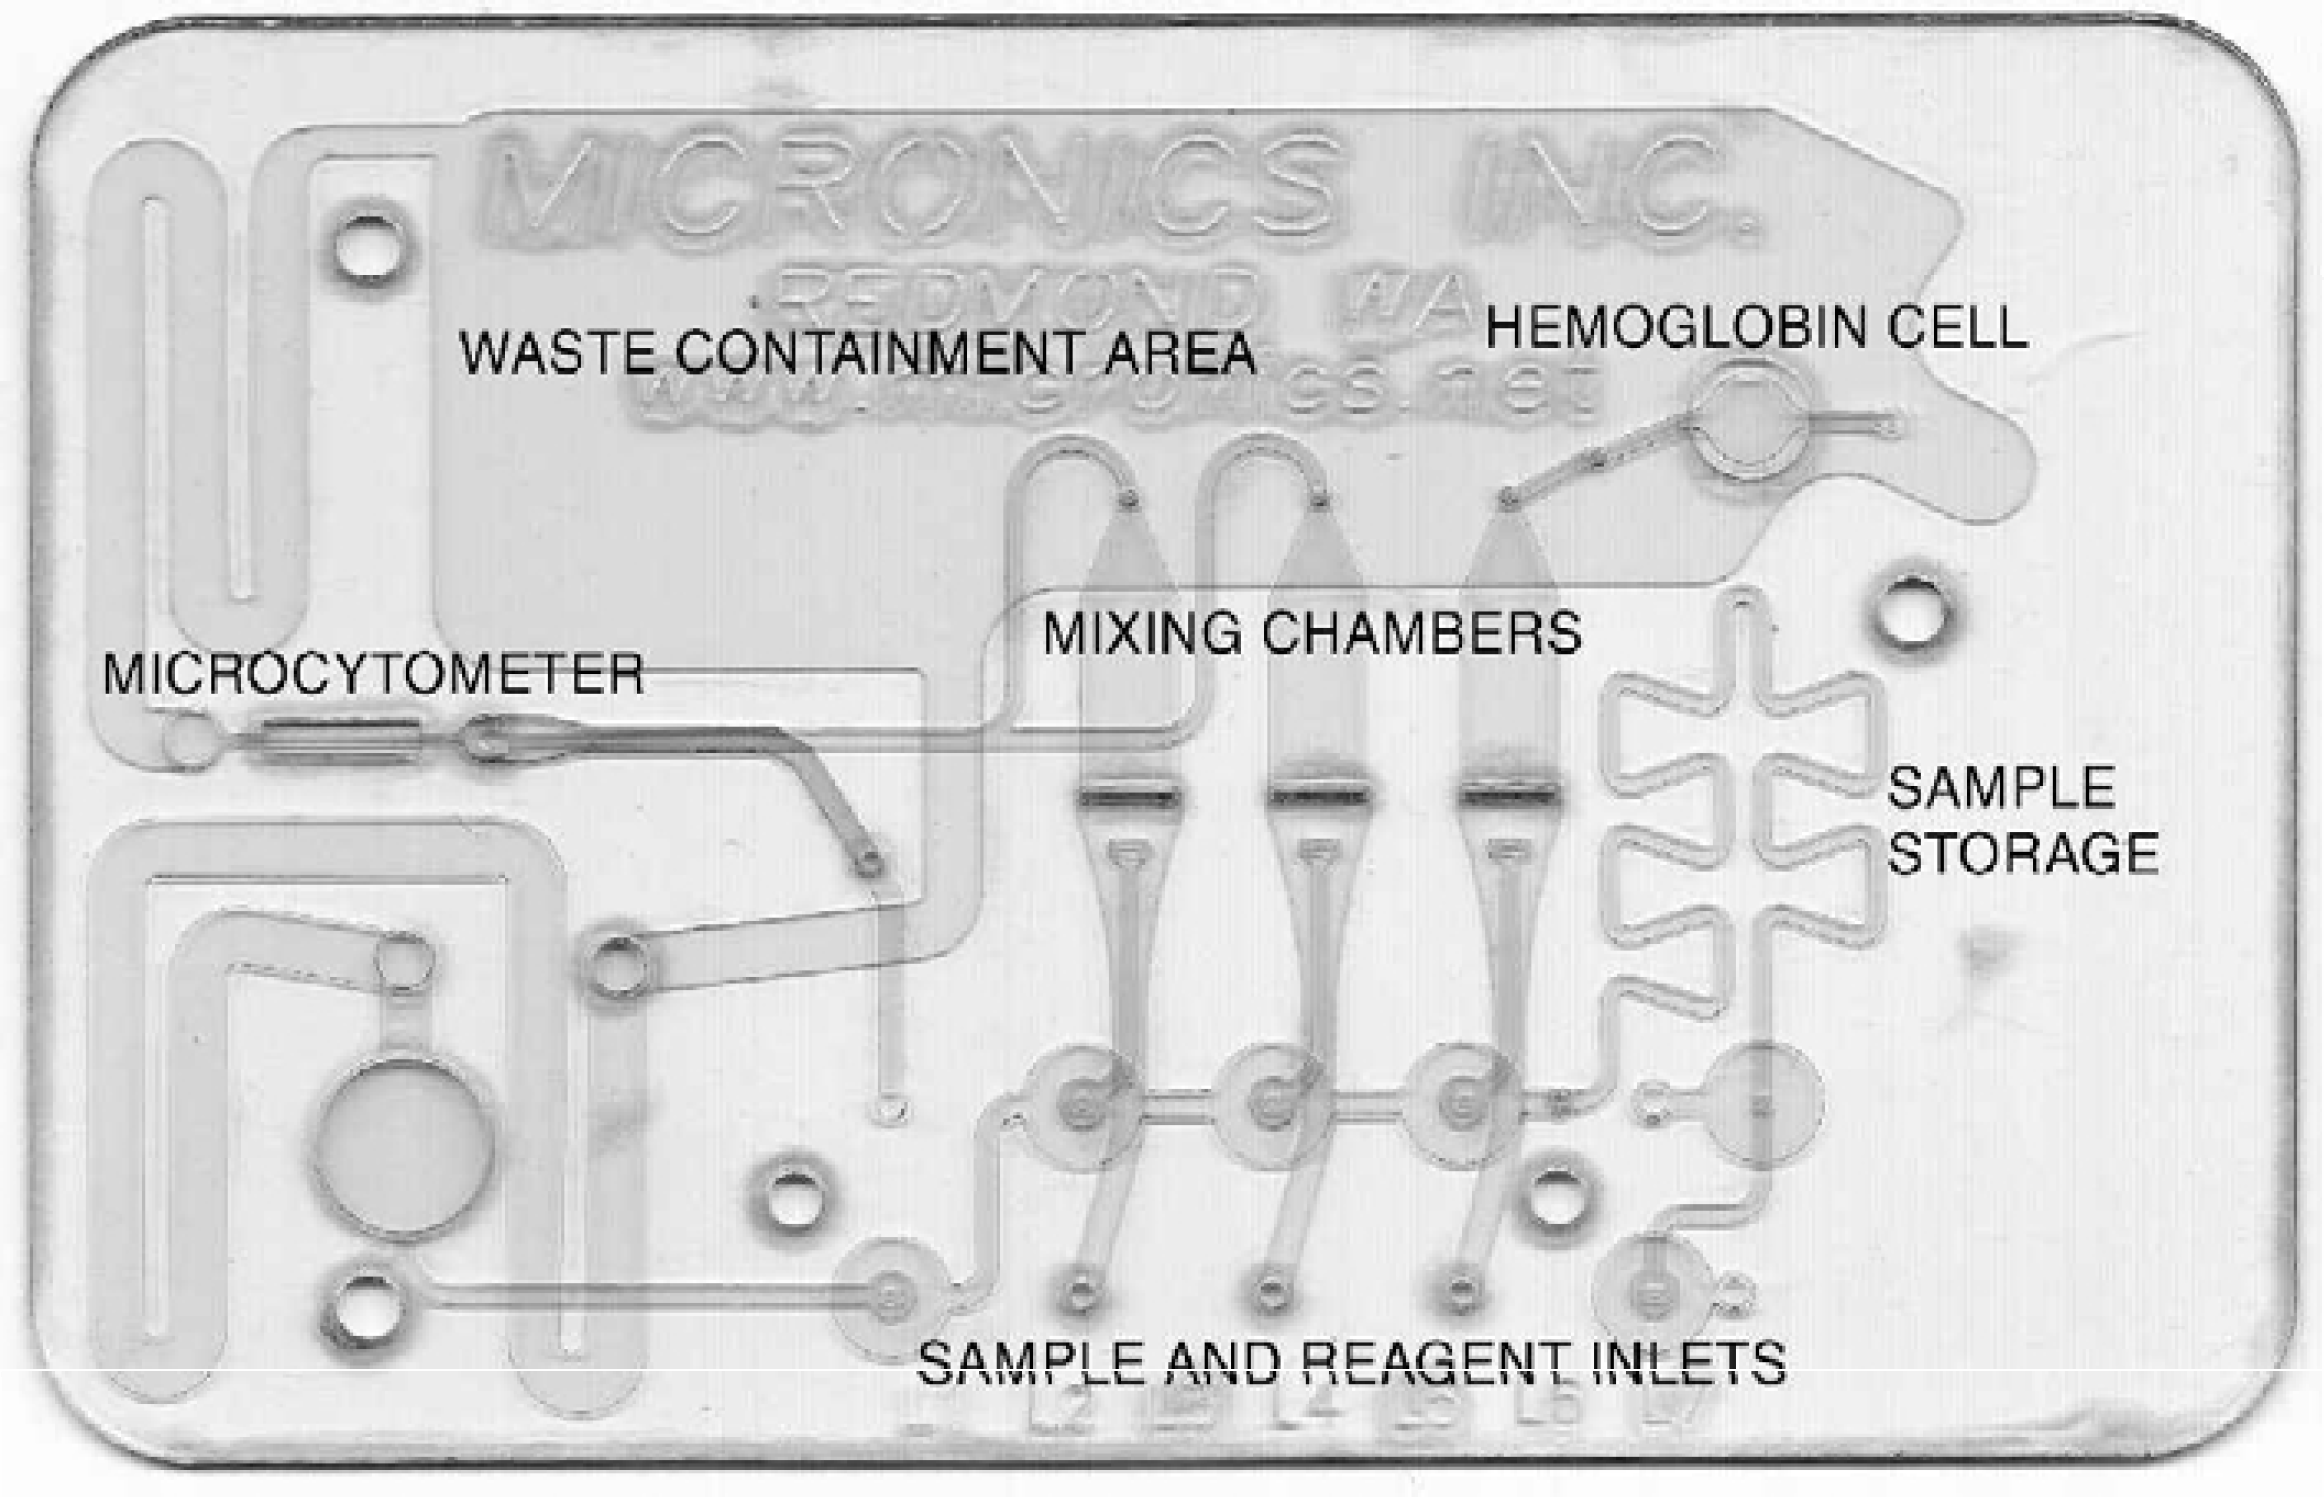
Micronics Hematology Cartridge, designed to determine red cell and platelet counts, hemoglobin concentration, a white cell differential count, and various derived parameters.
A few drops of whole blood are introduced into the card. The sample then gets split up into three largely separate circuits. In the hemoglobin circuit red blood cells get lysed, and the extracted hemoglobin is converted to cyanmethemoglobin, which is then quantified in the optical window portion of the circuit.
In the second circuit whole blood is diluted but not lysed, and the cells are then focused into a microcytometer structure where red cells and platelets are counted and identified using light scattering. In the third circuit whole blood again is diluted, but also lysed with “soft lyse”, which renders red cells invisible to the detector but leaves the white cells largely unaffected. The cells are then focused into the microcytometer again, and white cells are classified into subpopulations using multi-angle light scatter detectors.
Theory and Flow Modeling
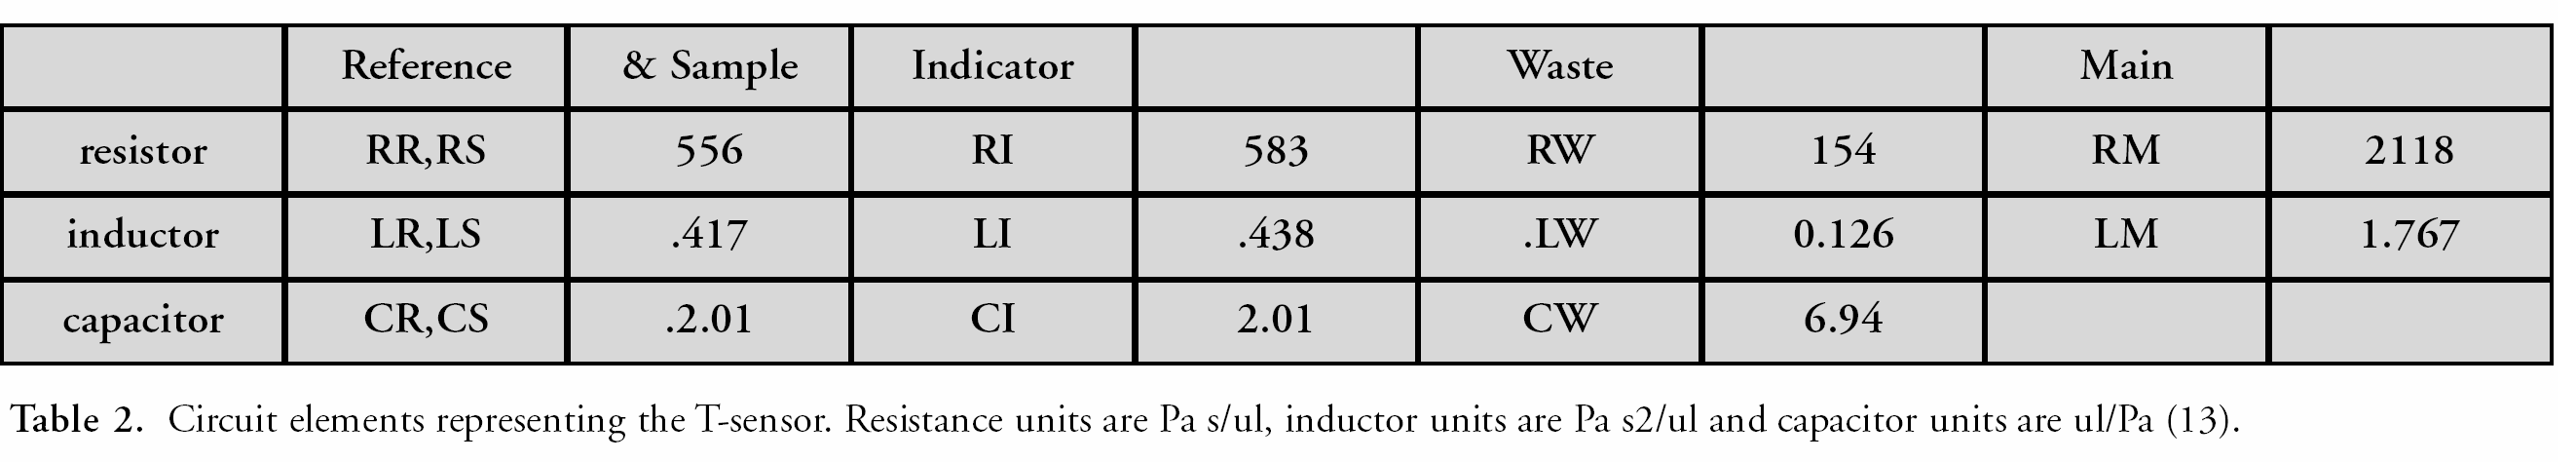
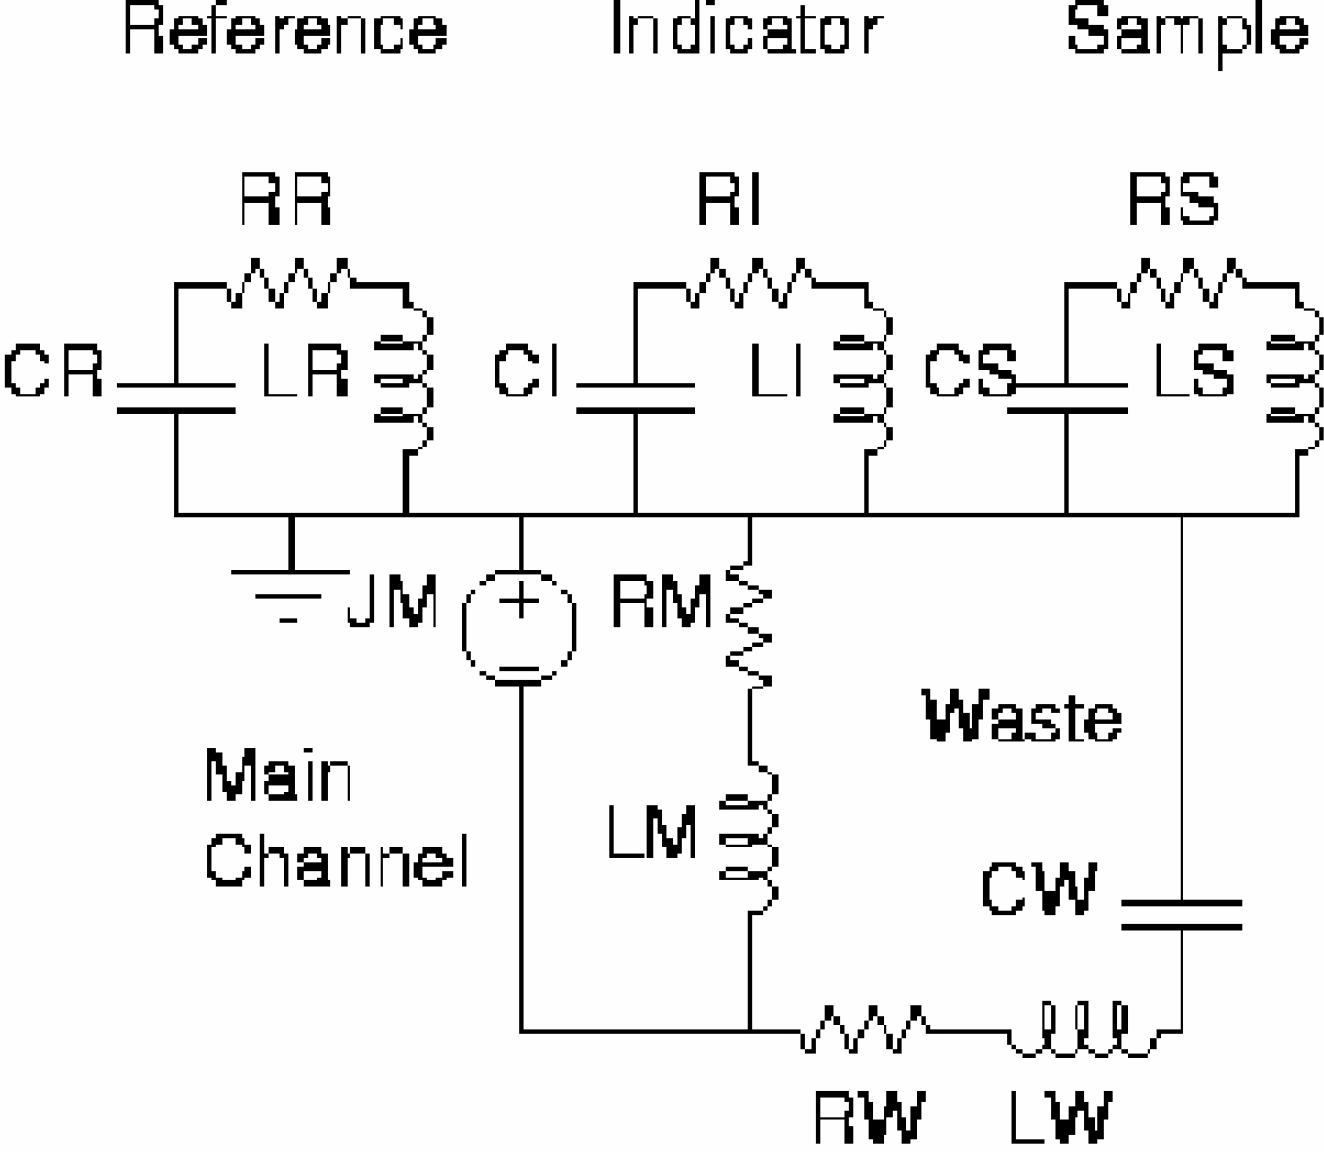
Modeling for the design of the T-Sensor [13] in Fig. 1 required prediction of the volume flow rates of the fluid streams. These were predicted using linear, lumped-parameter modeling based on the electrical-hydraulic analogy, and implemented in Extended Sceptre v.99.004, a SPICE-like circuit simulator. The hydraulic circuit elements in Table 2 were based on the resistance and inertance of channels, and the capacitance of fluid reservoirs, given the physical dimensions of the fluid-carrying channels and reservoirs shown in Table 1, and the initial height of the reservoirs. The resistance, inductance, and capacitance of each fluidic channel and tank were determined from their dimensions and the properties of their fluids by
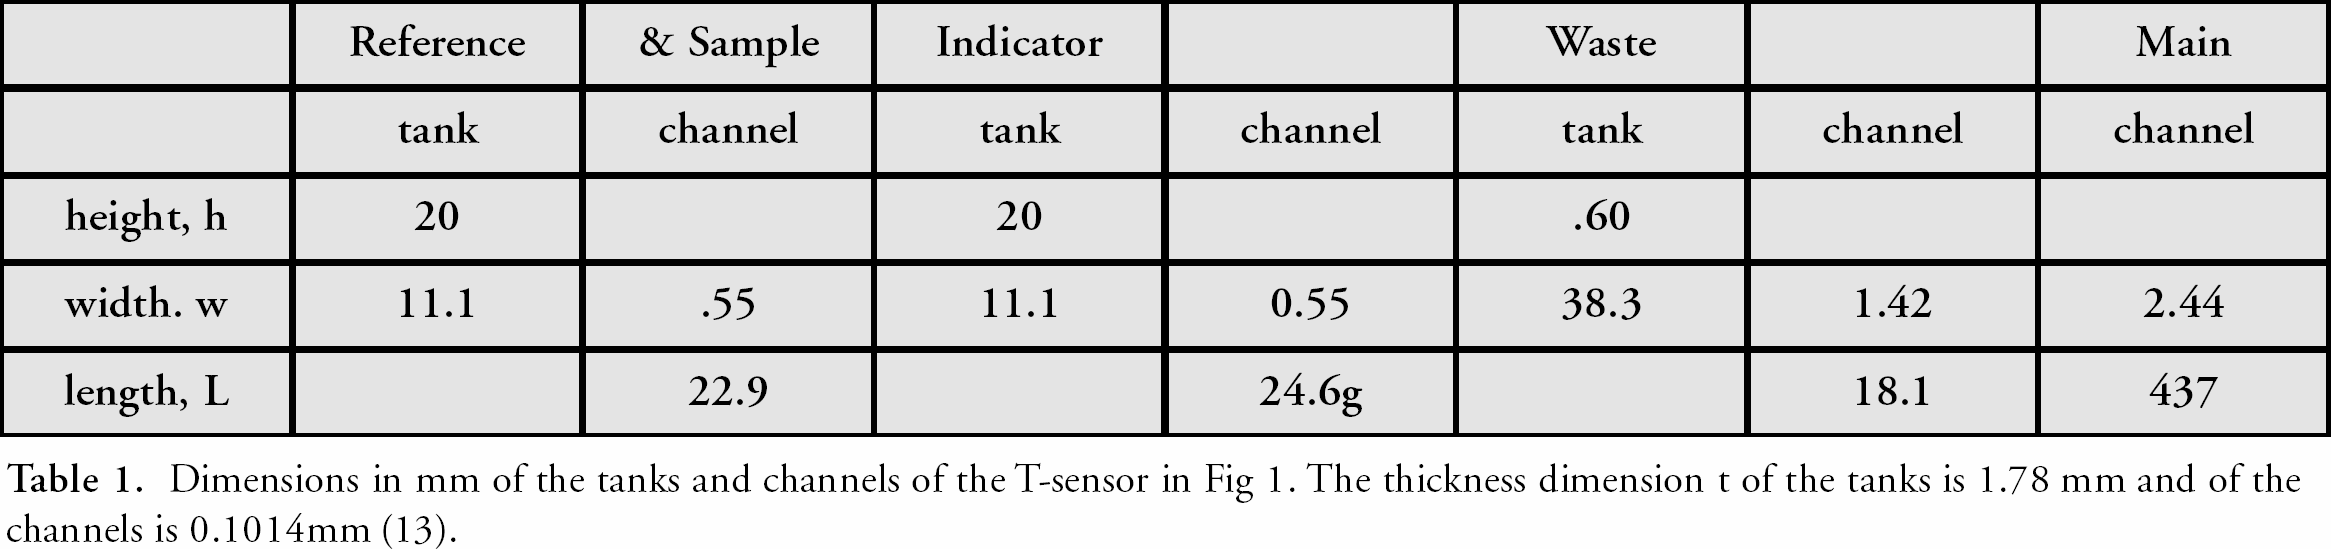

where hydraulic diameter is [DH = 2/(w−1 + t−1 )], [the channel aspect ratio factor is FAR = 2/3 + [11t/24w](2—[t/w])] and [g is the acceleration of gravity].
The fluid properties: density ρ and viscosity μ of water were used. The initial head H in the tanks of the reference, indicator, and sample streams were 196 mm of water, and the initial waste tank head was −586 mm of water, all calculated from the initial height of the liquid in each tank via H = ρgh. The predicted flow rates were 99 nl/s for the reference and sample streams, and 97 nl/s for the indicator stream due to the greater resistance of its inlet channel.
The diffusion and chemical reaction of the chemical species in the T-Sensor main channel were predicted by a finite-difference method with cubic spline basis functions. The velocity field was modelled as a plug flow. Conservation of each chemical species was obtained by solution of the steady-state convection-diffusion equation with chemical reaction, ∂c/∂t+u∂c/∂x=D∂2c/∂y2 +S. The diffusion constants D were determined from the Einstein-Stokes relation and the effective molecular diameters. The chemical reaction model was diffusion controlled and the extent of reaction was based on the equilibrium constants of the chemical species. The high Peclet number (the ratio of convective flux over diffusion flux) of the flow in the main channel guarantees axial convection dominates over axial diffusion. This allows a solution method that marches downstream sequentially solving the grid points at each streamwise location, since the field value at each grid point does not depend on its downstream neighbors.
CONCLUSIONS
We have demonstrated that devices can be operated in the microfluidic regime without the use of any external pumps or power sources. Such devices can be manufactured at very low cost using conventional injection molding procedures for mass-market products, or laser cutting laminate technologies for custom and rapid prototyping applications. We believe that devices based on this technology will soon be in use for applications such as blood plasma separations, blood typing, qualitative immunoassays, and consumer products for environmental, educational, and home applications. In addition, these devices show much promise as components of laboratory analysis systems, in particular for sample preparation and fluid handling.
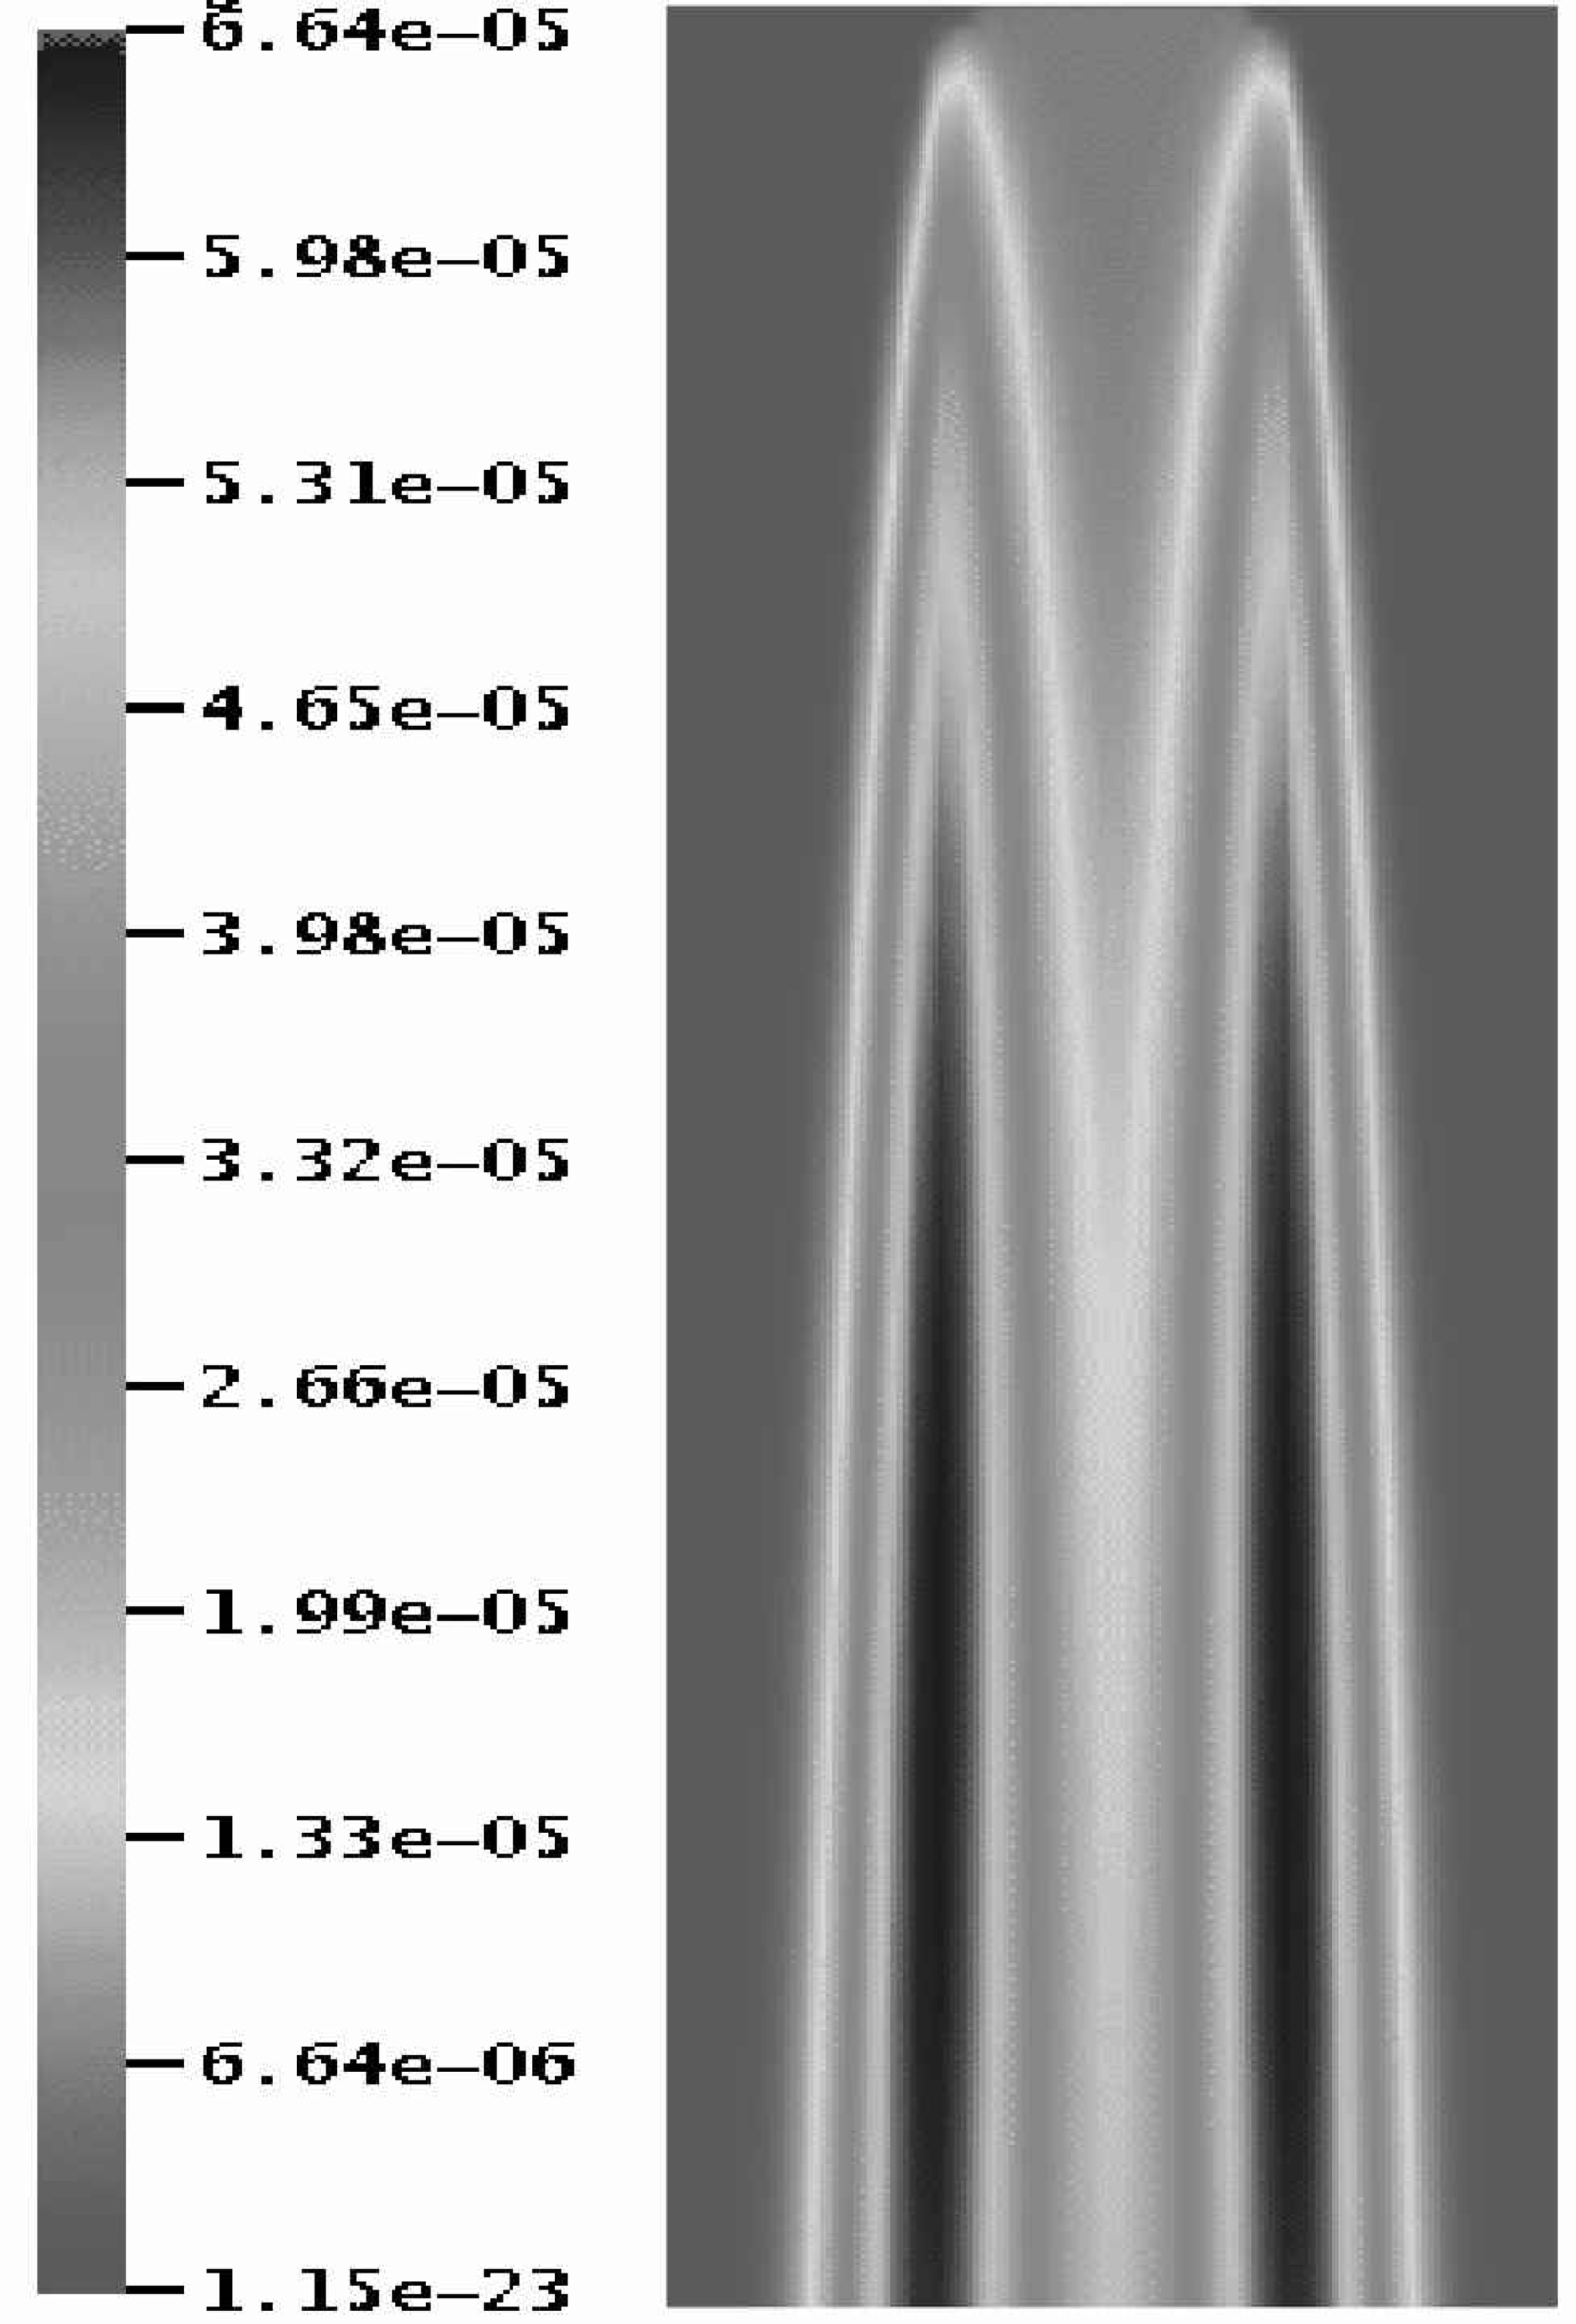
Flow and diffusion modeling results (right). The concentration of the base form of the indicator in the main channel of the T-sensor, indicating the optically observable change as a function of pH. The concentration color chart is shown to the left.
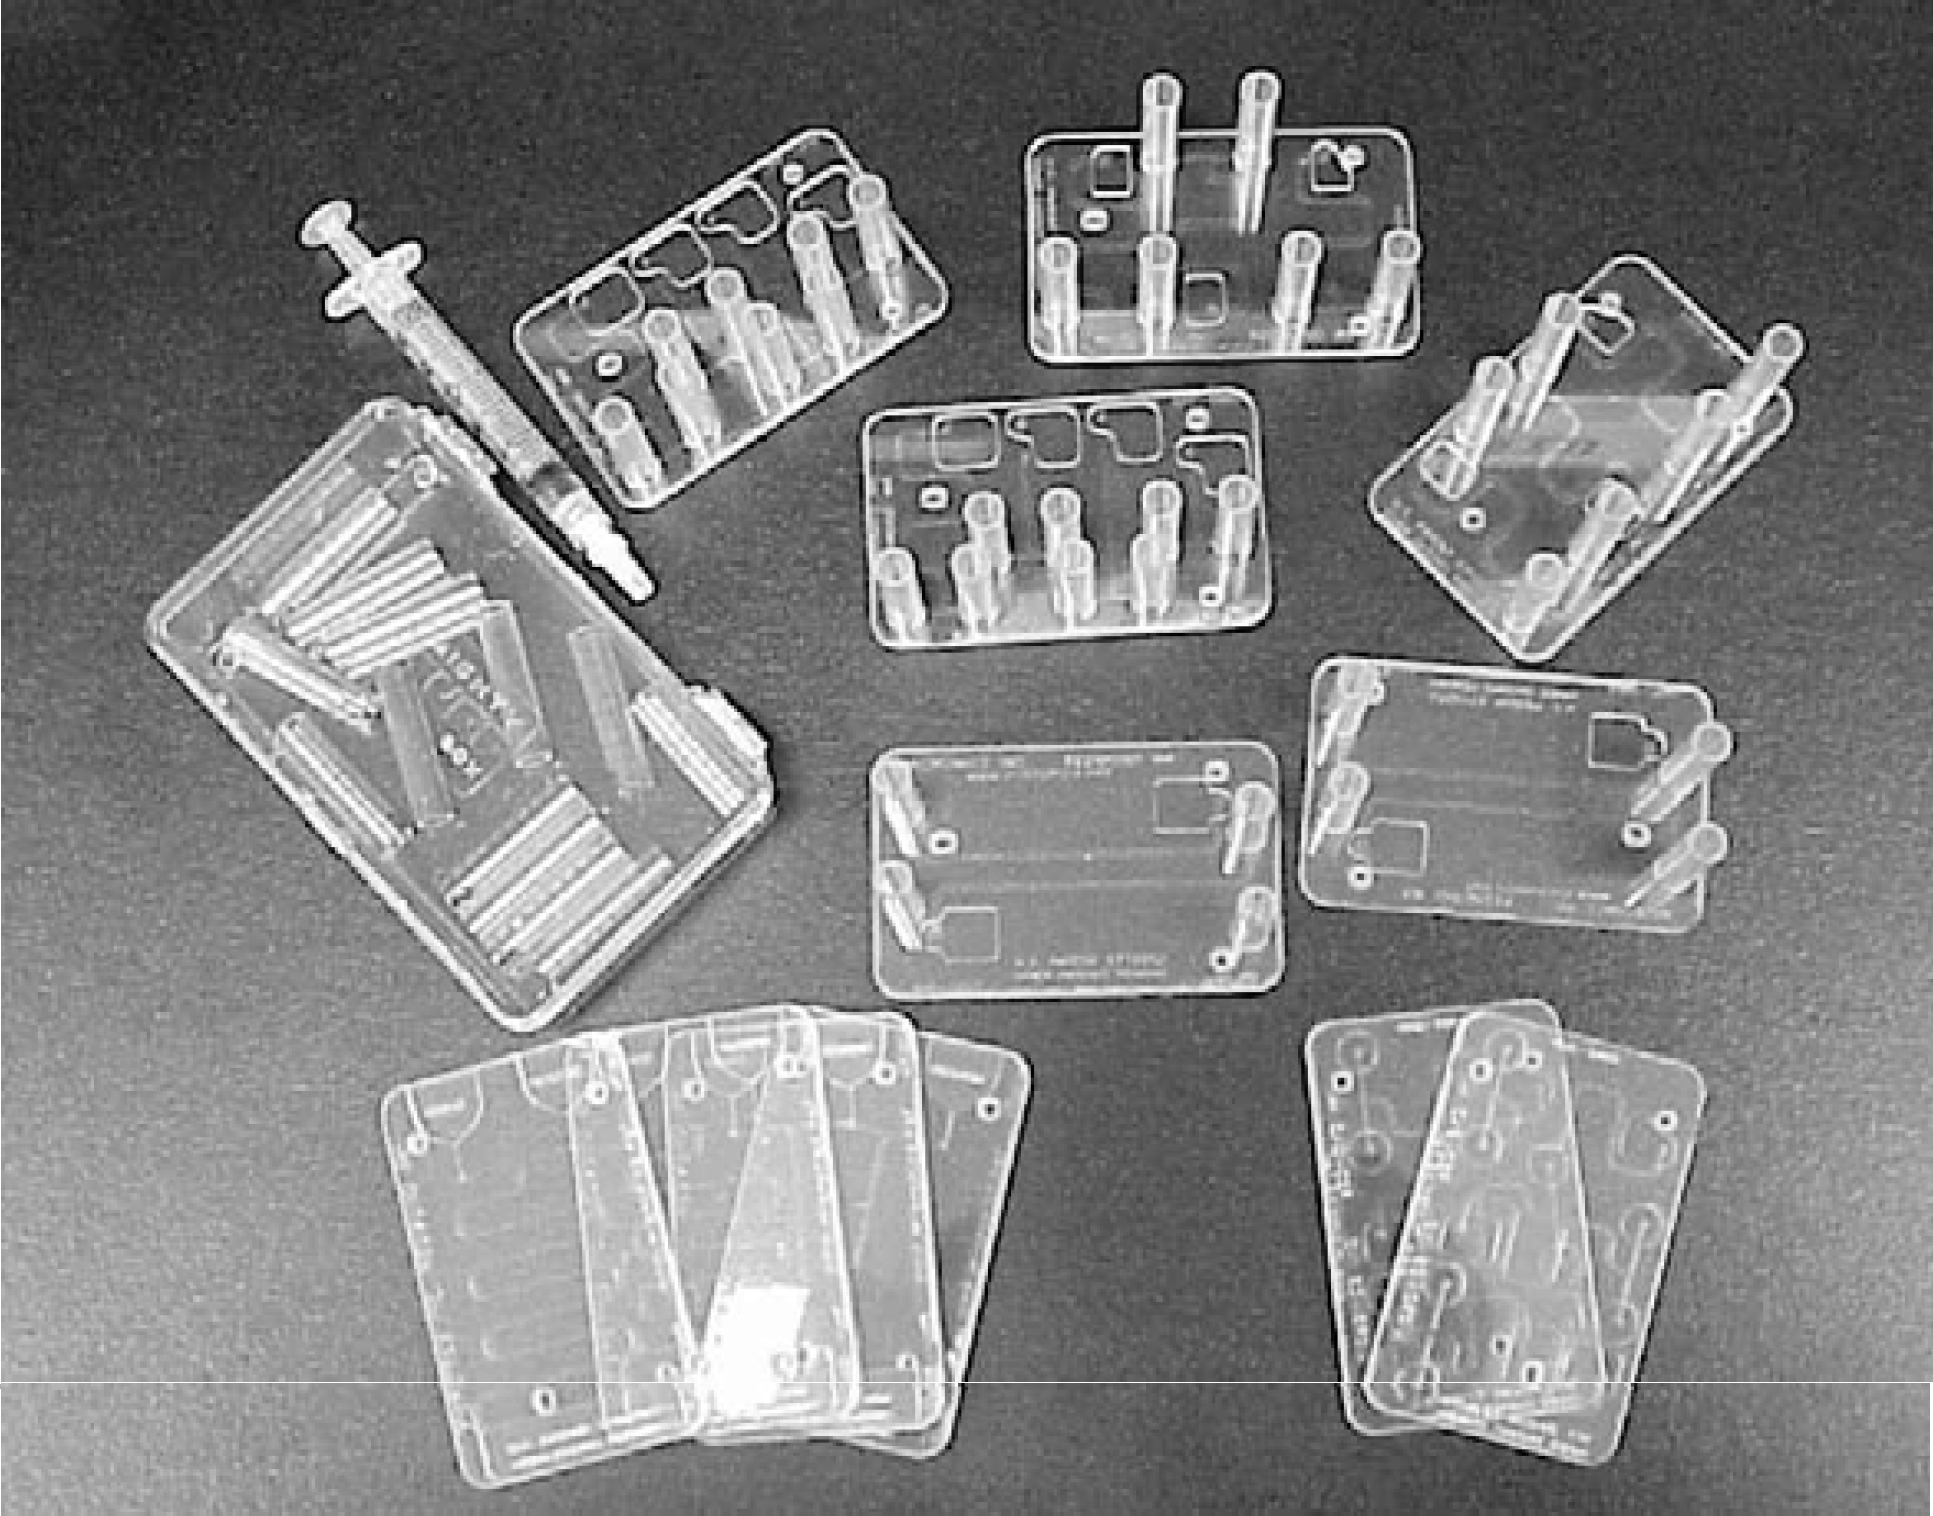
Micronics Microfluidics Evaluation Kit (MicroKit™).
Circuit elements representing the T-sensor. Resistance units are Pa s/ul, inductor units are Pa s2/ul and capacitor units are ul/Pa (13).