
Abstract
We evaluated the benefits of automation on the technical performance of a new automated cell culture incubator, the Autocell 200®, developed by Jouan SA. In addition, we assessed the potential interference of the embedded mechanical parts on cell culture growth. We measured a throughput of 150 plates loaded per hour, and 120 plates unloaded per hour, which is compatible with an external robotic handler. The mean time of robotic gate opening was 7 s. The gate pathway minimized climate disturbances inside the incubator. For CO2, we used a delay between opening events of 1 min. Biological assay results did not demonstrate a significant difference between the automated incubator and a traditional manual incubator, but we concluded that automation using the Autocell 200® could provide meaningful benefits for cell culture.
Introduction
The main equipment used in cell culture is a cell culture incubator. Traditionally, cell culture is performed manually, and containers stored in an incubator are accessed through a large door that interferes substantially with atmospheric conditions inside the incubator. 1,2 The evolution of drug discovery methods toward high-throughput assays, the increasing cost of laboratory personnel, and the need for standardization have led to a need for automation. 3
Automated cell incubators have been developed. They are able to manage and handle cell culture containers inside the incubator and allow entrance and exit through automatic doors. Among the products recently proposed by Jouan Robotics (Jouan SA), 4 we evaluated the benefit of automation on the technical performance of an automated cell culture incubator, the Autocell 200®, and we measured the impact of the embedded mechanical parts on cell culture growth. 5
Materials and Methods
Autocell, a robotized CO2 incubator commercialized by Jouan SA (Jouan Robotics brand name) was developed for high-throughput screening (HTS) and research applications. Like traditional incubators, a front door allows manual operations and protects an internal glass door that permits the visual inspection of the incubator contents without opening the incubator. A specific robotic gate on the rear panel is used for mechanical retrieval of the plates without disturbing the internal climate thanks to its small dimensions and its vertical opening mechanism. In this study, we evaluated the Autocell 200® (Fig. 1).

Autocell 200: Front view and back view (sectional drawing).
A total of 198 microtiter plates are stored in one of 22 loading positions in a stacker; the carousel holds nine removable stackers. The handling system is comprised of the carousel and a robotic arm with a shovel at its end. Plates to be unloaded are retrieved from the stackers using the shovel, lifted vertically toward the gate, then automatically removed and placed on an external transfer station where they become available for robotic or manual handling. The loading process reverses the order.
These incubators are designed to be integrated into specific incubation modules. In conjunction with a robotic handler, they can form the core of a complete automated cell culture system where each task is planned by computer, often by the supervising software.
We used multipurpose equipment that was able to work either in a sample storage temperature range (+4 °C to ambient) or in an incubation temperature range (+33 to + 50 °C). Storage capacity is 99 half-height plates (6 wells), and medical CO2 was provided by a 35-L gas cylinder. Input pressure was maintained at about 3 bars.
For purpose of our evaluation, plate handling was controlled by a program called StoreX Easy Panel (v. 3.1). This tool required a sample location with two numbers (stacker or slot from 1 to 9; level from 1 to 22) to command plate loading and unloading. Orders were executed using StoreX Easy Panel running on an external computer connected to the incubator. In routine use, the incubator would be controlled by a global supervisory software program as would the other elements of a fully automated system.
Determination of Loading/Unloading Throughputs
Assays were implemented at different positions in the carousel using several 6-well plates having a standard SBS footprint. A list of 50 randomized transfers, including one loading and one unloading movement, were executed at a low throughput (about 1 min delay between commands). In a second series, 40 transfers from this list were performed consecutively at the maximal throughput that the system could ensure.
Access times were measured with a manual timer. Repeatability of plate handling was determined on three carousel levels: bottom (level 1), intermediate (level 11), and top (level 21). For each position, access times were measured on a run of 10 consecutive transfers.
Environmental Control
Parameters: All physical parameters were measured by instruments compliant with metrological standards.
Temperature: Several K thermocouples were connected to a central data acquisition unit (Agilent Technologies, 34970A type). Temperature was set at 37 °C, and ambient temperature was monitored during the study. Signals from all thermocouples were measured every 10 s.
Relative Humidity: Relative Humidity (RH) was recorded with the help of a hygrometric sensor (Rotronic HY-GROMER®) placed in a central position within the workspace. This instrument also measured temperature. RH was set at 98%, and there were 6 L of water in the tank at the bottom of the chamber.
CO2 : CO2 was measured using a VAISALA® (GMP 221 type) infrared sensor connected to the data acquisition unit. CO2 concentration in the incubator was set at 5% while ambient CO2 concentration was about 0.2%.
Assays
Cartography (temperature only): As shown in Figure 2, 20 thermal sensors were placed inside the chamber: one on each inner surface (at a distance of 1 cm), one close to the robotic gate, two on the inner glass door, two between the front and glass doors, and nine clamped on plate lids (three per level for levels 1, 11, and 21 of the carousel). Measurement occurred after 24 h of inner climate conditioning. The temperature at all points was recorded for a period of 2 h without opening the incubator door.

Thermal cartography in the Autocell 200: sensors disposal.
Stability assays: K thermocouple leads were first placed on plates positioned on three levels in the center of the workspace (carousel) and suspended from the top of the chamber, as was the case for RH and CO2 sensors. After the initial 24-h delay, temperatures at all levels, RH, and CO2 levels were recorded simultaneously every 2 h.
Recovery after open events: The same sensor positions were maintained while continuously recording the central temperature, RH, and CO2 concentration of the chamber. The door was opened twice in a 30-s period, then a series of four gate openings was performed at decreasing intervals (at 3 min, 2 min, 1 min, then back-to-back).
Biological assays: Human Hela and 293 cells (American Tissue Culture Collection) were cultivated in 6-well plates in Dulbecco's modified Eagle medium (Sigma), containing 10% foetal calf serum (Hyclone) and 1% penicillin/streptomycin (Biowittaker), at an initial density of 2.5 × 10 5 cells per well. 6,7 Three plates were located in the Autocell 200® at these positions: slot 9/level 1 (S9L1), slot 5/level 11 (S5L11), and slot 1/level 21 (S1L21). One reference plate was cultured in a non-robotized water-jacketed CO2 incubator (IGO150; Jouan SA). To collect the cells, they were treated with 0.5 mL of 0.5% trypsin (Sigma) for 5 min at 37 °C and harvested in 4-mL culture medium. Enumeration was performed in a Malassez cell. Viability was estimated after eosin staining.
Results and Discussion
Loading and Unloading Throughput
Results of the experiment are summarized in Table 1. The loading process for each plate lasted 24 s. The complete unloading operation lasted 31 s, while plates were delivered in 25 s. Loading and unloading times depended on the distance between the robotic arm and the target plate position. Loading and unloading movements consisted of several sequential steps, including the rotation of the carousel, the vertical ride of the arm, and the horizontal and rotating course of the shovel.
Autocell 200: Measured access times
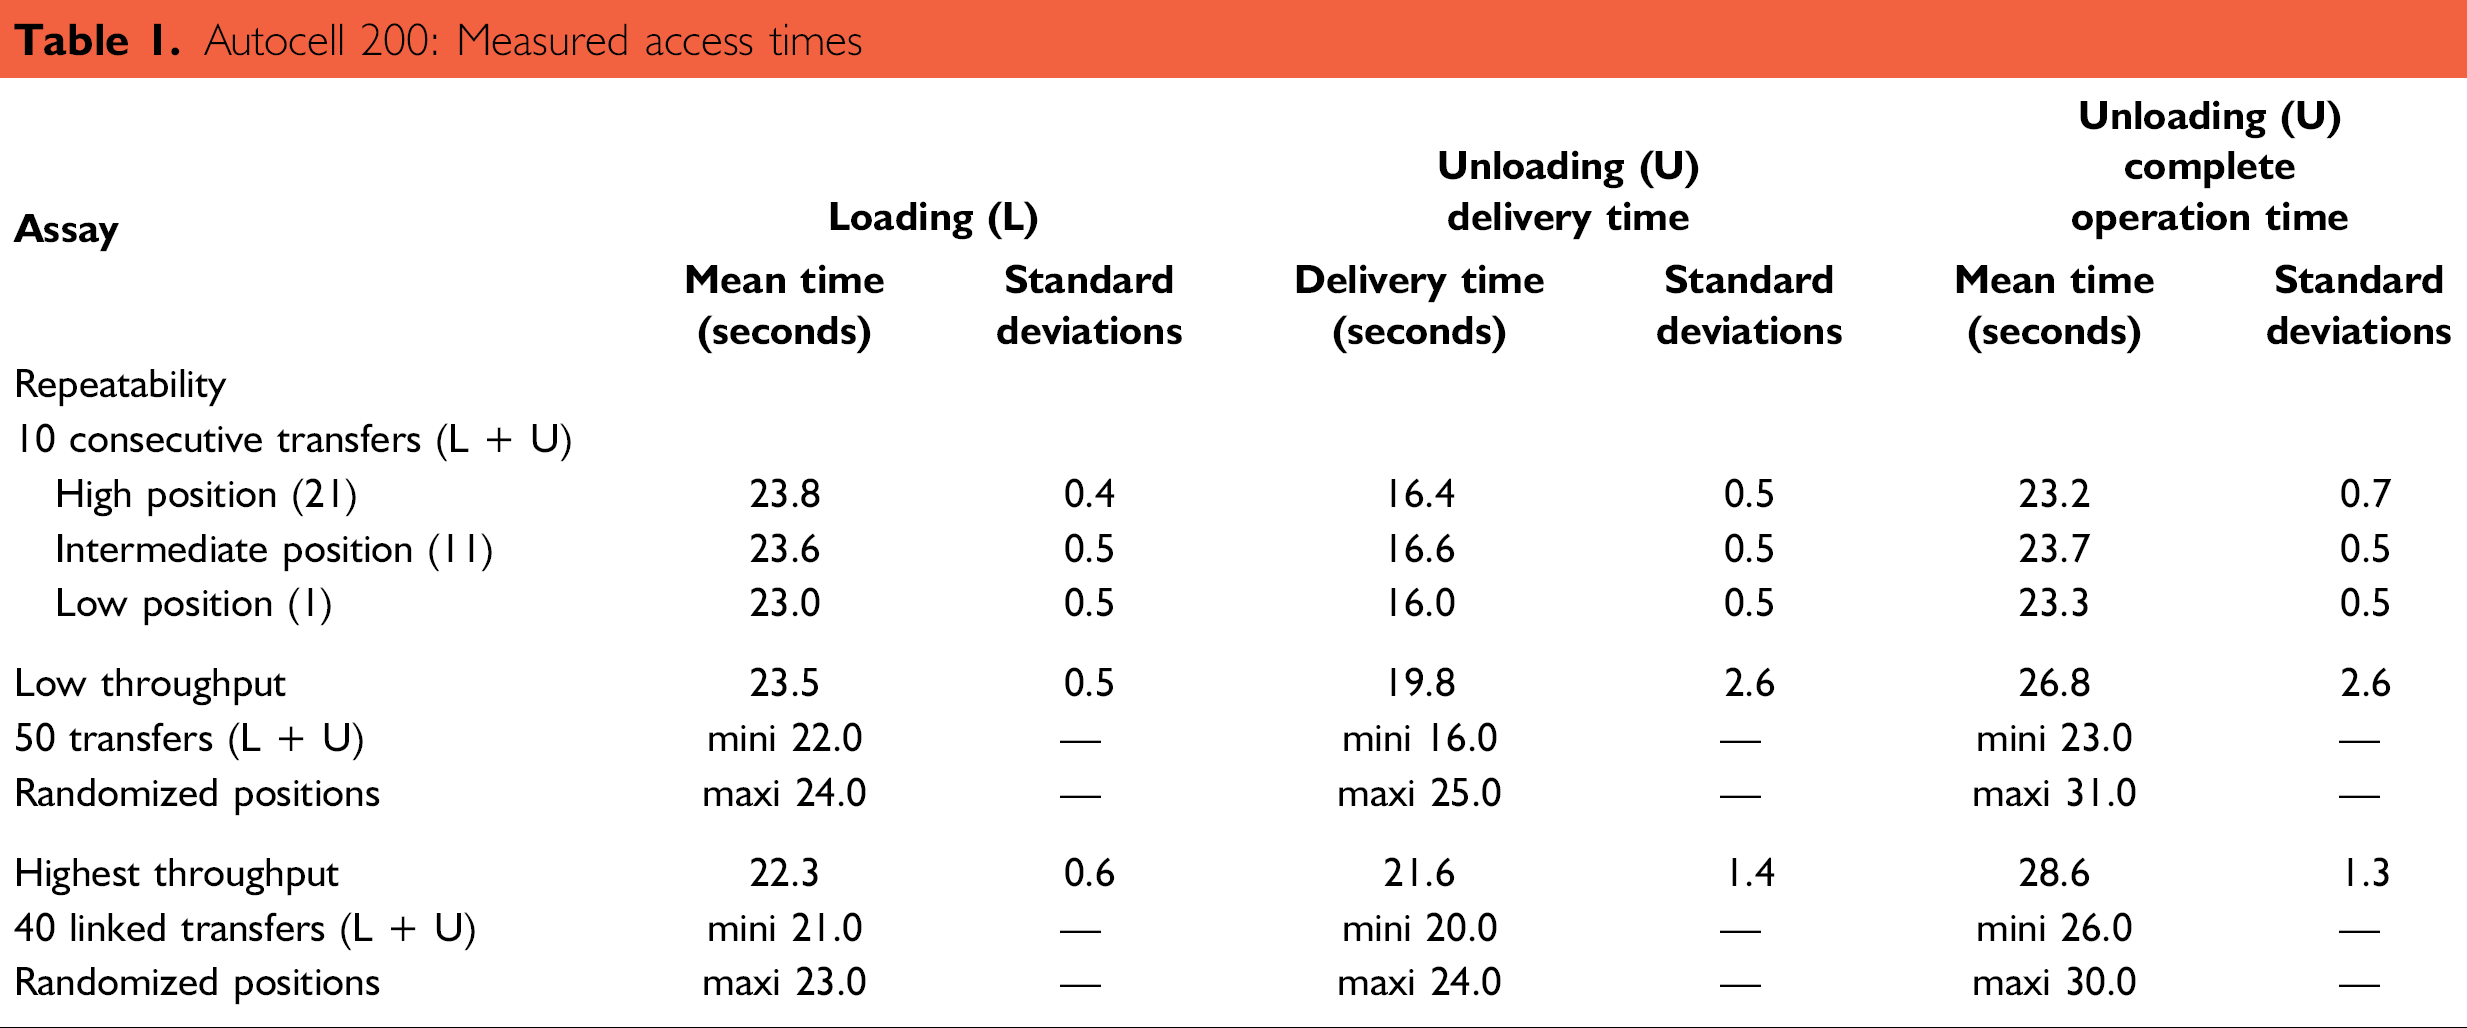
The rotation of the carousel varied, depending on the distance between the target position and the axis of the arm. Mean and maximal access times were determined by randomizing target plate positions.
It is important to stress the difference between the delivery time of a plate, which represents the delay between issuing the retrieval command and the actual plate availability, and the complete unloading time. During the retrieval process, plates were removed from the incubator before the arm was available to execute a new command. The largest unloading frequency is characteristic of the performance of the incubator. It is calculated from the duration of a complete operation and was estimated at 120 plates per hour. Delivery time is important for integration and for synchronization of an incubator in a fully automated system. An external robotic handler would not have to wait to pick up a plate until the completion of the unloading cycle. It would be able to carry out other tasks before returning.
In general, independent commands were executed more slowly than consecutive ones; the time difference was about 1 or 2 s under experimental conditions. The mean time of robotic gate opening was calculated at about 7 s, regardless of the operation. The carousel cycle lasted 7 min in the incubation mode (without opening). An 8.57 turn per hour continuous rotation maintained climate conditions by keeping the air well mixed.
Environmental Control Parameters
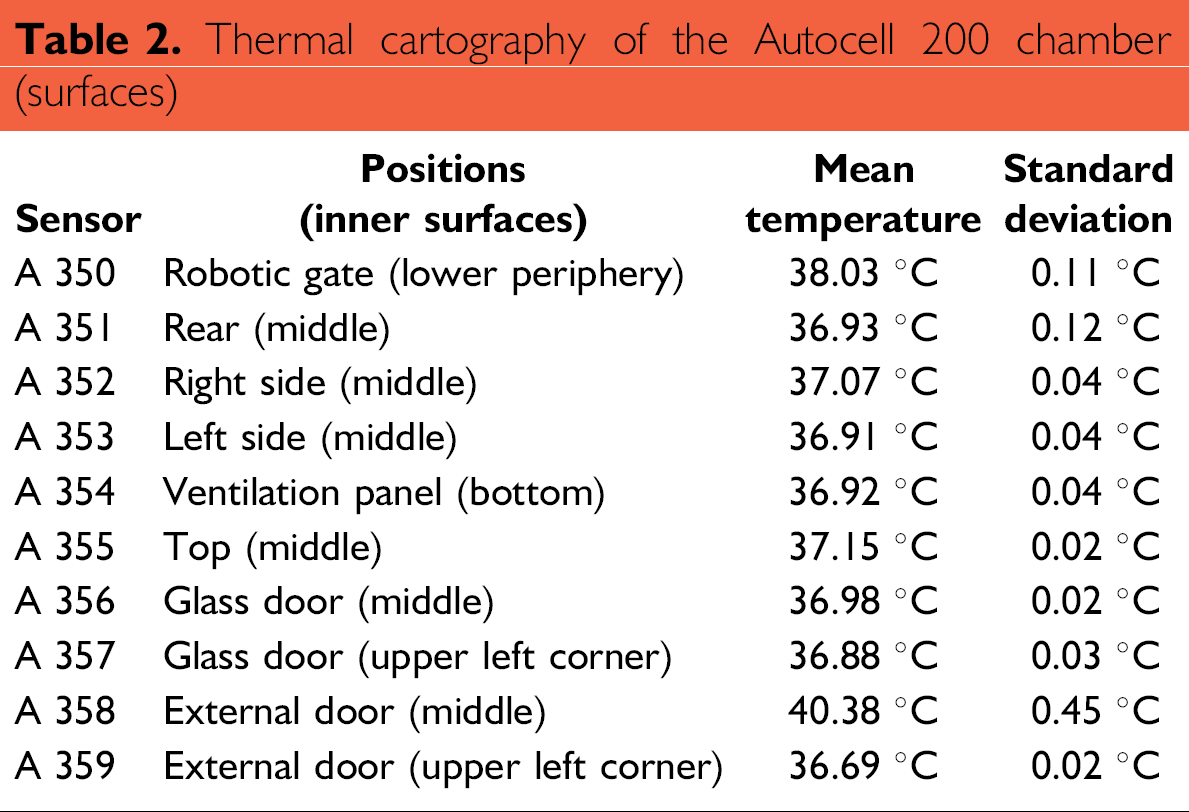
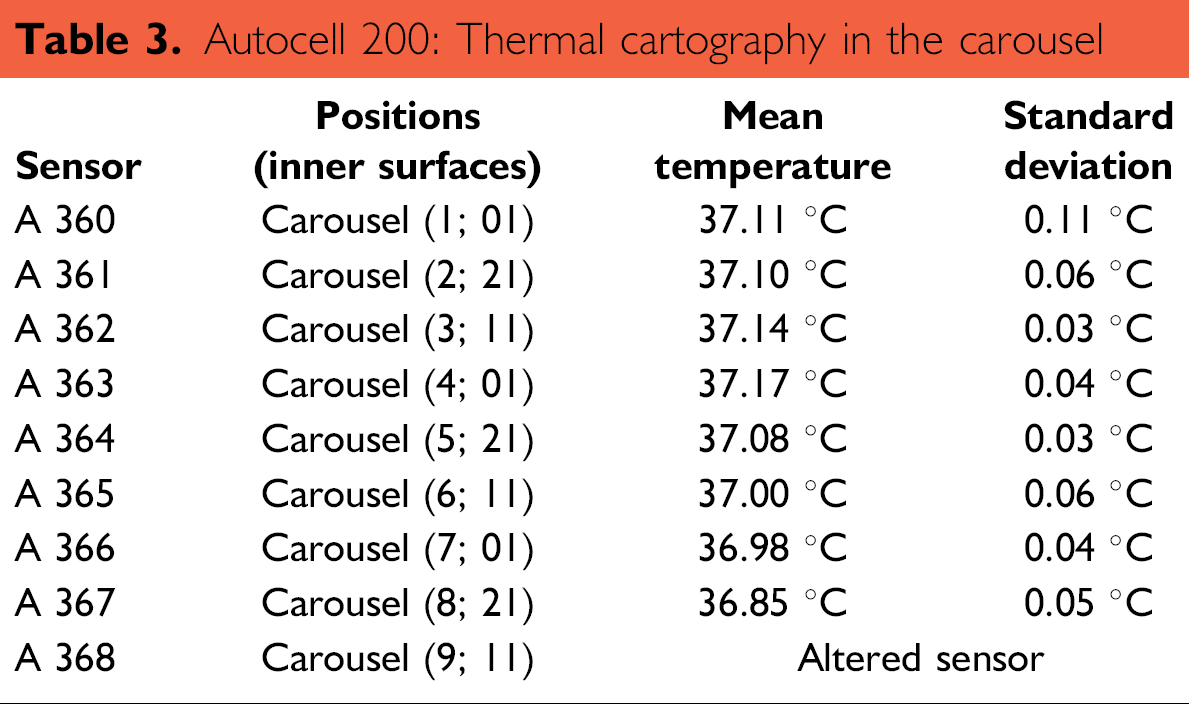
Thermal cartography: Average temperatures, as measured by the sensors positioned throughout the chamber, are summarized in Tables 2 and 3. They were calculated by extracting measurements from the final 30 min (corresponding to 180 points) of the 2-h recording period. Results can be separated into two groups: (1) temperatures of the inner surfaces (Table 2) where sensors were stationary and (2) temperatures inside the workspace (Table 3) where sensors moved with the rotation of the carousel. All temperatures inside the chamber, not including the external door, were between +35.85 and +38.15 °C, which was within the tolerance interval (theoretical mean ± 5%, i.e., 37 ± 1.85 °C). Chamber homogeneity was estimated by the difference between the maximal average temperature (measured as 38.03 °C at the gate) and the minimal average temperature (measured at the carousel, position S8;L21, at 36.85 °C). In this case, the value was 1.18 °C. Homogeneity inside the carousel was very good, with the largest difference being 0.3 °C.
Thermal cartography of the Autocell 200 chamber (surfaces)
Autocell 200: Thermal cartography in the carousel
Both the borders surrounding the gate and the external door were equipped with an internal heating element. These points were discovered to be hot spots, with mean temperatures of 38.03 and 40.38 °C, respectively. Figure 3 reveals cyclic thermal variations at the center of the external door and at the back surface, with quick increases and slow decreases. These variations resulted from the electrical events that occurred in the heating system. Measured amplitude variations ranged from ±0.4 °C (rear) to ±1.2 °C (external door). It appeared that the heating of the external door helped to maintain stability of the climate in the chamber, avoiding heat loss across the glass door due to the influence of the external room temperature.

Thermal cartography in the Autocell 200: heated surfaces and carousel.
Periodic carousel temperature oscillations were also evident on the charts. A 7-min period was observed, which corresponded to cyclic exposures of the rotating plates to a hot spot located in the back of the chamber. This probably corresponded to the heating system surrounding the gate. Variations in amplitude were small, at about ±0.2 °C. The temperature in the proximity of the Autocell was stable during the assay at about 25.8 °C, while ambient temperature was measured between 23 and 24 °C.
Temperature: Results from the stability assay (Table 4) gave average temperatures at the middle of the storage compartment while the incubator door remained closed. Standard deviation of the temperature was the same for all sensors, less than 0.1 °C. The results of the defective sensor, A 368, were not taken into account. All average temperatures exceeded the set point (37 °C), but were in the interval of 37 ± 0.5 °C with a maximum at 37.40 °C and a minimum at 37.02 °C.
Autocell 200 thermal stability
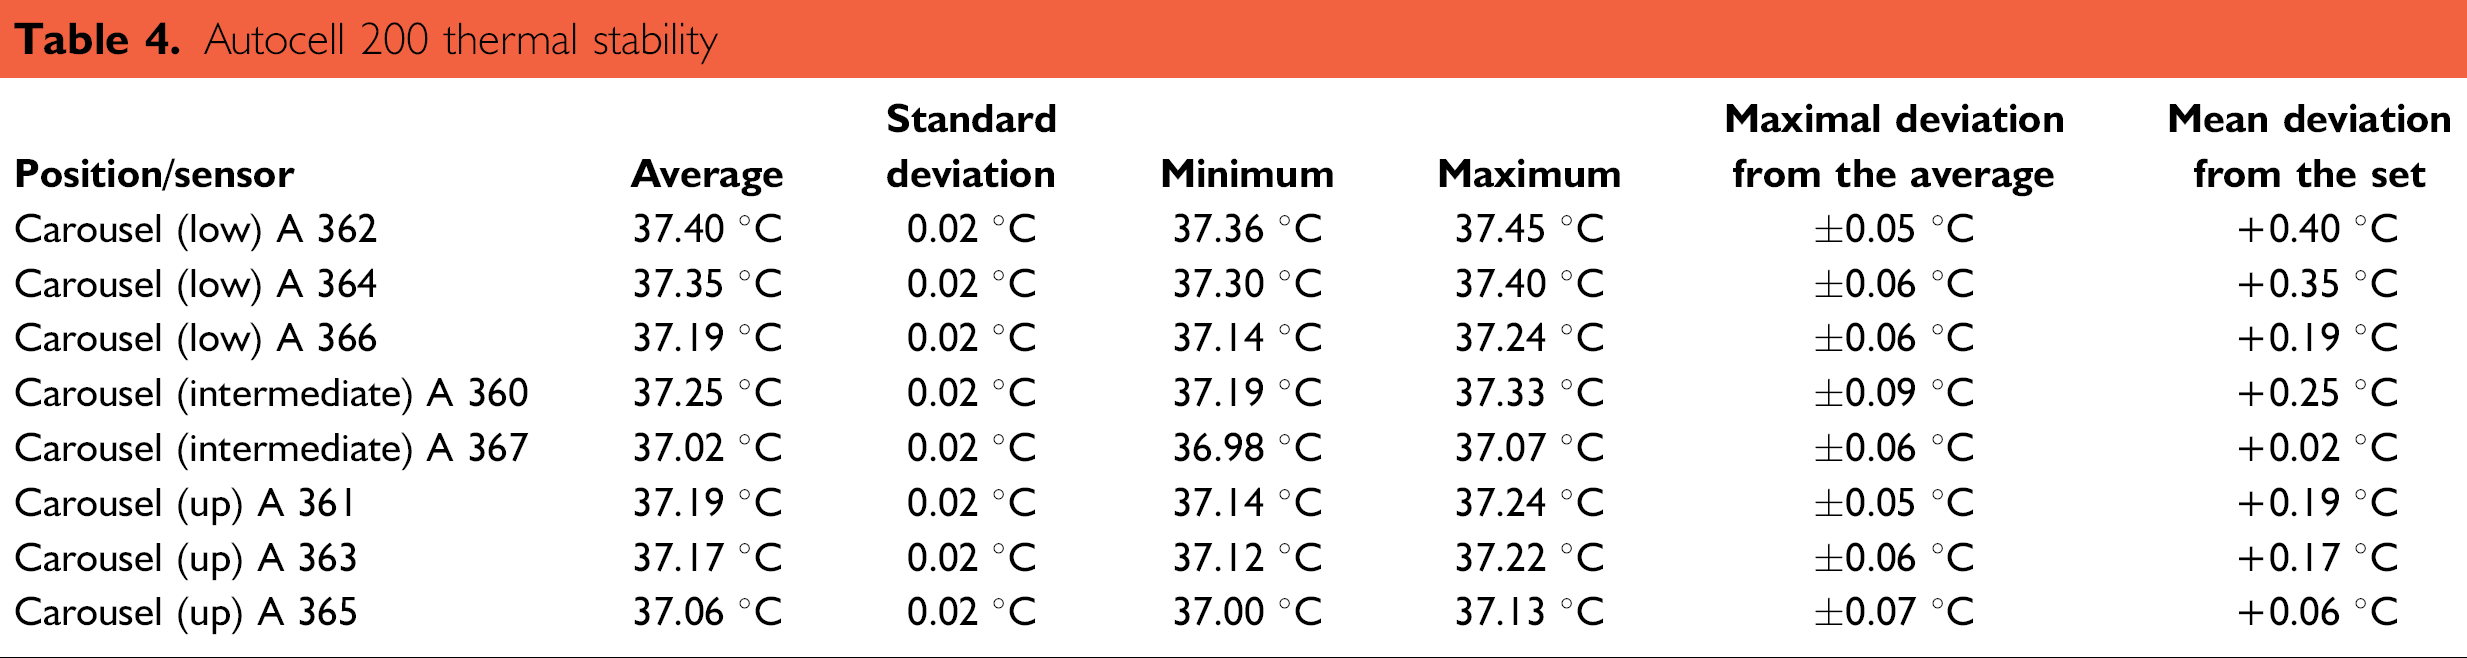
The bottom of the carousel seemed to have significantly higher temperatures than upper levels, but the overall homogeneity (defined as the difference between maximal and minimal averages) was about 0.4 °C. This meant that plates stored at different levels were exposed to very similar temperatures. The stability value was estimated by the maximal deviation from the average temperature, which was close to ±0.1 °C for the A 360 sensor. Thermal variations in the middle of the carousel were also significantly smaller than variations detected directly on the plates (cartography), which were about 0.2 °C.
Typical oscillations in the plate's temperature were observed due to the cyclic influence of a hot spot. In the central position, the sensors were motionless, and no temperature oscillations were observed on the charts. Furthermore, in this case, sensors were protected by the carousel shield.
The use of K thermocouple sensors, which were fixed on or within microplates, gave an accurate representation of the cell cultures' local environments. This method could be implemented easily in traditional chambers where plates are stored on stationary stages. The storage system of the Autocell was continuously rotating, causing thermocouple leads to experience spinning strains. During the 2-h recording experiment, an 8.57 cycle/hour rate of rotation caused the leads to twist more than 17 times, with an evident risk of breakage. Instead of this method, temperature measurement at a central point did not induce any strain on hanging thermocouple leads, with comparable results.
Relative humidity: In a similar manner, data from the final 30 min of a 2-h recording period were extracted to determine the mean relative humidity and its stability. Because analysis occurred at only one central point, homogeneity could not be determined.
The average RH was 96.58%, with a standard deviation of ±0.02% and a deviation from the setpoint of about −1.42%. Stability of this parameter was very good at a value of ±0.33%. Autocell's built-in control system provided a 99.9% RH level. This gap could be explained by the difference in the positions of the sensors and by the fact that RH was a passively controlled parameter that depended on the quantity of water in the chamber. Our results were for an empty carousel, although during typical operation the evaporation of water from culture media must be added to the evaporation of tank water to maintain the RH level.
When humidification helped minimize the evaporation of culture media, an RH level higher than 95% usually increased the probability of the appearance of condensation on inner surfaces. To study this phenomenon, inner surfaces of the chamber were dried with absorbent paper and the doors were closed. Inner surfaces were observed through the glass door every hour for an 8-h period and then at 24 and 48 h. Within 3 h, a film of condensed water was visible on the left steel panel near the door. After 8 h, there were drops on both sides, and a veil appeared on the glass around the door handle. After 24 h, water was streaming along both sides, and the inner door handle was surrounded by drops of condensed water.
A thermal analysis revealed that the condensation starting locations were a bit colder than other surfaces: 36.25 °C on the left side (next the door) and 36.87 °C on the right side. The temperature of the water tank was 36.01 °C, which determined the dew point. Because the temperature on the left side was close to the dew point and more than 0.5 °C less than elsewhere, it was not surprising to find condensation there.
CO2 : The average concentration of CO2 was calculated from the final 30 min of the experiment. It was measured at 5.33% (standard deviation ±0.03%), with a stability of ±0.09% (maximal deviation from the average for the recorded period). The average exceeded the set point (5%) and was even higher than the upper limit of the interval (set point ±5%). As for the RH, the Autocell built-in sensor (at the bottom) reported different values, at about 5.15%, which were reaching into the tolerance interval. The different sensor locations could explain the concentration gap. Regular short injections of CO2 were necessary to maintain the optimal level, and stability was more important than the absolute level itself.
Recovery Assays
While stability assays were used to study the ability of the incubator to maintain optimal conditions for cell growth inside the chamber, the purpose of recovery tests were to analyze the behavior of the Autocell 200® when external disruptions occurred, such as door or gate openings. Figures 4, 5, 6, and 7 show what happened at different opening frequencies in an empty incubator.

Temperature recovery after opening events.

Recovery of temperature after gate openings (details).

Relative humidity recovery after opening events.

CO2 recovery after opening events.
Temperature: As shown in Figure 4, a 30-s door opening induced a drop of the central temperature for several seconds by an amount between 7 °C (bottom of the carousel) and 3.5 °C (upper level). After closing, temperature recovered 95% of its initial level within a period of 20 to 60 s, but it often required more than 15 min to recover completely. There was very little overshoot (less than 0.2 °C). This performance is comparable to traditional water-jacketed incubator specifications, like those of the IGO 150®.
Seven-second robotic gate openings every 1 to 3 min did not induce such a heat loss (Fig. 5). Temperatures never dropped lower than 95% of the initial setpoint, and no recovery time could be determined, even with an additional open time of more than 1 min and 30 s. Thirty consecutive gate openings, with an additional open time of 3 min and 25 s, also did not push the central temperature beneath the tolerance limit. The minimum temperature observed was 36.77 °C at the top of the carousel.
Relative humidity: Likewise, the RH level underwent a significant decrease when the doors were opened (Fig. 6). In the first assay, a 42.7% drop was detected. In the second assay, the drop was smaller, at about 30.6%. The time to recover 95% of the initial value was observed at 3 min (assay 1) and 4 min (assay 2). No significant overshoot was recorded.
Gate openings did not induce significant losses in humidity: a maximal fall of 1.16% was obtained with 30 consecutive transfers through the gate and did not drop beneath the tolerance limit of about 92%. For lower throughputs, RH was similar to isolated gate openings, with insignificant decreases (from −0.3 to −0.6%).
CO2 : CO2 has a very high diffusivity and is found in the atmosphere in small amounts (less than 0.2% in breathable air). This parameter was the most sensitive to a 30-s door opening, and in both assays, CO2 levels fell from 5.3% to less than 0.2% (Fig. 7). All of the excess CO2 gas contained in the chamber diffused away, requiring 11 to 12 min to return to the acceptable lower limit of 5.10%. It took approximately 15 min to recover to the initial set point level, followed by a small overshoot of less than 0.2%.
Because of the rate of CO2 diffusion, 30 consecutive gate openings (equivalent to 3 min and 49 s of added open time) induced a significant fall of 0.57%, which caused the CO2% to fall below the acceptable lower limit of 5.15%. The time to recover to the lower limit, as measured from the last gate closing, was about 2 min, while the CO2 level remained under the original set point for 12 min. Figure 7 illustrates recovery stages resulting from CO2 injections of variable length and intensity.
Biological assay: The growth of Hela and 293 cells is shown in Figure 8. After an initial 3-day culture, the cells were trypsinized twice a week and plated again at 2.5 × 10⁵ cells per well. The total number of cells was estimated after trypsinization. After 7 days in culture, the number of Hela cells in the Autocell ranged between 27 × 106 and 29 × 106, whereas cell number in the reference CO2 incubator was 22 × 106. After 30 days, the cell number values were very close, ranging from 15.2 × 10⁶ to 17.2 × 10⁶ cells, regardless of the incubator and the position within the Autocell. The viability of Hela cells was >93% in all plates.

Biological assays: HeLa and 293 cell growth in the Autocell 200.
For 293 cells, the values were very close after 7 days of culture: −25 × 106 in the IGO 150 as compared to 24 × 106 to 27 × 106 in the Autocell. After 30 days, the number of 293 cells was slightly higher in the IGO 150 as compared to the robotic unit. The viability of the 293 cells was in the range of 70 to 85%, with no difference observed between the incubators. Statistical analysis performed using Student's t-test demonstrated that there was no significant difference between the performance of the AutoCell and the IGO150 during the 30 days of culture.
Practicability
Installation: The Autocell 200 is a compact piece of equipment that can be integrated easily into a laboratory environment. For monthly maintenance purposes, however, the external door must be opened completely to allow 180° of free workspace around it. The position of the automatic door at the backside of the instrument is very convenient for routine uses.
User manual: The user manual could be improved with drawings or a CD-ROM with animated pictures showing how to handle the mechanical parts of the incubator.
Noise: Noise was measured using a Chauvin Arnoux CDA 830 sound level meter. We measured a level of 36 dB, which was far below the 85 dB acceptable limit.
Alarms: Various parameters are monitored continuously and displayed on a panel located at the front of the instrument. An alarm sounds if any parameter drifts outside of acceptable limits. We suggest that the next version of the software include the ability to record alarms.
Maintenance: Two people are required to remove the carousel. Because some mechanical parts are impossible to disassemble, decontamination is performed using volatile products (hydrogen peroxide). Draining the water tank of the Autocell 200 manually creates a biohazard and should be done with a pump.
Consumables: We tested various microplates from Falcon, Greiner, and Nunc, and only the microplates from Nunc (Ref #163320) did not fit into the Autocell 200.
Discussion
We measured a frequency of plate loading at 150 per hour, and a frequency of plate unloading at 120 per hour. This is compatible with an external robotic handler. The mean time of robotic gate opening was measured at 7 s.
Regarding temperature control: without embedded sensors or other sophisticated equipment, circular cartography of the incubator is a critical and tedious operation that would be difficult to perform routinely. For regular or continuous control applications, central thermal analysis is a good alternative due to the simplicity of the thermocouple installation. One thermocouple lead can be suspended from the top of the chamber, although care must be exercised to ensure it is not disturbed by stackers or by robotic components. Results are comparable to those obtained using thermocouples positioned in the proximity of stored microplates. The impact of short opening events must take into account the thermal inertia of the culture media, which dampens variations in climate parameters.
The small gate opening limits climate disturbances in the incubator. For temperature and humidification, recovery difficulties are nonexistent. Because of the disturbances in CO2 concentrations, opening frequencies of greater than 1 min are advisable and compatible with most large-scale cell culture operations.
The results of biological assays showed no significant differences between the automated incubator and a traditional manual incubator. In addition, there were no differences between the various positions in the carousel. A long-term study would be necessary to investigate bacterial contamination and the efficiency of decontamination procedures. After taking into account the excellent temperature, humidity, and CO2 stability that results from the use of an automatic door, we concluded that automation can provide meaningful benefits for cell culture. These benefits are achieved when the automated incubator is integrated as a module in a fully automated cell culture system.