
Abstract
Few studies have examined birth order effects on personality in countries that are not Western, educated, industrialized, rich, and democratic (WEIRD). However, theories have generally suggested that interculturally universal family dynamics are the mechanism behind birth order effects, and prominent theories such as resource dilution would predict even stronger linear effects in poorer countries. Here, we examine a subset of up to 11188 participants in the Indonesian Family Life Survey to investigate whether later-borns differ from earlier-borns in intelligence, educational attainment, Big Five, and risk aversion. Analyses were performed using within-family designs in mixed-effects models. In model comparisons, we tested for linear and non-linear birth order effects as well as for possible interactions of birth order and sibship size. Our estimated effect sizes are consistent with the emerging account of birth order as having relatively little impact on intelligence, Big Five, and risk aversion. We found a non-linear pattern for educational attainment that was not robust to imputation of missing data and not aligned with trends in WEIRD countries. Overall, the small birth order effects reported in other studies appear to be culturally specific.
Introduction
Balinese names immediately reveal a person’s birth order: first-borns are called Wayan, second-borns Made, and so on. Given the everyday salience of sibling ranks, one might expect particularly pronounced birth order effects in Bali. However, previous birth order research on outcomes such as intelligence, educational attainment, and personality has almost exclusively focused on ‘WEIRD’ populations—populations from Western, educated, industrialized, rich, and democratic countries (Heinrich, Heine, & Norenzayan, 2010). In helping to understand human universality and variability, researchers need to move the focus from WEIRD samples to more diverse populations (Rad, Martingano, & Ginges, 2018).
Prominent theoretical accounts of birth order effects like resource dilution (Blake, 1981), the confluence model (Zajonc & Markus, 1975), and the family niche model (Sulloway, 1996) have taken no explicit stance on the potential for cultural specificity. The resource dilution theory focuses on the fact that with each additional child, parental resources are shared among more offspring. While the first-born child can enjoy undiluted parental resources until a sibling arrives, later-borns have to share from the very start—thus receiving less support for their intellectual development. This is thought to lead to a decrease in intelligence by birth order position (Blake, 1981). The confluence model argues that earlier-born children grow up in a more stimulating intellectual environment than their younger siblings because first-borns interact mostly with adults in their early development phase, leading to a decrease in intelligence by birth order position (Zajonc & Markus, 1975). The family niche model assumes that siblings compete for parental investment (Trivers, 1985) and therefore develop strategies to increase parental attention by trying to fill different niches in one family (Sulloway, 1996). The first-born takes the traditional niche resulting in higher values in neuroticism, conscientiousness, the intellectual aspects of openness, and the dominance aspect of extraversion. The second-born takes the rebellious niche, resulting in higher values in agreeableness, the sociability aspect of extraversion, and unconventional aspects of openness (Sulloway, 2001).
These theories do not discuss potential influences by culture and instead seem to imply universal family dynamics. This suggests that birth order effects should not be specific to WEIRD populations; otherwise, one would have to conclude that family dynamics are less universal than assumed. In fact, explanations like resource dilution would predict even stronger linear birth order effects when families are large and resources are few. Non-WEIRD populations would therefore offer the most favourable conditions for detecting linear birth order effects due to resource dilution.
The Republic of Indonesia—the world’s largest island country—is located in Southeast Asia. It is an interesting source for studying birth order effects not only because it is the world’s fourth most populous country and the most populous Muslim-majority country but also because it is home to a very diverse population that differs from the WEIRD samples on which theoretical accounts of birth order effects were based. In 2015, the estimated population was about 258 million people (median age: 28.4 years, 49.65% female), with a total fertility rate of 2.5 children per woman and a life expectancy of 68.6 years (United Nations, 2015). In 2010, 87.18% of the total population was Muslim, 9.87% was Christian, 1.69% was Hindu, 0.72% was Buddhist, and 0.54% believed in another religion or did not believe in any religion (Badan Pusat Statistik, 2010). According to the census, in 2010, there were over 300 ethnic groups in Indonesia. Of the total population, 40.22% was Javanese, 15.50% was Sundanese, and 44.28% belonged to one of many other ethnic groups (each less than 5%; Badan Pusat Statistik, 2010). Based on data from the UNESCO Institute of Statistics, the literacy rate in 2015 for people aged 15 years and older was 95.40%, and the mean number of years in school was 7.9 (United Nations Educational, Scientific and Cultural Organization, 2015).
Previous findings regarding birth order effects
Intelligence and educational attainment
Effects of birth order on intelligence, educational attainment, Big Five personality traits, and risk aversion have been studied extensively. The clearest evidence has emerged for intelligence and educational attainment. Several studies showed a slight decline in intelligence from earlier-borns to later-borns (first study to show these results: Netherlands: Belmont & Marolla, 1973; other recent studies include Germany, Great Britain, and the USA: Rohrer, Egloff, & Schmukle, 2015; Norway: Bjerkedal, Kristensen, Skjeret, & Brevik, 2007; Black, Devereux, & Salvanes, 2011; Sweden: Barclay, 2015a; and the USA: Heiland, 2009; but see also Wichman, Rodgers, & MacCallum, 2006, and Damian & Roberts, 2015, for a critical assessment of the relevance of these effects). Likewise, several studies suggest a corresponding decline in educational attainment from earlier-borns to later-borns (e.g. Germany: Härkönen, 2014; Great Britain: Booth & Kee, 2009; Norway: Black, Devereux, & Salvanes, 2005; Kristensen & Bjerkedal, 2010; Sweden: Barclay, 2015b; and the USA: Behrman & Taubman, 1986; De Haan, 2010; Kantarevic & Mechoulan, 2006).
However, all of the previously cited studies used samples from WEIRD countries. For non-WEIRD countries, the evidence is more mixed. Regarding birth order and intelligence, studies have reported negative effects (Indonesia: Calimeris & Peters, 2017 1 ; Kenya: Munroe & Munroe, 1983; and Zimbabwe: Wilson, Mundy-Castle, & Panditji, 1990), a parabolic relationship (Colombia: Velandia, Grandon, & Page, 1978; and Israel: Davis, Cahan, & Bashi, 1977), or no effects at all (Kuwait: Abdel-Khalek & Lynn, 2008; see Table S1 for a more detailed summary of these studies). Regarding birth order and educational attainment, studies have reported both parabolic (Turkey: Dayioglu, Kirdar, & Tansel, 2009) and positive relationships (Bangladesh: Park & Chung, 2012; Brazil: Emerson & Souza, 2008; the Philippines: Ejrnæs & Pörtner, 2004; and 12 African countries: Tenikue & Verheyden, 2010; for more information, see Table S1).
Big Five personality traits
Although there is empirical support for some of the effects of birth order on the Big Five that are predicted by the family niche model on the basis of WEIRD samples (e.g. Belgium: Saroglou & Fiasse, 2003; Canada: Paulhus, Trapnell, & Chen, 1999; New Zealand: Healey & Ellis, 2007; and the USA: Michalski & Shackelford, 2002), a reconstruction of Sulloway’s (1996) meta-analysis could not replicate the empirical patterns it found (Townsend, 2000). In line with this failure to replicate, more recent studies with large sample sizes resulted in at best weak support for the family niche model. For example, in a sample of 377 000 US high school students, Damian and Roberts (2015) found that first-borns tended to be more conscientious, less agreeable, and higher in the dominance aspect of extraversion. However, the correlations found in this study were very small (r = .02 on average), which led the authors to conclude that effects of birth order on Big Five personality traits were negligible. In a study combining data from Germany, the USA, and Great Britain (n = 20 186), Rohrer et al. (2015) found that birth order did not have a significant effect on extraversion, neuroticism, conscientiousness, or agreeableness but reported a negative effect of birth order on intellect, which is in line with findings regarding intelligence and educational attainment. The overall evidence for birth order effects on the Big Five in WEIRD countries suggests that they are at best weak. In contrast to this vast body of literature, there is little research on the effects on the Big Five in non-WEIRD countries. Previous studies were limited to India, only considered very specific outcomes, and used comparably small samples (Begum, Banu, Jahan, & Begum, 1981; Kaur & Dheer, 1982; Sethi & Gupta, 1973; Sharma, 1987; Table S1).
Risk taking
Moving beyond the Big Five, there is some support for a positive effect of birth order on risk taking based on WEIRD samples (the USA: Argys, Rees, Averett, & Witoonchart, 2006; Averett, Argys, & Rees, 2011; meta-analysis: Sulloway & Zweigenhaft, 2010). However, Eisenman (1987) stated that first-born males tended to choose the riskier option, and Wang, Kruger, and Wilke (2009) noted that the relationship between birth order and risk preference differed for varying risk domains. Both studies used samples from the USA. A recent study based on three large samples (two German samples and an international database of explorers and revolutionaries) found no robust effect of birth order on risk taking (Lejarraga, Frey, Schnitzlein, & Hertwig, 2019). To our knowledge, no evidence for or against birth order effects on risk taking or risk aversion in non-WEIRD populations exists.
The current study
Birth order effects in WEIRD countries have been investigated extensively, but little is known about whether similar patterns (i.e. effects on intelligence and educational attainment and lack of strong effects on Big Five) occur in the rest of the world. Because recent birth order research suggests that at least some of the confusion about the effects of birth order on the Big Five had to do with suboptimal methods (risk of overfitting owing to small samples, flexible model specification, and post hoc theorizing; see Rohrer, Egloff, & Schmukle, 2017), it seems wise to implement best practices to avoid these potential pitfalls. In our study, we aim to fill the research gap regarding birth order outside of the WEIRD world while adhering to best practices in birth order research. We ensured that all analyses were straightforward and comparable with recent work on WEIRD populations, applied appropriate control for sibship size, and conducted extensive robustness checks. On the basis of the assumption that previously reported birth order effects generalize, we predicted that intelligence, educational attainment, and intellect decrease with higher birth order while extraversion, neuroticism, conscientiousness, agreeableness, and risk aversion remain unaffected. Analyses were not preregistered; however, they are fully in line with earlier studies on the topic (Rohrer et al., 2015), and extensive robustness checks are \provided.
Method
Data
Our data come from RAND’s Indonesian Family Life Survey (IFLS), an ongoing longitudinal study with 50 148 individuals living in Indonesia. Since 1993, five waves have been administered (Frankenberg & Thomas, 2000; Strauss et al., 2000; Strauss, Witoelar, & Sikoki, 2016; Strauss, Witoelar, Sikoki, & Wattie, 2009). For the first wave, a sample of households that represented about 83% of the Indonesian population was approached. In the following waves, every household and all split-off households were contacted. All analyses reported in this study were run on data based on this representative national panel study. We therefore had no control over the exact sample size, but with N = 11 188, the sample size is comparable with or even larger than samples from recent literature on birth order effects.
In each wave, women aged 15 to 49 answered questions about their pregnancy and marriage history. These questions included information about the number and order of pregnancies as well as the gender and date of birth of each child. Overall, 15 983 women reported 49 868 pregnancies. Marriage history allowed us to approximately infer the identity of the father. Based on these data, we were able to construct full sibling order (based on the same mother and father) for 42 682 individuals.
Data sampling and exclusion criteria
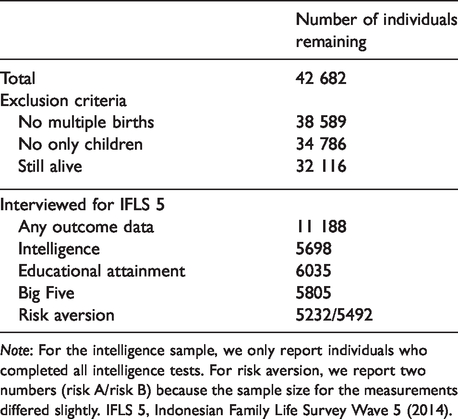
Note: For the intelligence sample, we only report individuals who completed all intelligence tests. For risk aversion, we report two numbers (risk A/risk B) because the sample size for the measurements differed slightly. IFLS 5, Indonesian Family Life Survey Wave 5 (2014).
Survey materials and data are openly available on the IFLS website (www.rand.org/labor/FLS/IFLS.html) (Frankenberg & Thomas, 2000; Strauss et al., 2000; Strauss et al., 2009; Strauss et al., 2016). The necessary datasets for reproducing our analyses are described on the Open Science Framework (https://osf.io/v2n6q/). All our analyses and code are documented on our website (https://laurabotzet.github.io/birth_order_ifls/) and available to download on the Open Science Framework. A codebook generated using the codebook package (Arslan, 2019) can be found athttps://laurabotzet.github.io/birth_order_ifls/2_codebook.html.
Outcomes
We included intelligence, educational attainment, personality, and risk aversion as outcomes in our main analyses. Additional analyses (detailed results reported on the Supporting Information) included income, self-employment, working category (e.g. unpaid family worker), working sector, and smoking behaviour as outcomes. All outcomes are based on the fifth wave of the IFLS. Continuous outcomes were z-standardized (M = 0, SD = 1) to make effect sizes easier to compare. For a detailed description of all outcomes, see Strauss et al. (2016).
Intelligence
Five intelligence subtests were conducted in the fifth wave of IFLS. All respondents aged 15 or older were asked to take part in these tests, which were as follows: (i) respondents answered a shortened version of a Raven’s matrices test that consisted of eight items. For each item, they were asked to identify the missing element out of six possible elements to complete a pattern. (ii) Respondents were asked to count backwards from 100 in steps of seven seconds. (iii) Respondents were given a delayed word recall test in which they heard a list of 10 nouns and had to recall as many words as possible four to five minutes later. (iv) Respondents were given an adaptive number series test in which they answered six out of 15 items. Each item showed a pattern of numbers with one missing value. Respondents had to name the missing number (e.g. ‘7–8–?–10’). The first three items were given to all participants. Based on the accuracy of the first three responses, a subsequent set of three items was chosen. A Rasch scoring model was used to identify a person’s ability for a given set of response patterns with varying difficulties; a composite score was calculated for each participant (Strauss et al., 2016). (v) All respondents aged 15 to 59 participated in a math test. Each respondent answered five multiple-choice questions measuring mathematical abilities (three mathematical calculations and two math text problems).
Years of education
Participants reported the highest educational level they had attended (elementary, junior high, senior high, and university) and the highest grade they completed at this educational level. Based on these items, we were able to reconstruct years of education.
Big Five personality traits
Personality was assessed with the Big Five Index 15 (BFI 15) for all respondents aged 15 or older. The BFI 15 is based on the Big Five Inventory-SOEP (Schupp & Gerlitz, 2008), which in turn is a short version of the Big Five Inventory and precludes examining single personality facets (e.g. intellect). All 15 items started with the phrase ‘I see myself as someone who …‘Three items were asked for each of the Big Five personality dimensions: extraversion (e.g. ‘… is talkative’), neuroticism (e.g. ‘… worries a lot’), conscientiousness (e.g. ‘… does a thorough job’), agreeableness (e.g. ‘… is considerate and kind to almost everyone’), and openness (e.g. ‘… is original, comes up with new ideas’). Participants expressed their agreement on a 5-point Likert scale (from 1 = ‘disagree strongly’ to 5 = ‘agree strongly’). The BFI 15 is used in many large-scale surveys; in this case, the items were simply translated into Indonesian (details provided in Strauss et al., 2016). An earlier study by Wibowo, Yudiana, Reswara, and Jatmiko (2017) using the 44-item Big Five Inventory showed sufficient reliability (Cronbach’s alpha ranged between .69 and .85) but limited validity (exploratory factor analysis revealed eight instead of five factors) in an Indonesian sample.
Risk aversion
Risk aversion was assessed with an adaptive hypothetical lottery choice task for all respondents aged 15 or older. Analyses of the Mexican Family Life Survey had suggested that hypothetical lotteries yield similar results to lotteries that are paid out (Hamoudi, 2006). Two different sets of questions, A and B, were asked (randomized order across participants). The sets differed in the amount of the payoffs and the variance of their expected payoffs. Set B’s certain payoffs were higher than Set A’s. The uncertain payoffs in Set B had higher coefficients of variation than did those in Set A, reflecting a higher risk–reward ratio (for a more detailed description, see Ng, 2013). Many participants gave inconsistent responses across the two tasks, and current research suggests that lottery tasks may be poor measures of individual differences in risk preferences compared with self-reports (Frey, Pedroni, Mata, Rieskamp, & Hertwig, 2017).
Additional outcomes
To further investigate the effects of birth order on additional outcomes, we included income in the last year, self-employment (0 = no, 1 = yes), smoking behaviour in the last year (0 = no, 1 = yes), category of work (six categories: casual worker in agriculture; casual worker not in agriculture; government worker; private worker; selfemployment; and unpaid family worker; 0 = no, 1 = yes), and sector of work (eight sectors: agriculture, forestry, fishing, and hunting; construction; electricity, gas, and water; finance, insurance, real estate, and business service; manufacturing; mining and quarrying; social services; and transportation, storage, and communication; 0 = no, 1 = yes). All of these outcomes were assessed in the fifth wave of the IFLS.
Analysis
Birth order and sibship size were calculated for full sibships (same father and mother) based on the maternal reports of pregnancy and marriage history of all women aged 15–49 who participated in an IFLS wave. In all models, we adjusted for the categorical effect of sibship size (effects of sibship size 2, 3, 4, 5, and over 5), self-reported gender, a third-order polynomial for age, and a family random effect to account for dependencies within sibships. We then tested for a linear birth order effect, for non-linear effects (by testing categorical effects of birth order 1, 2, 3, 4, 5, and over 5), and for potential interactions with number of siblings and went on to iteratively compare models to see whether each model improved upon the preceding one. We also reported estimates and confidence intervals (CIs) of the birth order effects to further examine the influence of birth order on the outcomes and compare effect sizes with the existing literature.
We performed additional robustness analyses based on maternal sibships and maternal pregnancy order (including stillbirths), and we tested the effect of excluding all individuals in sibships bigger than five. Furthermore, we repeated all analyses after multiple imputation (for details, see the following section, Handling missing data). We state where results changed depending on the analysis approach and report all robustness analyses on the website.
We reported the results of our model comparisons for each outcome based on full sibling order. Because of the number of outcomes and owing to calls for more stringent significance cut-offs in empirical science, we set the significance threshold to .005 (Benjamin et al., 2017). We summarize results here briefly and report them in full online (https://laurabotzet.github.io/birth_order_ifls/4_analyses.html).
All analyses were conducted in R, version 3.3.3 (R Core Team, 2013). We conducted within-family analyses by running mixed-effects models using the lme4 package version 1.1–12 (Bates, Machler, Bolker, & Walker, 2015).
Handling missing data
Like other large panel studies, the IFLS had systematic missing data. Some questions were only answered by a subset of participants (depending on age), some participants were absent for one of the waves, some mothers did not fill out the pregnancy questionnaire that we used to ascertain birth order, and some missing data were due to panel mortality. To impute birth order for individuals whose mothers had not filled out the pregnancy questionnaire, we computed variables, which we called ‘naive birth order’ and ‘naive sibling count’. This was simply the order according to birth year by people reporting the same mother. Pre-imputation analyses showed high agreement between the naive birth order and the full sibling order [r = .91, 99.5% CI (.90, .91)], although systematic missing data are likely.
Following Grund, Ludtke, and Robitzsch (2017), we performed multiple imputation for multilevel data on all individuals who were older than 14 and had data for at least two outcomes (usually years of education and intelligence tests in a previous wave). We included the identity of the mother as a grouping variable, a third-order polynomial for age, and the categorical interaction between sibling order and birth order. We let all variables that were correlated r > .05 predict each other (see Table S2 for a list of all variables included and https://laurabotzet.github.io/birth_order_ifls/3_imputation.html for detailed code). To impute full birth order and sibling order from naive birth order and naive sibling order, we used the linear variables to regenerate the categorical interaction and ensured consistency (e.g. no sibling counts smaller than the birth order maximum). We used the R packages MICE package version 3.7.0 (Buuren & Groothuis-Oudshoorn, 2010) and pan package version 1.6 (Schafer, 1997) to impute the data. We generated 50 imputed datasets, ran all models 50 times, and aggregated estimates and standard errors using the mitml package version 0.3–7 (Grund, Robitzsch, & Lüdtke, 2018). To evaluate the quality of imputations, we examined intraclass correlations, density plots, and trace plots. For further information, see https://laurabotzet.github.io/birth_order_ifls/3_imputation.html.
Note on the usage of the term ‘effect’
To remain consistent with previous studies, and to avoid clumsy language, we will talk about birth order effects. However, it should be noted that the causal identification of birth order effects is a nontrivial issue that has not been addressed in the literature to date. While adjustment for family size can rule out certain obvious confounding backdoor paths (e.g. family socio-economic status may affect both personality and family size, which in turn affect the ratio of first-born to later-born children), other issues remain. For example, first-borns’ personality may affect their parents’ decision to have more children (Jokela, 2010); personality may therefore actually causally affect birth order position. Such effects could result in birth order differences in personality, which do not reflect birth order effects but rather the effect of children’s personality on family size. Furthermore, parental age at birth and birth order position within-families are per definition confounded. Thus, birth order effects might be entangled with effects of parental age (Arslan, Penke, Johnson, Iacono, & Mc Gue, 2014).
Results
Sample analysis
Our main sample of people for whom birth order could be computed differed systematically from those for whom the required information was missing. Our main sample was 25.31 years younger, and the percentage of females was 2 percentage points higher. The main sample was more intelligent (d = 0.82) and had more years of educational attainment (d = 0.82); it was also more extraverted (d = 0.09), more neurotic (d = 0.08), less conscientious (d = −0.19), and less agreeable (d = −0.13). It also scored higher on openness (d = 0.23) and showed differences in risk aversion with inconsistent signs across the two measures (decreased risk aversion for risk A: d = −0.10; increased for risk B: d = 0.08). These differences were all significant (all ps .001).
Intelligence g-factor
Based on the results of the Raven’s matrices test, the math test, the backwards counting task, the delayed word recall, and the adaptive number series from all individuals who took part in wave 5 of the IFLS, we computed a g-factor of intelligence. Using a sample of participants who completed all five of the intelligence tests in wave 5 regardless of whether birth order information was available (n = 27 526), we ran a confirmatory factor analysis expecting one factor. The g-factor explained 30% of variance on average in the five intelligence measurements (Raven’s matrices test: 42%, math test: 25%, backwards counting task: 20%, delayed word recall: 23%, and adaptive number series: 40%).
Descriptive statistics
Means, standard deviations, internal consistency, and correlation matrix for age, gender, intelligence, educational attainment, Big Five, and risk aversion
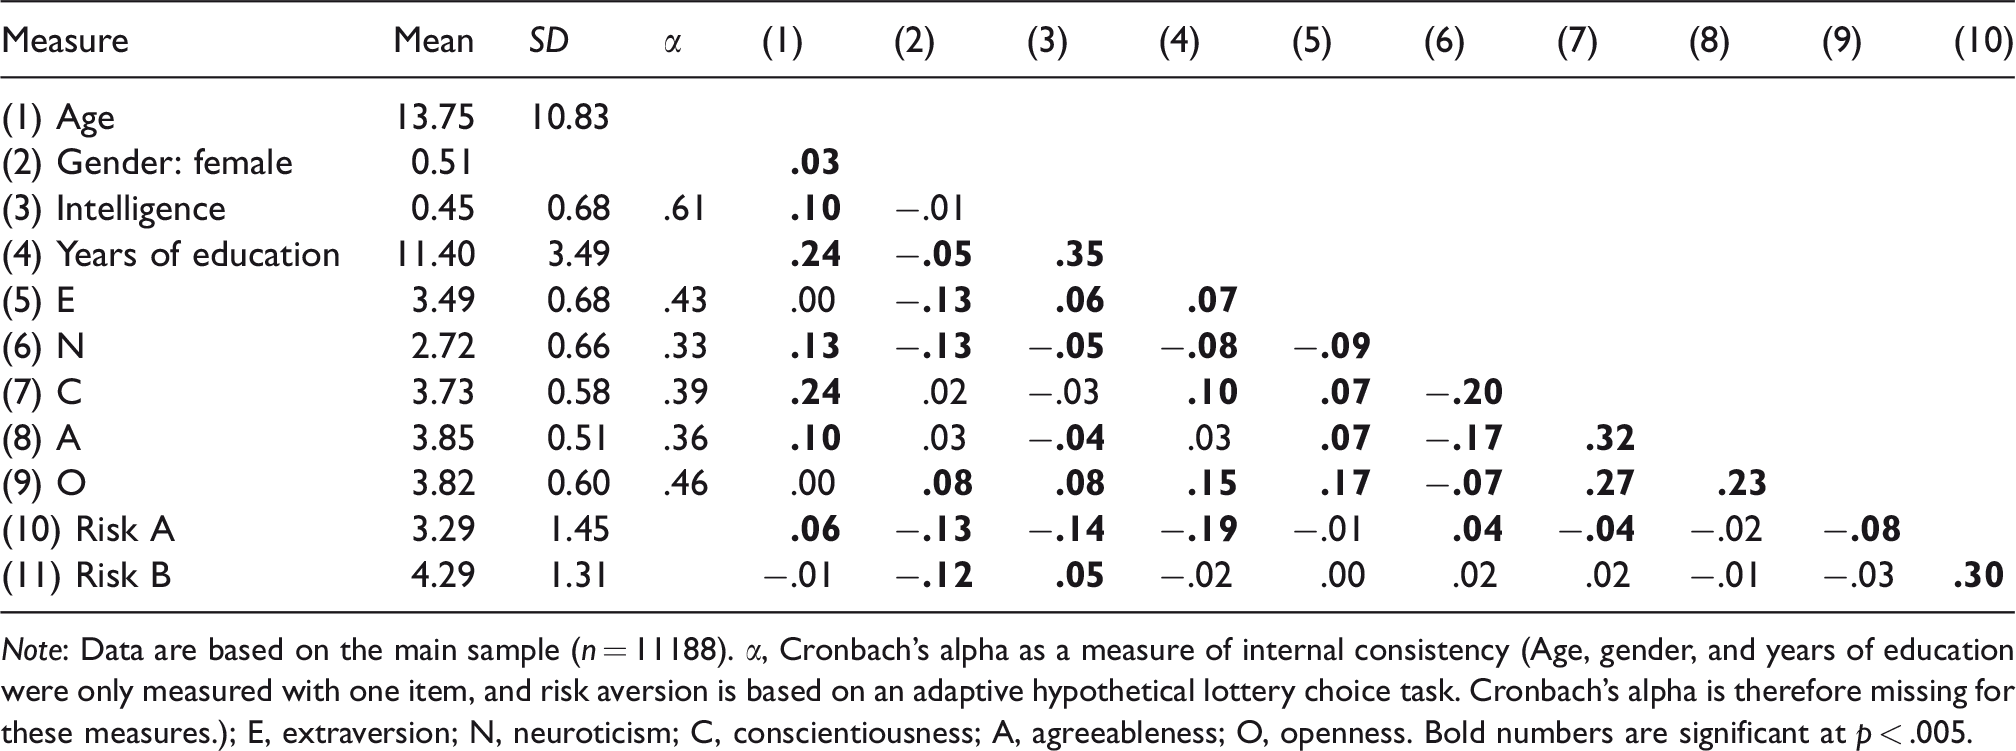
Note: Data are based on the main sample (n = 11188). α, Cronbach’s alpha as a measure of internal consistency (Age, gender, and years of education were only measured with one item, and risk aversion is based on an adaptive hypothetical lottery choice task. Cronbach’s alpha is therefore missing for these measures.); E, extraversion; N, neuroticism; C, conscientiousness; A, agreeableness; O, openness. Bold numbers are significant at p < .005.
Birth order effects
Model comparisons for birth order effects on intelligence, educational attainment, Big Five, and risk aversion
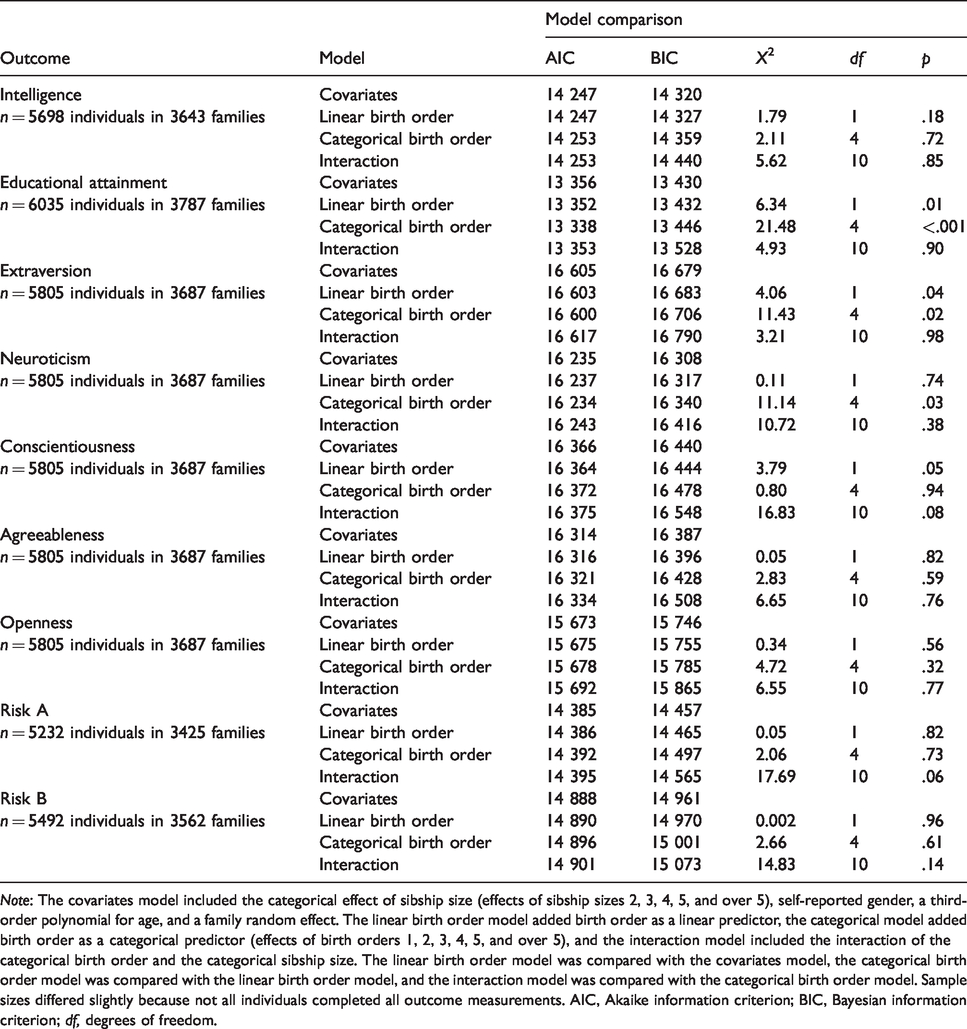
Note: The covariates model included the categorical effect of sibship size (effects of sibship sizes 2, 3, 4, 5, and over 5), self-reported gender, a third-order polynomial for age, and a family random effect. The linear birth order model added birth order as a linear predictor, the categorical model added birth order as a categorical predictor (effects of birth orders 1, 2, 3, 4, 5, and over 5), and the interaction model included the interaction of the categorical birth order and the categorical sibship size. The linear birth order model was compared with the covariates model, the categorical birth order model was compared with the linear birth order model, and the interaction model was compared with the categorical birth order model. Sample sizes differed slightly because not all individuals completed all outcome measurements. AIC, Akaike information criterion; BIC, Bayesian information criterion; df, degrees of freedom.
Figure 1
Effect size estimates in standard deviations for the linear effect of birth order. Effect size and 99.5% confidence intervals from linear mixed-effects models with the categorical effect of sibship size (effects of sibship sizes 2, 3, 4, 5, and over 5), birth order, gender, and a third-order polynomial effect of age as fixed effects and maternal identity as random effect are shown. The dotted line shows an estimate of the linear birth order effect on intelligence (d = −0.14), and the grey area shows the 99.5% confidence interval (−0.20, −0.07) based on a within-family analysis in a Western sample (Rohrer et al., 2015). [Colour figure can be viewed online]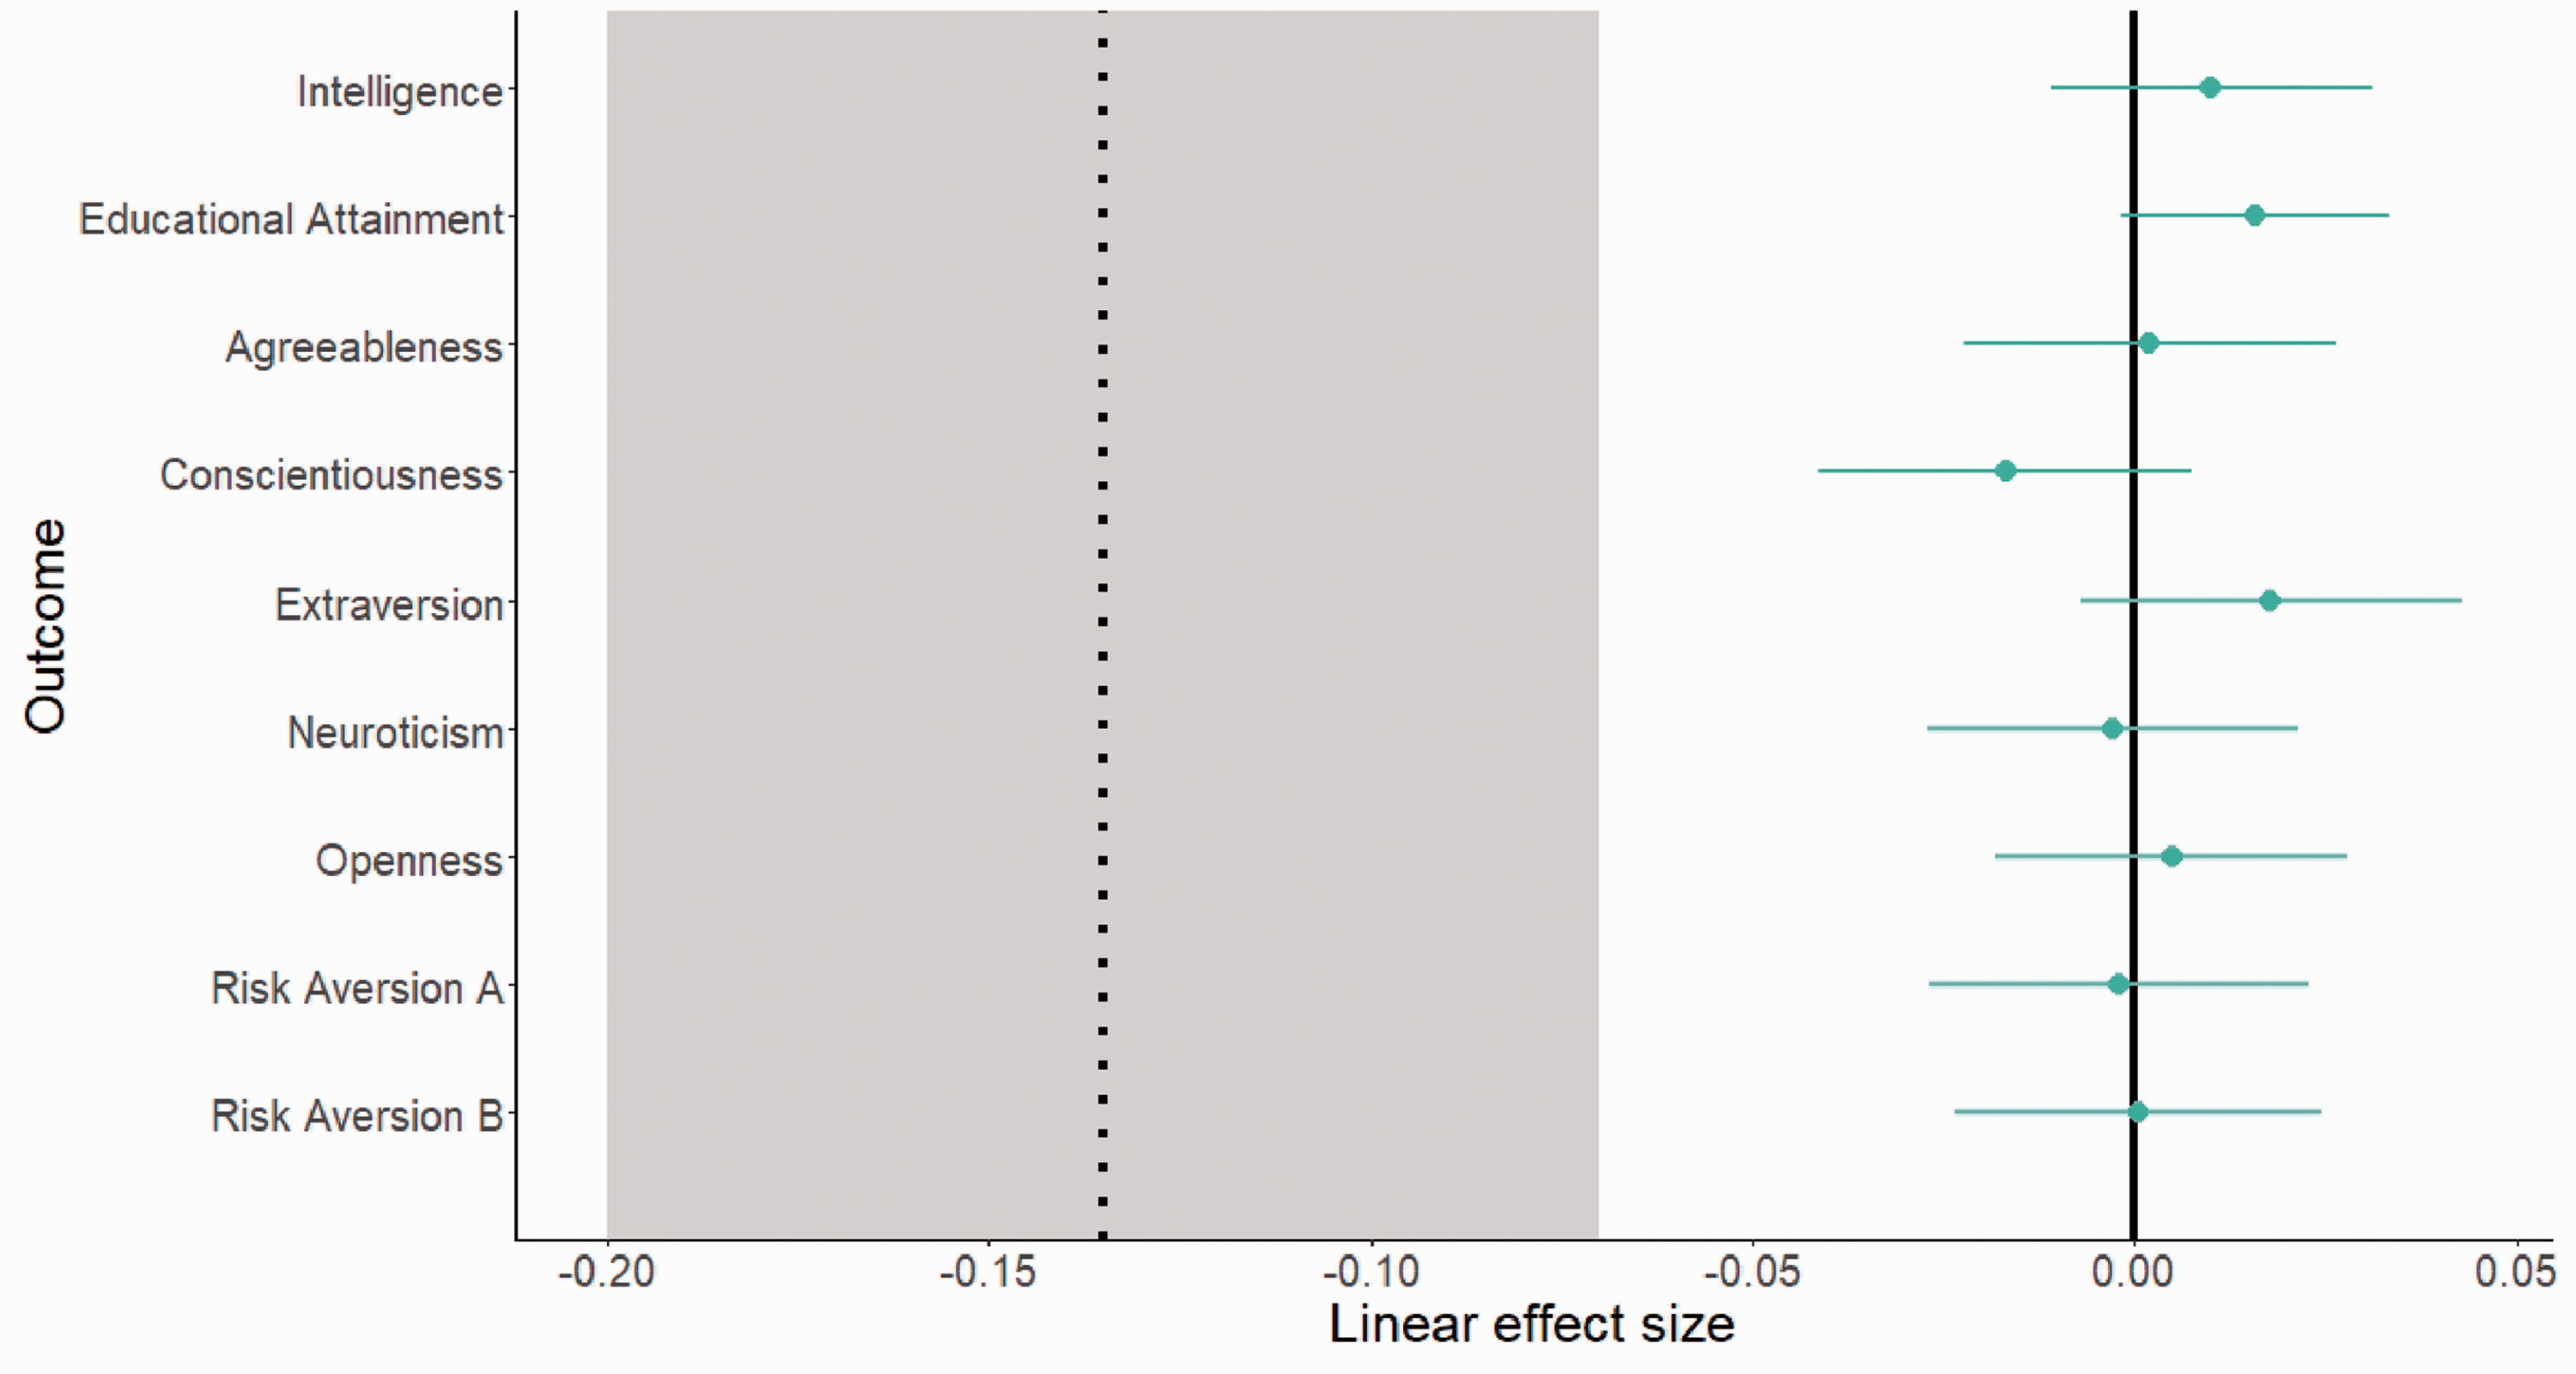
We found evidence for a non-linear effect of birth order on educational attainment [X2(4, N = 6035) = 21.48, p .001]. A closer look at the categorical effect showed a checkmark-shaped pattern, indicating the same amount of educational attainment for first-borns compared with second-borns [estimation of effect: −0.06, 99.5% CI (−0.12, −0.005)], third-borns [0.02 (−0.06, 0.09)], and fourth-borns [0.09 (−0.01, 0.19)]. Fifth-borns had more educational attainment compared with first-borns [0.14 (0.01, 0.26)]. Differences between first-borns and sixth-borns and later-borns were not significant [0.08 (−0.05, 0.21)].
Including the interaction of sibship size and birth order as a predictor did not improve any of the models significantly (all ps > .06). Figure 2
Interaction effects of sibship size and birth order position on intelligence, educational attainment, Big Five, and risk aversion. Predicted mean scores and 99.5% confidence intervals from linear mixed-effects models with sibship size, birth order, gender, and a third-order polynomial effect of age as fixed effects and maternal identity as random effect are displayed for (a) intelligence, (b) educational attainment, (c) extraversion, (d) neuroticism, (e) conscientiousness, (f) agreeableness, (g) openness, and (h, i) risk aversion. All outcome measurements are z-standardized based on the full sample. Numbers in parentheses show sample size. [Colour figure can be viewed online]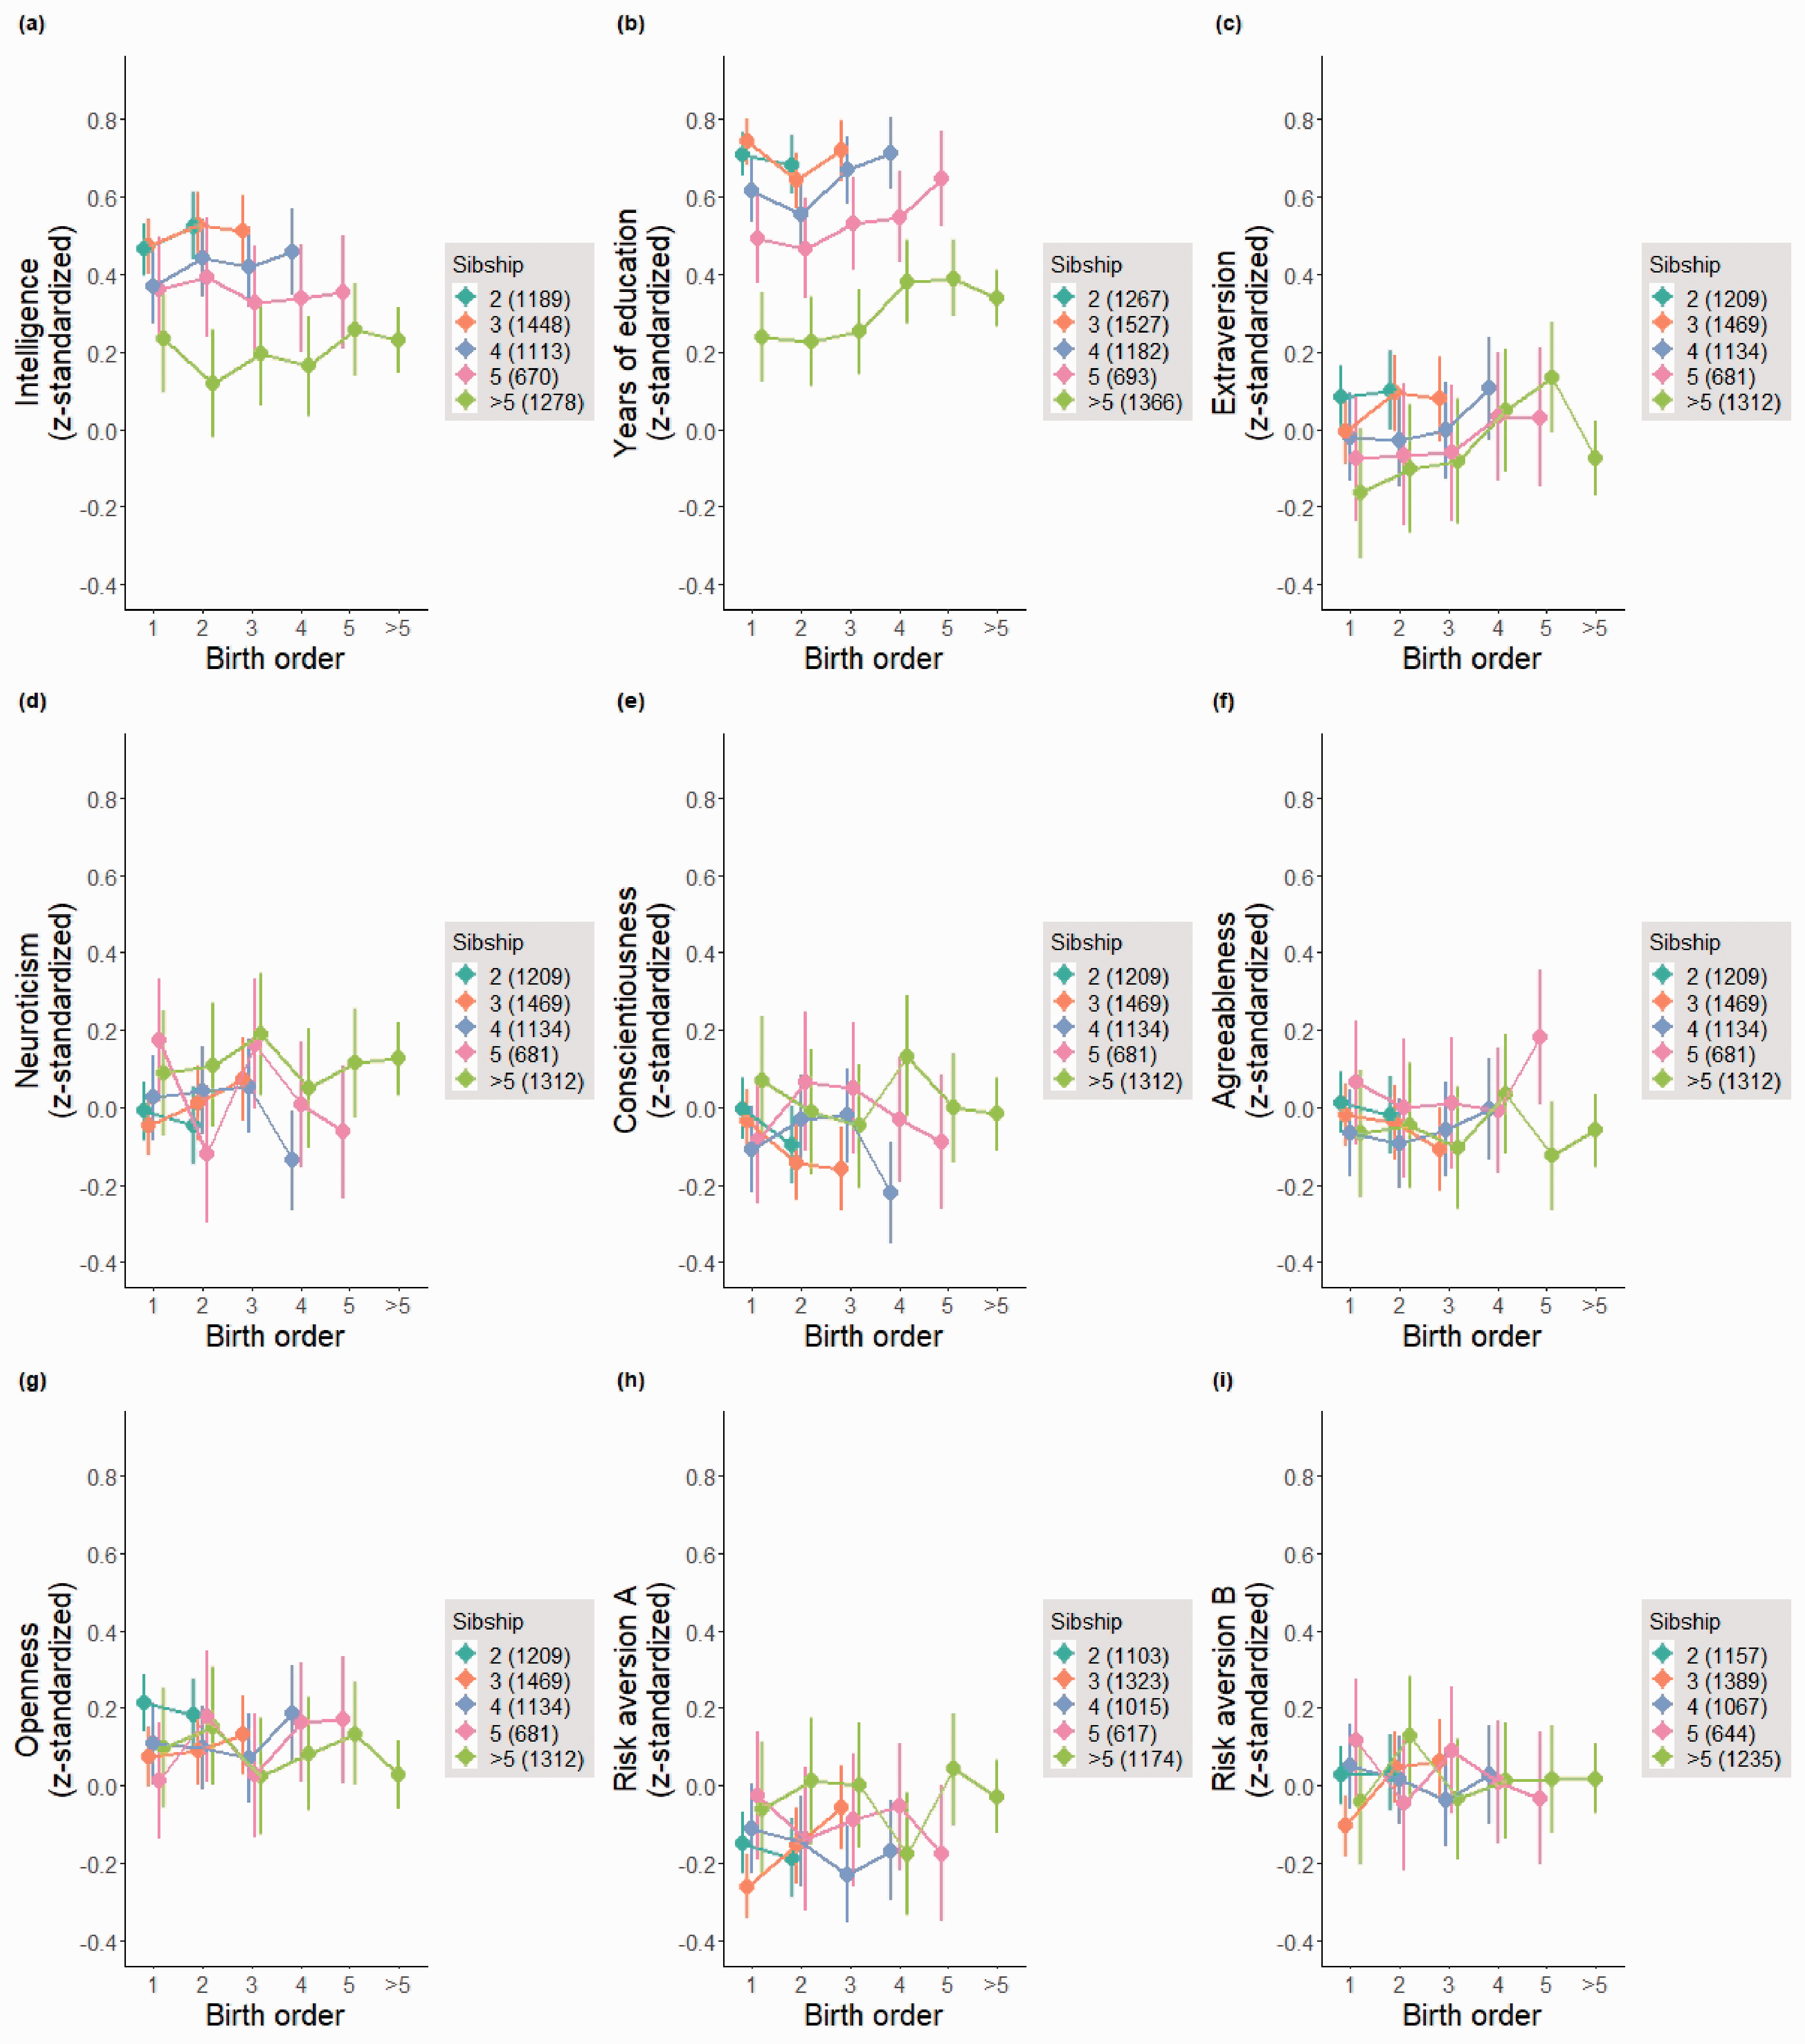
Additional analyses showed no significant effects of birth order on income (linear compared with covariates-only model: p = .51, categorical compared with linear model: p = .30, and interaction compared with categorical model: p = .56), self-employment (linear: p = .80, categorical: p = .86, and interaction: p = .62), and smoking behaviour (linear: p = .9996, categorical: p = .54, and interaction: p = .65). We found no birth order effects in the seven analyses on working category (linear: all ps > .26, categorical: all ps > .32, and interaction: all ps > .17) or in the eight analyses on working sector (linear: all ps > .14, categorical: all ps > .06, and interaction: all ps > .40). Sample sizes for some of these analyses might have been too small to detect birth order effects (income: n = 2477, self-employment: n = 3763, smoking behaviour: n = 6104, working category: n = 3763, and working sector: n = 3610). For more details on additional outcomes, see Table S3 and https:// laurabotzet.github.io/birth_order_ifls/4_analyses.html.
Additional robustness analyses based on maternal sibship and maternal pregnancy order did not differ from the analyses reported here. For all details on the robustness analyses, see https://laurabotzet.github.io/birth_order_ifls/4_analyses_ robust.html. All analyses based on the imputed dataset yielded nonsignificant results (all ps .27). Contrary to our main analyses, we found no evidence for either a linear or a non-linear effect of birth order on educational attainment (linear compared with covariates-only model: p = .45, and categorical compared with linear model: p = .96). All details for the analyses based on the imputed dataset can be found online: https://laurabotzet.github.io/birth_order_ifls/4_analy-ses_imputed_data.html.
Discussion
We found no birth order effects on intelligence, agreeableness, conscientiousness, extraversion, neuroticism, openness, or risk aversion, regardless of whether we included birth order as a continuous or categorical predictor, or whether we considered its interaction with sibship size. Model comparisons supported a small non-linear effect of birth order on educational attainment in the form of a checkmark-shaped pattern. However, this effect did not emerge when missing values were imputed.
Our results were consistent with null effects on agreeableness, conscientiousness, extraversion, neuroticism, and risk aversion found in WEIRD populations (Damian & Roberts, 2015; Lejarraga et al., 2019; Rohrer et al., 2015). Yet we found no effect of birth order on either intelligence or openness, in contrast to the small negative estimates reported for WEIRD populations (Barclay, 2015b; Damian & Roberts, 2015; Rohrer et al., 2015; Rohrer et al., 2017). In terms of educational attainment, our results were sensitive to the imputation of missing data; interpreting these results therefore requires caution. In WEIRD samples, higher birth order is related to lower educational attainment (Black et al., 2005; Booth & Kee, 2009; Härkönen, 2014; Kristensen & Bjerkedal, 2010), even in fully adopted sibling groups (Barclay, 2015b). However, in this Indonesian sample, higher birth order was related to higher educational attainment, if there was any association at all.
Our results are inconsistent with predictions from Blake’s (1981) resource dilution model, the confluence model (Zajonc & Markus, 1975), and Sulloway’s (1996) sibling roles. These theories made no allowance for fundamental cultural differences in family dynamics. Indonesia is poorer country than most previously studied countries, and its families are larger—Indonesian families, therefore, distribute fewer resources among more offspring. The resource dilution hypothesis would suggest that birth order effects, whatever their specific shape, are amplified in Indonesia; on this view, when resources are scarce, any additional investment leads to larger increases in returns, making any preferential allocation of resources more consequential. Observed effects fell short of initial predictions from theories on family dynamics that were based on the largest, best evidence available in the WEIRD world. It is therefore appropriate to look for other explanations. Perhaps birth order influences the social and parental expectations for first-born children in some countries, through remnants of Western cultural norms like primogeniture, or through policies such as parental leave (Barclay, 2015b). Children’s traits may then adapt due to external influences on their educational and occupational choices, such as a parent expecting a first-born to take over the family business (Barclay, Hällsten, & Myrskylä, 2017). This sort of indirect effect would be consistent with the small average birth order effects that are generally observed, as well as with the absence of those effects in a culturally different country.
It is important to note that our main sample of people for whom birth order could be computed differed systematically from those for whom the required information was missing. The large differences in intelligence and educational attainment are in part due to age differences. The main sample for whom birth order could be computed was 25 years younger than the rest of the sample, likely because birth order could only be computed for individuals whose mother took part in one of the waves of the IFLS, whereas outcome measurements were available for all participants. In the full sample, age correlated negatively with intelligence (r = −.39, p .001) and educational attainment (r = −.39, p .001); differences in intelligence and educational attainment might therefore actually reflect age differences. The main sample was 0.59 (0.58, 0.60) standard deviations more intelligent and attained 3.11 (3.06, 3.17) more years of educational attainment on average. Controlling for a third-order polynomial effect of age and a linear effect of our naive sibship size measurement reduced the adjusted mean differences to 0.33 (0.32, 0.33) standard deviations for intelligence and 1.94 (1.93, 1.96) years of educational attainment. Because the effects of interest for this study—namely, birth order effects—are within-family effects and because we controlled for potential age effects, the potential issues introduced by this discrepancy might not be grave. Nevertheless, generalizability of our findings might be limited to the younger, more intelligent, more educated Indonesian generation. The checkmark pattern that emerged for education should be interpreted with particular caution because it was not reproduced in the analyses of the multiple imputed datasets. This difference may reflect model error in the imputation or a lack of generalizability to the full sample.
In our data, we found no evidence for birth order effects on various outcomes related to type of employment and work sector, corroborating the emerging narrative that birth order is generally not an important predictor of life outcomes.
Limitations
Because of limitations of the available data, there are several alternative explanations in favour of the existence of birth order effects that we could not rule out.
First, the study population was limited. Our analyses of intelligence, educational attainment, Big Five, and risk aversion do not include individuals younger than 15 years—but according to Sulloway (2010), effects of birth order on personality should be especially visible during childhood and adolescence. Thus, we cannot rule out that we missed substantial birth order effects among younger Indonesians; we can only say that if they had existed, they had dissipated with age. Furthermore, the conclusions of our study are limited to present-day Indonesia and do not necessarily generalize to other (WEIRD or non-WEIRD) countries or across time. While the absence of birth order effects in present-day Indonesia casts doubt on broad theories that claim that such effects emerge universally, it does not rule out the possibility that birth order effects emerge under different societal conditions.
Second, the outcome measures were limited. Intelligence was measured with a g-factor based on different subtests with no particular theoretical background and comparatively low reliability (Cronbach’s alpha = .61, average explained variance: 30%). Even though there is evidence that g-factor batteries correlate highly with each other despite measuring different mental abilities (Johnson, Bouchard, Krueger, McGue, & Gottesman, 2004), the reduced reliability might have impacted results. Given that we standardized the personality and intelligence outcomes, the limited reliability of our measurements probably attenuated the estimated effects. However, previous work on WEIRD samples was usually based on similarly short tests; our effect sizes are therefore comparable with the existing literature. The attenuation implies that our 99.5% CIs should be interpreted with care and considered in the context of the reliability of the outcome. In addition, the brief Big Five measure used made it impossible to test for effects on narrower facets. While the hunt for birth order effects on facets in WEIRD samples has not brought up consistent patterns, it is possible that such patterns exist in Indonesia.
To take the critique concerning measurement one step further, one could argue that self-reports are generally not suitable for detecting birth order effects. This criticism applies to our analyses of the Big Five personality traits, but not necessarily to our measures of risk aversion and other reported outcomes (unless respondents systematically lied), and not to the assessment of intelligence. Sulloway (1999) suggested that first-borns respond in a more socially desirable manner to self-ratings than later-borns; this could cancel out existing birth order effects. This hypothesis could be tested using either other-reports of personality or behavioural outcomes that are not as easily affected by social desirability.
It should be noted that there is little evidence for the social desirability hypothesis in WEIRD countries—older studies using personality comparisons made by other family members or even comparisons made by the targets themselves (e.g. ranking themselves among their siblings)—are hard to interpret as they might be affected by stereotypes. The only study we are aware of that uses other-reports by third parties does not provide much evidence for the expected effects (Jefferson, Herbst, & McCrae, 1998), and the few studies using alternative outcomes (i.e. behaviour in economic games, Courtiol, Raymond, & Faurie, 2009; Salmon, Cuthbertson, & Figueredo, 2016) suffer from various quality issues. However, recent population-based studies of choices of college major in Sweden found that earlier-borns were more likely to study engineering and medicine, while later-borns were more likely to study journalism, art, and business (Barclay et al., 2017). In addition, psychiatrist and blogger Scott Alexander (2018) reported a sizable overrepresentation of first-borns among his readership, which is heavily biased towards computer scientists. Such strong patterns regarding life choices in the absence of strong effects on intelligence and personality could perhaps be better explained through parental expectations, investment, and specific social norms. These major life choices may occasionally have hanger-on effects on the traits of intelligence and personality studied here. If so, the hanger-on effects would not be found across cultures (as would be expected if they were due to universal family dynamics); instead, they would be fairly specific to environments where university education is common and choices are affected by parents.
An overall lack of good evidence is not the same as evidence for a lack of effects. Rohrer et al. (2017) stated that researchers who aim to venture down the path of analysing birth order effects on alternative outcomes like other-reports or behavioural measures should ensure that they follow best practices to avoid wrong conclusions. In particular, given the high effort involved in collecting behavioural data and observer reports for a sufficiently large sample to detect the potentially subtle effects of birth order, we encourage researchers to consider using a Registered Reports format lest their efforts result in a negative finding that might be hard to publish.
Birth order effect: stereotypes versus reality?
The lack of consistent birth order effects on personality in more recent empirical studies is often contrasted with the prevalence of strong stereotypes, in particular in popular media reporting about birth order research. Strong stereotypes might be interpreted as evidence for the existence of actual birth order effects. For example, Paulhus (2008) has argued that such stereotypes flourish because they have (at least) a kernel of truth. With respect to that notion, we would like to raise two questions. First, to which extent do such stereotypes indeed ‘flourish’? Second, what could such a ‘kernel of truth’ be?
Herrera, Zajonc, Wieczorkowska, and Cichomski (2003) provided some evidence for stereotypes in line with Sulloway’s (1996) family niche model, with average ratings made by Stanford undergraduate students suggesting that last-borns are perceived as boldest, first-borns as most intelligent, and so on. However, these average ratings do not reveal what per cent of the respondents actually held a stereotypical view of birth order positions in line with any particular theory or how high inter-rater agreement was, making it hard to assess the underlying variability. And, once again, there is a lack of studies on these patterns in non-WEIRD countries. To answer the question whether birth order stereotypes have a kernel of truth, it is indispensable to have a better understanding of how reliable and universal these stereotypes actually are (e.g. in comparison with stereotypes that have been researched more extensively, such as gender stereotypes) and to what extent they are idiosyncratic (e.g. people may have strong but divergent views about the personality of different birth order positions, possibly informed by their own family).
More knowledge about the strength and the consistency of birth order stereotypes could in turn inform reasoning about potential ‘kernels of truth’. If the stereotypes are indeed held more or less universally, a more powerful cause behind these stereotypes seems plausible. If they are inconsistent and on average only slightly tilted in favour of the picture painted by theories such as the family niche model, even a very small systematic factor could give rise to them, including past media reports about scientific findings.
For example, one could imagine that birth order stereotypes reflect real birth order effects that occur in childhood and early adolescence or used to occur in the past and now survive as part of cultural memory. It would also be possible that some of the stereotypes about traits are a result of birth order effects in other domains—as mentioned earlier, there is some evidence for birth order effects on choice of college major (Barclay et al., 2017). Stereotypes could also reflect spurious birth order associations resulting from within-family comparison. Such comparisons are confounded by age—for example, first-borns will tend to be more conscientious than their siblings because they are older and thus tend to be more mature (the supplementary material of Rohrer et al., 2017, provides empirical evidence for this pattern: https://osf.io/wu7h3/). Such comparisons, if made by parents, could also reflect changing interpretations and expectations regarding children’s behaviour as parenting expertise increases.
A similar (if not stronger) discrepancy between stereotypes and actual personality may exist for only children. Dufner, Back, Oehme, and Schmukle (2019) contrasted lay-people’s expectations regarding narcissism in only children with actual data from a representative German panel study. While participants rated only children higher on narcissistic admiration and rivalry than children with siblings, no such trend was found when actually comparing narcissism between only children and children with siblings.
Taken together, the findings regarding birth order position and only children might indicate that laypeople (as well as researchers) are prone to overestimating the role of ‘coarse’ features of the childhood family environment (e.g. the absence or presence of siblings, one’s position among them) in long-term personality development. Similarly, many people may be surprised to learn that the shared environment has repeatedly been shown to have little influence on most behavioural traits. Birth order is an environmental factor that is not shared within the family, but there is a similar pattern regarding the shared environment: many people intuit that it must matter a great deal for adult personality, yet behavioural genetic studies have repeatedly shown that it contributes little (Turkheimer, 2000). People’s broad intuitions about how the environment affects personality in the long run are often miscalibrated or too simplistic.
Conclusion
From a broader perspective, our study highlights the need to go beyond Western countries to test whether theoretical accounts that are implicitly or explicitly assumed to hold universally actually do operate across cultures. Robust discrepancies between findings from different cultural backgrounds can inform theory and elucidate mechanisms that drive effects—but only if researchers do not limit themselves to WEIRD populations.
Footnotes
Note
Data accessiblity statement
This article earned Open Data and Open Materials badges through Open Practices Disclosure from the Center for Open Science: https://osf.io/tvyxz/wiki. The data and materials are permanently and openly accessible at ![]() .
.
Author contribution
R. C. Arslan developed the study concept. L. J. Botzet and R. C. Arslan contributed to the data analysis. All authors contributed to the interpretation of the results. L. J. Botzet drafted the manuscript, and J. M. Rohrer and R. C. Arslan provided critical revisions. All authors approved the final version of the manuscript for submission.
Acknowledgements
We are grateful to the RAND corporation, which conducts the Indonesian Family Life Survey, and to the survey participants. Additionally, we would like to thank Deb Ain for her careful editing. All remaining errors are ours.