
Abstract
For decades, day–night patterns in behaviour have been investigated by asking people about their sleep–wake timing, their diurnal activity patterns, and their sleep duration. We demonstrate that the increasing digitalization of lifestyle offers new possibilities for research to investigate day–night patterns and related traits with the help of behavioural data. Using smartphone sensing, we collected in vivo data from 597 participants across several weeks and extracted behavioural day–night pattern indicators. Using this data, we explored three popular research topics. First, we focused on individual differences in day–night patterns by investigating whether ‘morning larks’ and ‘night owls’ manifest in smartphone–sensed behavioural indicators. Second, we examined whether personality traits are related to day–night patterns. Finally, exploring social jetlag, we investigated whether traits and work weekly day–night behaviours influence day–night patterns on weekends. Our findings highlight that behavioural data play an essential role in understanding daily routines and their relations to personality traits. We discuss how psychological research can integrate new behavioural approaches to study personality.
Introduction
Are there times of day when you do not use your smartphone at all? Most likely at night. As our everyday companions, smartphones can provide much information about people's day–night patterns (Harari et al., 2016). So far, behavioural manifestations of the underlying circadian system like sleep–wake timing, diurnal activity, or sleep duration have mainly been assessed via self–reports (Adan et al., 2012). However, self–reports about behaviour are known to differ from actual records of behaviour (Baumeister et al., 2007; Gosling et al., 1998). Emphasizing this dilemma, Lauderdale et al. (2008) correlated behaviourally assessed sleep duration with self–reports and concluded that people systematically misjudge it. An alternative approach is to collect actigraphy–based data to study sleep behaviour: movements and environmental factors like ambient brightness are recorded with wristbands and are jointly converted to indicators for sleep–wake timing by special algorithms (e.g. Križan & Hisler, 2019; Tonetti et al., 2016; Vitale et al., 2015). Regarding the trade–off between measurement accuracy and ecological validity, another interesting complement for studying sleep behaviour could be the use of smartphone sensing data. These data cannot provide a direct measurement of sleep–wake phases, but only periods of nightly inactivity of smartphone use in which physiological sleep occurs. In contrast to actigraphy, these measurements do not take body signals such as movements or pulse into account. However, first studies have indicated that smartphone data provide useful information about sleep–wake timing as smartphones are meanwhile considered to be part of new sleeping habits (Chen et al., 2013; Min et al., 2014; Lin et al., 2019; Borger et al., 2019). Borger et al. (2019) have shown that indicators for sleep onset and offset derived via actigraphy and smartphone touch interactions are highly correlated. In addition, independence from sensors worn on the body also offers advantages in terms of ecological validity. With the help of commercially available smartphones, behavioural indicators for sleep–wake timing can be collected efficiently and unobtrusively in everyday life over a more extended period, even for large samples. To illustrate this, we use smartphone–sensed indicators for sleep–wake timing to investigate traits related to day–night patterns. For this purpose, we chose to study three frequently researched questions, which we will introduce in the following sections.
Individual differences in behavioural day–night patterns
The human circadian system has been studied for decades by interdisciplinary research teams. The most prominent finding across all research disciplines is that individuals show stable differences in day–night patterns, a stable trait that is often referred to as the chronotype (e.g. Adan et al., 2012; Cavallera & Giudici, 2008; Roenneberg et al., 2003). Literature frequently describes two extremes: the morning type (‘morning lark’) wakes up and goes to bed early, feels fit after getting up, and performs best early in the day. The evening type (‘night owl’) wakes up and goes to bed later, feels tired after waking up, and performs best towards the end of the day (for extensive reviews, see Adan et al., 2012; Cavallera & Giudici, 2008; Takano et al., 2014). The chronotype has been argued to be a genetically predisposed trait with various biological manifestations like body temperature or hormone levels (Bailey & Heitkemper, 2001; Horne & Östberg, 1976; Roenneberg et al., 2003; Katzenberg et al., 1998). In addition, chronotype should be distinguished from sleep duration, which has been argued to be an independent trait (Roenneberg et al., 2007).
Based on the distinction between variable–centred and person–centred personality assessment (Asendorpf, 2003), one might assume that chrono ‘types’ refer to distinct groups of individuals with similar manifestations in chronotype–related behaviours. However, Putilov (2017) points out in his review that researchers have not yet reached an agreement on the number and content of underlying dimensions, the resultant number of types, and whether the conceptualization as types makes sense at all (Roenneberg et al., 2003). Two different operationalizations of chronotype are most prominent in the literature (see Table 1).
Description of the two most popular approaches to chronotype
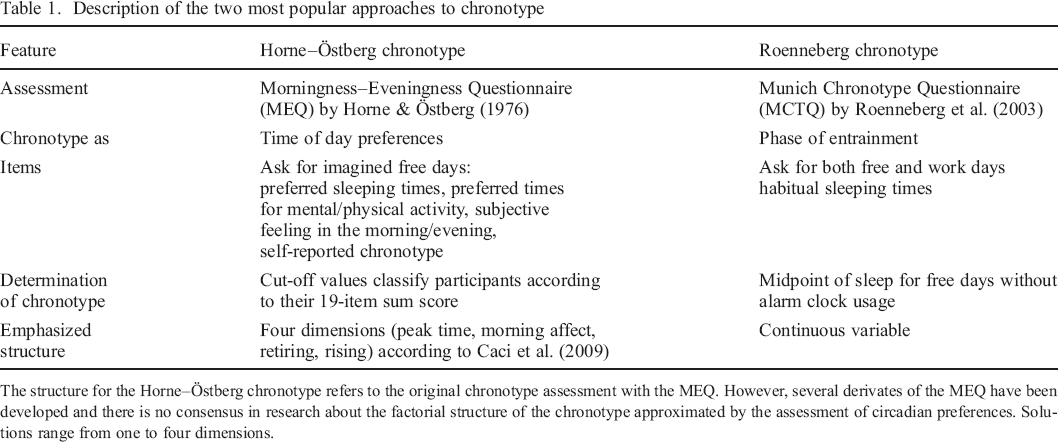
The structure for the Horne–Östberg chronotype refers to the original chronotype assessment with the MEQ. However, several derivates of the MEQ have been developed and there is no consensus in research about the factorial structure of the chronotype approximated by the assessment of circadian preferences. Solutions range from one to four dimensions.
Dating back to Horne and Östberg (1976), chronotype is described as circadian or morningness–eveningness preferences. The term ‘circadian typology’ is often used synonymously and shows the emphasis on the categorization of chronotypes in this research tradition (e.g. Adan et al., 2012; Lipnevich et al., 2017). In comparison, Roenneberg et al. (2015) accentuate the chronotype as a continuous variable and describe it as a trait reflecting the phase of entrainment, which represents individual differences in the synchronization of the internal circadian rhythm to environmental factors (e.g. light/dark cycle, diurnal temperature curve, social interaction). Despite their different understanding of the underlying construct of chronotype (Roenneberg, 2015), both operationalizations have been found to be strongly correlated (Zavada et al., 2005). In the present study, we take the structural ambiguity of chronotype as our starting point to investigate how smartphone sensing data reflecting day–night activity patterns could help to inform chronotype research, as operationalized both in the Horne–Östberg and in the Roenneberg tradition.
In the Horne–Östberg tradition, the Morningness–Eveningness Questionnaire (MEQ; Horne & Östberg, 1976) still represents the gold standard for chronotype assessment (Putilov, 2017). The MEQ asks for circadian preferences and categorizes people according to ad hoc specified cut–off values (Horne & Östberg, 1976). In the development of the MEQ, neither the grouping nor the factorial structure was investigated. Cut–off values were determined using a small but not representative sample (Caci et al., 2009). Meanwhile, various derivates and short scales of the MEQ have been published (Adan et al., 2012; Putilov, 2017). Assumptions on the underlying structure of circadian preferences range from a continuum with two extremes (Natale & Cicogna, 2002; Tonetti et al., 2016), over two dimensions (morningness and eveningness as separate dimensions Lipnevich et al., 2017) to a multidimensional construct with up to four factors (Adan et al., 2012; Randler et al., 2016; Caci et al., 2009). Recently, Preckel et al. (2019) have published pioneering work on a typology of circadian preferences providing empirical evidence on the possible number of types. In an adolescent sample, they found evidence for four types resulting from the combination of the two independent dimensions of morningness and eveningness preference. Joining this search for structure, we translate the questionnaire items typically used to determine the Horne–Östberg chronotype into behavioural smartphone sensing equivalents. Smartphone usage variables can approximate many of them. Following Putilov's (2017) recommendation to consider behavioural markers for circadian preferences, we investigate whether we can find types of individuals with similar smartphone usage patterns indicating circadian preferences. Finally, we explore the factorial structure of the behavioural indicators.
In the Roenneberg tradition, freely chosen sleep–wake timing is considered the best approximation of the internal circadian rhythm. Therefore, sleep–wake habits for both work and free days are assessed while controlling for alarm clock usage (Roenneberg et al., 2003; Roenneberg et al., 2015). In this taxonomy, the midpoint between sleep onset and offset determines the chronotype. This reference point for sleep has proven to coincide with nocturnal melatonin production, which in turn controls sleep–wake timing (Terman et al., 2001; Roenneberg et al., 2003; Roenneberg et al., 2007; Roenneberg et al., 2015). In this context, the Munich Chronotype Questionnaire (MCTQ), which has been repeatedly validated by behavioural (actigraphy) and biological (melatonin, cortisol) circadian system markers, is primarily used (Roenneberg et al., 2003; Roenneberg et al., 2007). Only recently, Lin et al. (2019) took up the idea to determine the Roenneberg chronotype by using smartphone sensing data and provided first indications that there is a considerable overlap between sleeping times assessed via smartphones and self–reports. However, their algorithm for characterizing a digital chronotype does not explicitly correspond to Roenneberg's chronotype criteria, as they did not differentiate between work and free days and were restricted to the use of a very limited range of data (screen and notification events Lin et al., 2019). We propose a more fine–grained algorithm for determining a smartphone sensing–based proxy by using only free days without alarm clock usage. To explore our smartphone chronotype, we look at descriptives and correlational analyses that were presented by Roenneberg's group to describe the MCTQ–based chronotype. For example, Roenneberg et al. (2007) found that sleep duration depends on chronotype if analysed separately for work and free days and that chronotype is related to age and gender.
Behavioural day–night patterns and personality traits
Important research questions are associations between day–night patterns, personality, and demographics. Different aspects of day–night behaviour have been addressed in this context. For example, the morningness preference has been linked to personality. Higher values in this dimension indicate a preference for getting up and going to bed early, feeling fit in the morning, and achieving peak performance earlier in the day (Lipnevich et al., 2017). The most established findings in meta–analyses are that conscientiousness and agreeableness are positively related to morningness (Tsaousis, 2010; Lipnevich et al., 2017). No or only small relationships in a specified direction can be found for neuroticism and openness (Adan et al., 2012; Tsaousis, 2010; Lipnevich et al., 2017). Negative relationships between morningness and extraversion were found, but only if the trait extraversion was described with Eysenck's three–factor model (Adan et al., 2012; Tsaousis, 2010). Using the five–factor model, this association is almost zero (Tsaousis, 2010). For the sake of completeness, please note that morningness has also been found to be related to personality styles or, more precisely, with thinking and behaving styles (Díaz–Morales, 2007). Furthermore, age has been robustly related to morningness. Shifts towards eveningness in adolescence and towards morningness with increasing age (at around 50) have been reported (e.g. Adan et al., 2012; Cavallera & Giudici, 2008). Regarding gender, a meta–analysis has found that the preference for morningness is slightly higher for women compared with men (Randler, 2007). However, complex interactions between age and gender have been reported in previous literature. For example, girls at the age of 13 and 14 have a lower tendency towards morningness than their male counterparts (Mateo et al., 2012), and their peak towards eveningness is earlier (e.g. Adan et al., 2012). In addition, Randler and Engelke (2019) have shown a complex interaction between age and gender with regard to morningness preferences: young women were more and older women less morning oriented than young or older men.
In addition, associations between sleep duration and personality traits have been investigated, but findings have been ambiguous so far. For example, there is some evidence that individuals with higher values in neuroticism report to sleep longer (Duggan et al., 2014). According to Križan and Hisler (2019), neuroticism is not related to the mean sleep duration but positively related to the intraindividual variation in sleep duration. Some studies reported correlations between sleep duration and conscientiousness, agreeableness, or openness but not extraversion (Randler, 2008; Križan & Hisler, 2019). In contrast, other researchers did not find any evidence that sleep duration and big five personality traits are associated (Gray & Watson, 2002; Randler et al., 2017; Sutin et al., 2019). Sleep duration decreases with age (Randler, 2008) but was not found to be related to gender (Randler et al., 2017).
In summary, past research provides some evidence for associations between personality traits and day–night behaviour, but past findings are inconsistent. One possible reason for this could be that the majority of studies (except Križan & Hisler, 2019; Sutin et al., 2019) asked participants about their habits but did not include any behavioural measures of sleep. Not only might people differ in their ability to estimate their sleep duration, personality traits themselves might play a role in the evaluation of their day–night behaviours. To circumvent this issue here, we use data from smartphone sensing to derive indicators for sleep–wake behaviour and to consequently investigate their relationship with big five personality traits on factor and facet level. Additionally, we explore sleep continuity, which has been defined as a measure of how well people fall asleep and sleep through (Ohayon et al., 2017). Recent actigraphy–based research has found, for example, that conscientiousness and extraversion were negatively related to behavioural indicators of sleep continuity, such as wake after sleep onset. In contrast, higher scores in neuroticism were associated with more wakening (Sutin et al., 2019). As a rough smartphone–based approximation measure, we look at two aspects of sleep continuity: how often and for how long people check their smartphones during the night. Additionally, we analyse smartphone activity logs to explore how alarm clock usage—particularly ‘snoozing’—is related to personality.
Intraindividual and interindividual differences in day–night patterns: The social jetlag
Finally, we explore the so–called social jetlag hypothesis (e.g. Adan et al., 2012; Wittmann et al., 2006). Roenneberg et al. (2007) surveyed the sleep habits of more than 55 000 people using the MCTQ and found that sleep behaviour differs for work–free days versus workdays. Specifically, their findings suggest that people, on average, go to bed and awake earlier on work than on free days. Furthermore, the proportion of sleep onset and offset is smaller for workdays than for free days. It has been suggested that this effect is induced by social obligations (Wittmann et al., 2006). Thus, the pairing of late bedtimes with consistent wake–up times leads to a sleep deficit for a week. As a consequence, sleep is compensated on weekends (Roenneberg et al., 2015). This misalignment of the internal biological and the external social clock is associated with health risk behaviours (e.g. increased body mass index and smoking Roenneberg et al., 2012; Wittmann et al., 2006). According to Wittmann et al. (2006) and Roepke and Duffy (2010), late chronotypes are particularly affected by the social jetlag as they stay up until late at night but have to get up early to go to work or to pursue other social obligations on the following day. The assessment of individuals’ daily routines through the analysis of smartphone activity logs for several weeks allows us to investigate compensatory nightly rest by considering intraindividual and interindividual factors. Using these indicators, we want to explore whether the smartphone–sensed proxies for sleep duration on weekends and respective weeks are related and whether interindividual factors like the Roenneberg chronotype, demographics, and personality traits have an impact.
Rationale
Our study aims to reinvestigate selected topics regarding day–night pattern–related traits by using smartphone sensing data. Because we use a new type of data in this field of research, this is exploratory work. A handful of studies have started to use smartphone data in this context (e.g. Chen et al., 2013; Min et al., 2014; Lin et al., 2019). However, these studies have mostly been limited in terms of sample size and types of sensing data.
Here, we show how behavioural records from smartphones can be used to investigate individual differences in day–night patterns, how they relate to personality traits, and how they are influenced by intraindividual and interindividual factors. Besides the examination of whether ‘morning larks’ and ‘night owls’ manifest in indicators of sleep–wake timing and diurnal activity patterns, we explore the smartphone–based operationalization of the Roenneberg chronotype. We investigate the associations of day–night behaviour patterns and personality traits. Finally, we illustrate how continuously logged behavioural data can be used to investigate the contribution of both intraindividual and interindividual factors to predict indicators for sleep behaviour on weekends, using the social jetlag hypothesis as an example.
Method
Our analyses are based on data collected within the long–time project PhoneStudy (Stachl et al., 2018). This ongoing interdisciplinary research project at LMU Munich uses the continuously developed smartphone sensing application PhoneStudy for Android smartphones for collecting natural smartphone usage behaviours in the field. Data about app usage, calling activity, general phone usage (e.g. calendar, music, power supply), and connectivity (e.g. Bluetooth, WiFi) are logged whenever the respective events occur. GPS data are usually recorded once every 15 minutes. Data are synchronized hourly to the back end server via Secure Sockets Layer (SSL) encryption, whenever a WiFi connection is available. The responsible institutional review board and data protection office approved the project and all associated studies. All materials and aggregated data can be found in our open science framework project (OSF; Schoedel et al., 2020). 2 To protect the data privacy rights of our participants, the raw sensing data cannot be made available due to their granularity.
Description of data set
We combined data resulting from three studies conducted between 2014 and 2018. In Table 2, we show some basic information about the included studies. Despite some marginal differences, data collection procedures of all studies followed the same principle: after giving informed consent, participants were asked to install the PhoneStudy app for at least 30 days on their private smartphones and to complete several questionnaires before, during, or after the smartphone logging period. Participants were mostly recruited in the university context via flyers, mailings lists, social media, and personal contact in Munich, Germany. For more detailed information about study procedures, see also Stachl et al. (2017); Harari et al. (2019); Schuwerk et al. (2019); Schoedel et al. (2018); and Stachl et al. (2019).
Description of data sets used in the study
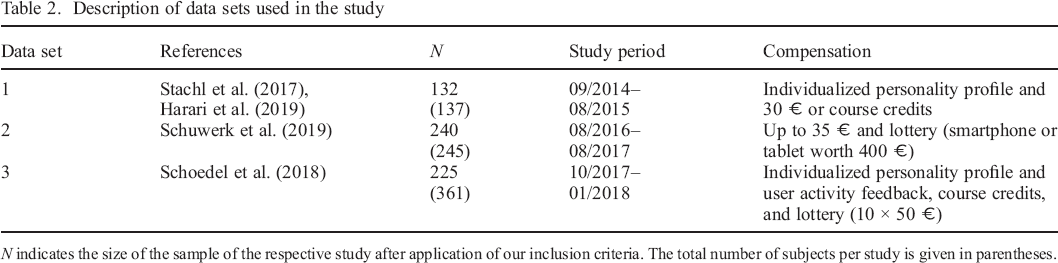
N indicates the size of the sample of the respective study after application of our inclusion criteria. The total number of subjects per study is given in parentheses.
We applied several exclusion criteria to our initial data set of 743 participants. We excluded participants with fewer than 21 days of sensing data, more than 50% missing values across all variables, and if questionnaire data were not available. We included data from a maximum of 32 days of continuous logging. This resulted in a final sample size of 597 (61% women). As recruitment took place in the university context, participants were, on average well educated (71% with a high school and 20% with a university degree). With a mean age of 23.56 years (SD = 6.55; Min = 18, Max = 72), the sample was skewed towards younger participants (18–21: 39%; 22–25: 34%; 26–30: 12%; 31–40: 5%; 41 and older: 3%). For a more detailed description of the sample, according to studies, see Table 3.
Description of the sample according to studies
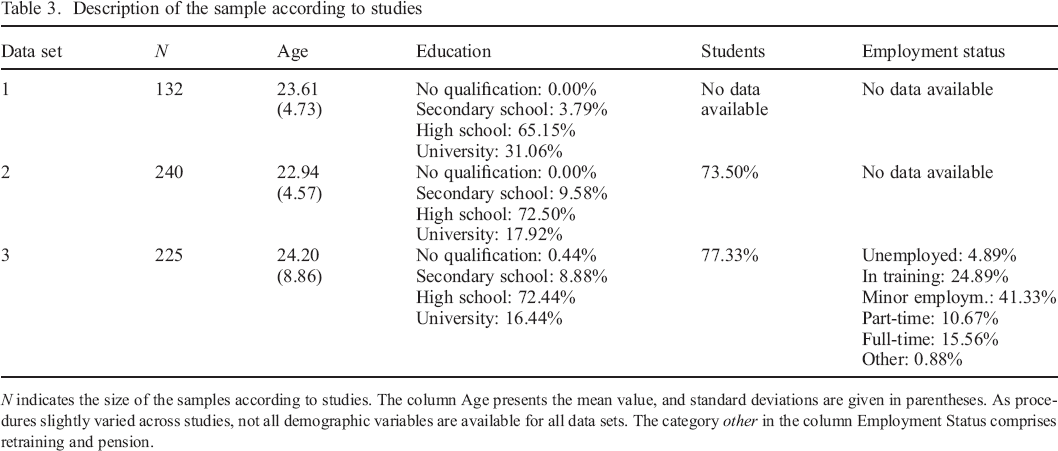
N indicates the size of the samples according to studies. The column Age presents the mean value, and standard deviations are given in parentheses. As procedures slightly varied across studies, not all demographic variables are available for all data sets. The category other in the column Employment Status comprises retraining and pension.
Measures
Self–report measures
We administered various self–report questionnaires. However, we limit our report to the ones used in our statistical analyses. Besides demographics, personality traits were assessed with the Big Five Structure Inventory (BFSI Arendasy, 2009). Each of the big five factors—openness, conscientiousness, extraversion, agreeableness, and emotional stability—was measured on respectively six subscales (Table B1). Participants were asked to rate 300 personality describing adjectives and short phrases on a 4–point Likert scale with the labels untypical for me, rather untypical for me, rather typical for me, and typical for me. Compared with the widely used structure inventory NEO–PI–R (Costa & McCrae, 2008), the BFSI is supposed to have better psychometric properties: Cronbach α values (ranging between 0.72 and 0.92) are partly higher, and subscales are unidimensional in the original paper (Arendasy, 2009). In addition, the BFSI should be less dependent on the participant's reading comprehension ability as it uses short and simple items (Arendasy, 2009). The construction of the BFSI does not follow the classical test theory, but the item response theory framework. Accordingly, the BFSI has been developed in conformity with the partial credit model (Masters, 1982), which is a probabilistic model describing an individual's observable score on a single item as the result of the functional relationship between the individual's latent trait value (person parameter) and latent item thresholds, which indirectly determine item difficulty (item parameter Arendasy, 2009). Correspondingly, we used the person parameter estimates as personality scores in all our analyses.
Day–night behavioural measures
Raw smartphone sensing data are sequences of timestamped event data. Whenever a usage event happens, a data entry specified by several event characteristics (e.g. date, study day, details about the event like app package name or type of call) is created. To get an idea of the raw data structure, see also the supplemental codebook (Schoedel et al., 2020). To investigate the research questions specified above, we created variables by reviewing the literature and translating behavioural sleep indicators into smartphone sensing behaviours. Based on our smartphone sensing data, we computed proxy variables to estimate sleep–related behaviours. Please note that our variables are likely to overestimate actual sleep as the last smartphone usage event in the evening has to be before the physiological onset of sleep, and the first smartphone usage event in the morning occurs with delay after waking up. As smartphone sensing data are prone to logging errors, we extracted robust behavioural estimators when appropriate for the respective variable (Kafadar, 2003; Rousseeuw & Croux, 1993). To stay within the scope of this article, we only summarize our procedure and the engineered variables in the following sections. However, note that variable extraction is usually the most complex and time–consuming task in analyses of smartphone sensing data, and the process includes many researchers’ degrees of freedom. For transparency, we provide all code in our OSF project, and the variable extraction procedure is described in detail in the supplemental codebook (Schoedel et al., 2020).
General indicators for sleep–related behaviours
We computed the following variables daily while distinguishing between days during the week versus the weekend (Roenneberg et al., 2007). Based on the algorithm specified in Table A1, we determined the first and last events according to individual study days and calculated mean and intraindividual variation variables. We defined the smartphone proxy for sleep duration, nightly inactivity, as the period between the last event of the day and the first event of the following day. To explore social jetlag, we calculated the average daily inactivity during the night for weekdays and weekends for all study weeks individually.
In addition, we translated two aspects of sleep continuity, sleep fragmentation and waking up after bed, into smartphone usage behaviour by calculating the average number and duration of checking eventsat night. At this point, we would like to point out that our measures do not fully meet the definition of sleep fragmentation and wake after sleep onset by Ohayon et al. (2017). Hence, our measurements only give a rough estimate, taking into account the occurrence of very short smartphone checking events during the nightly inactivity period of smartphone use, which was not part of a more extended usage period in the evening and the next morning. Accordingly, we defined nightly checking events as short periods of less than 2 minutes of smartphone usage during otherwise nightly inactivity. Due to the lack of empirical data in the literature, we have set this threshold value considering that smartphone usage of fewer than 2 minutes might be caused by less significant actions such as checking the clock during the night.
Finally, we calculated some variables related to using the smartphone as an alarm clock: the mean point of time of alarm app ringing, the mean daily number, and duration of snoozing events (snoozing was defined as the repetition of alarm app events in the morning).
Horne–Östberg chronotype variables
To operationalize circadian preferences in terms of smartphone usage behaviour, we computed variables following the items of the MEQ (Table 1). We translated preferred sleeping times as mean points of time of the first and the last smartphone usage event on weekends, as weekends are likely to be organized freely. Following this assumption, we also specified preferred times for activity as diurnal smartphone activity patterns. In this context, we distinguished between different behavioural categories: social communication (social media/communication app usage, calls, and texting), entertainment (browser, gaming, music/video, and news app usage), and general smartphone usage (all active smartphone usage events). To take into account the distribution of usage events throughout the day, we computed the first quartile, the median, and the third quartile of usage events according to the behavioural categories for each day. In other words, we extracted timestamps that indicate when 25%, 50%, and 75% of the daily events of the respective usage category took place. Then we computed the mean across all study days for each of the three quantiles. Finally, to depict the subjective feeling of sleepiness in the morning, we considered the mean number and duration of snoozing events during the week to indicate how readily people get up in the morning.
Roenneberg chronotype variables
Similar to the assessment of the chronotype using the MCTQ, we calculated the midpoint of sleep (MSF), which is the mean halfway point in time between the last event of a day and the first event of the next day for free (weekend) days without alarm app usage. In addition, we determined the corrected midpoint of sleep (MSF corr ), which has been proposed by Roenneberg et al. (2007) to correct for the sleep debt collected during the week. According to them the MSF corr is better suited for estimating the true underlying chronotype.
Data analysis
Clustering
In the following, we give a short overview of the applied methods. More detailed information can be found in Appendix A. To investigate whether participants can be assigned to groups of similar smartphone usage behaviours indicating circadian preferences, we used clustering as an unsupervised machine learning method. We applied the commonly used k–means clustering algorithm with the Euclidean distance as proximity measure. Clustering aims to reduce complexity by finding meaningful structures within the data. According to their similarity in a predefined set of variables, participants are clustered in within–homogeneous groups that are well separated from participants of other clusters (Tan et al., 2006). However, one disadvantage of clustering algorithms is that they sometimes identify random and, therefore, nonreplicable structures (Tan et al., 2006). In line with the literature, we address this problem by using a data–driven approach to determine the number of clusters (Tibshirani & Walther, 2005) and by evaluating the stability and validity of the identified clusters based on bootstrapped metrics (Hennig, 2007; 2008; Tan et al., 2006). We followed the recommendations of Hennig (2018) and used 100 bootstrap iterations. For evaluating cluster stability, we considered the Jaccard coefficient (JC, indicates stability if values exceed 0.85) and the criteria of recovery and dissolution, which count how often each cluster has been successfully recovered and dissolved across all bootstrap iterations (Hennig, 2007; 2008). For evaluating the internal validity of clusters we looked at metrics indicating how similar participants within each cluster are (within–compact) and how different participants from different clusters are (between–separated): the ratio of average within– and between–cluster distances (wb.ratio Tan et al., 2006), the silhouette coefficient (Rousseeuw, 1987), and the Dunn index (Dunn, 1974; Halkidi et al., 2001). Clusters are within–compact and between–separated if the ratio of distances is small, the silhouette index is close to 1, and the Dunn index is high (Tan et al., 2006; Hennig, 2018). As the k–means algorithm cannot handle missing values, we used the multivariate imputation by chained equations technique and specified a random forest imputation model (MICE, van Buuren & Groothuis–Oudshoorn, 2011).
Exploratory factor analysis
To explore the factorial structure of our smartphone–based proxy for the Horne–Östberg chronotype, we conducted an exploratory factor analysis based on the averaged correlation matrix of the imputed data sets. We determined the number of factors using the empirical Kaiser criterion, which has been shown to perform well for short scales (Braeken & Van Assen, 2017).
Multilevel modelling
Measures for nightly inactivity of smartphone usage were repeatedly measured across several study weeks. Considering the intraindividual data dependency, we used multilevel regression modelling with behavioural measures on a weekly basis reflecting level 1 variables that were nested within individuals (level 2). Therefore, we specified a random–intercept–random–slope model predicting the mean nightly inactivity duration on weekends based on the mean nightly inactivity duration of the respective preceding workweek (level 1). The averaged nightly inactivity duration, the Roenneberg chronotype, the big five traits, age, and gender, were included as predictors on level 2.
Regarding data preprocessing, we were faced with the challenge of selecting one path from a series of plausible steps. To do justice to these many researcher degrees of freedom and to increase research transparency, we follow the suggestion of Steegen et al. (2016) and present a multiverse analysis: for each possible combination of plausible preprocessing steps, a ‘new’ data set is constructed, and the same multilevel model is estimated for each of those data sets. The multiverse analysis illustrates how much the results depend on the choice of specific preprocessing steps or vice versa, which results are robust across all preprocessing options (Steegen et al., 2016; Simonsohn et al., 2015). Our preprocessing choices include the coding of the weekend (Friday to Sunday versus Friday to Monday), the selection of the number of repeated measurements (3 versus 4 weeks), the handling of outliers(median versus winsorization), and the handling of missing values (listwise deletion versus multiple imputation). A detailed description of the alternatives for each decision can be found in supplemental method section in Appendix A. Combining all described decisions resulted in 2 × 2 × 2 × 2 = 16 choice combinations (see left side in Figure 4).
We used the uncorrected version of the Roenneberg chronotype as a predictor, as we explicitly control for a nightly inactivity deficit in the multilevel model. Gender was dummy coded (0 = male, 1 = female), and all continuous predictor variables were z–standardized based on the grand mean. The level 1 predictor duration of nightly inactivity during the week was centred around the individual mean, which in turn was entered as level 2 predictor (Curran & Bauer, 2011). For a more detailed description of the equation of the multilevel model, we refer the interested reader to the supplemental method section in Appendix A.
Statistical software
All data preprocessing and analyses were conducted using R 3.5.0 (R Core Team, 2018). We used packrat (Ushey et al., 2018) for package management. For extracting behavioural variables, we mainly used the R packages dplyr (Wickham et al., 2019) and fxtract (Au, 2019). Multiple imputation was done by using the package mice (van Buuren & Groothuis–Oudshoorn, 2011). In addition, we used the following packages to conduct our main analyses: fpc for clustering (Hennig, 2018), psych for exploratory factor analysis (Revelle, 2018), and lme4 and lmerTest for multilevel modelling (Bates et al., 2015; Kuznetsova et al., 2017). For data visualization, we applied ggplot2 (Wickham, 2016) and corrplot (Wei & Simko, 2017) and created raincloud plots (Allen et al., 2019). The complete list of used R packages can be found in our OSF project (Schoedel et al., 2020).
Results
Descriptives
We recorded a mean of 22 547 events (SD = 24 368) for each participant across the whole study period. Participants had on average smartphone records for 21 (SD = 1.57) weekdays and 8 (SD = 0.92) weekend days. The mean number of logs per study day was 765 (SD = 804.70). As can be seen in Table 4, the average time of first and last smartphone usage was later for weekends than weekdays, and the duration of nightly inactivity was about 20 minutes longer on weekends than on weekdays. However, the mean number and duration of checking events during the night were similar for weekends and weekdays. A total of 91% of our participants used alarm clock apps in the morning, at 7.19 am on average during the week and about 30 minutes later on weekends. Note that 38% of participants did not use alarm clock apps on any weekend during the entire study period. The number and duration of snoozing events were similar for weekdays and weekends. Descriptive statistics for big five personality traits can be found in Table B1 in the Appendix.
Descriptive statistics for day–night behaviour patterns
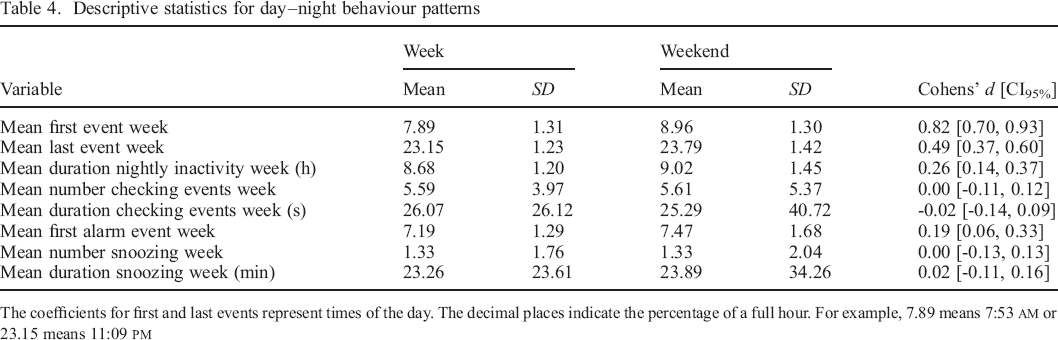
The coefficients for first and last events represent times of the day. The decimal places indicate the percentage of a full hour. For example, 7.89 means 7:53 am or 23.15 means 11:09 pm
Individual differences in behavioural day–night patterns
Person–centred and variable–centred structure of the Horne–Östberg chronotype
In the first step, we determined the number of clusters. Following the suggestions of Tibshirani and Walther (2005), we looked for solutions resulting in a prediction strength above 0.80. Doing so, in 49 out of 50 imputed data sets, the data–driven proposed number for clustering based on smartphone proxies for circadian preferences was 1. However, decreasing the prediction strength criterion to a value of 0.75 yielded a 2–cluster solution for all imputed data sets. Although the recommended predictive power was slightly missed, we further investigated k−means clustering with k = 2. The averaged bootstrapped performance measures for the cluster–wise stability assessment show that each component of the 2–cluster solution turned out to be highly stable (cluster 1 n = 296: JC = 0.94, dissolved = 0, recovered = 100; cluster 2 n = 301: JC = 0.93, dissolved = 0, recovered= 100). However, the internal cluster validation coefficients indicated that the two clusters were poorly separable from each other and were not compact in themselves (wb.ratio = 0.73, silhouette = 0.25, Dunn = 0.06). To get a better understanding of the identified structure in the daily smartphone usage timing, descriptive statistics of the variables that were considered for clustering are displayed in Table 5. On average, participants assigned to cluster 2 had later first and last smartphone usage events on weekends and the daily 25%, 50%, and 75% timestamps for general, social interaction, and entertainment usage events on weekends were on average about 2 hours later. The mean number of snoozing events was similar in both groups, but participants of cluster 2 on average snoozed approximately 3.5 minutes longer. As an external criterion, we considered the smartphone–based Roenneberg chronotype. The mean midpoint of sleep was M = 3.90 (SD = 1.15) for cluster 1 and M = 5.19 (SD = 1.38) for cluster 2.
Descriptive statistics for smartphone usage indicating circadian preferences by clusters
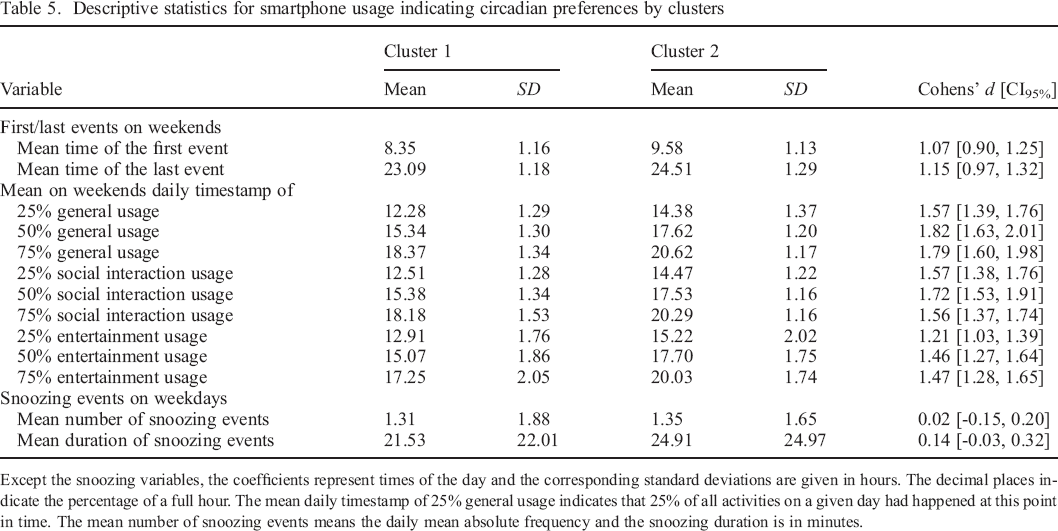
Except the snoozing variables, the coefficients represent times of the day and the corresponding standard deviations are given in hours. The decimal places indicate the percentage of a full hour. The mean daily timestamp of 25% general usage indicates that 25% of all activities on a given day had happened at this point in time. The mean number of snoozing events means the daily mean absolute frequency and the snoozing duration is in minutes.
To return to the question of whether we found different groups of individuals with similar smartphone usage patterns indicating circadian preferences, we refer to Table 5. Effect sizes for variables indicating sleep–wake timing are large, suggesting that participants assigned to cluster 2 have noticeable back–shifted diurnal smartphone usage patterns in comparison with participants assigned to cluster 1. Figure 1 shows, however, that the distributions of the two cluster groups overlap. A considerable proportion of participants could not be clearly assigned to one of the two clusters. Accordingly, the distribution based on the entire sample was not bimodal but only unimodal.
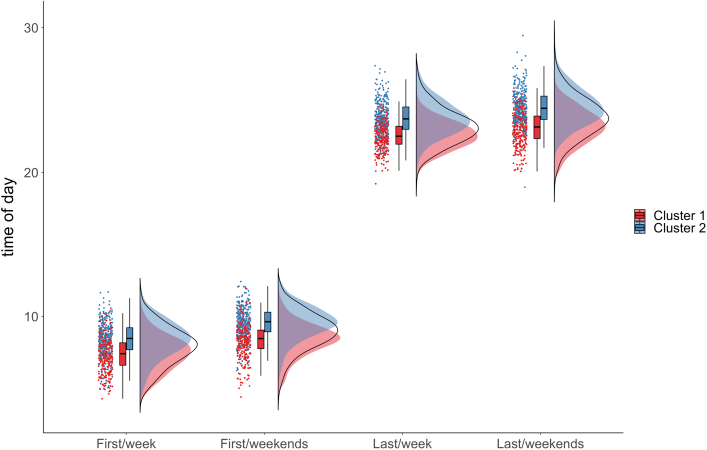
Plots displaying the distribution of mean daily first and last events on weekdays versus weekends by cluster. The black line shows the distribution based on the total sample. The ordinate axis goes beyond midnight, because last events after midnight were added to 24. An event at 26 therefore means it happened at 2.00 am.
In the second step, we also explored the factorial structure of the smartphone–based proxies for the Horne–Östberg chronotype. The empirical Kaiser criterion suggested a 3–factorial solution accounting for 62% of the variance. The obliquely (oblimin) rotated factor matrix is displayed in Table 6. Factor 1 explained 23% of the variance and comprised behavioural indicators describing markers for later diurnal smartphone usage. In contrast, the behavioural variables loading high on factor 3 (19% variance explanation) described markers characteristic for early diurnal smartphone usage. The 50% timestamps for daily (general and social interaction) smartphone usage considerably loaded on both, factors 1 and 3. Finally, factor 2 explained 20% of the variance and reflected behavioural indicators of smartphone usage for entertainment purposes independent of the time of the day. The two snoozing items did not load considerably on any factor. All factors were correlated (see Table 6).
Exploratory factor analysis of the smartphone–sensed circadian preferences
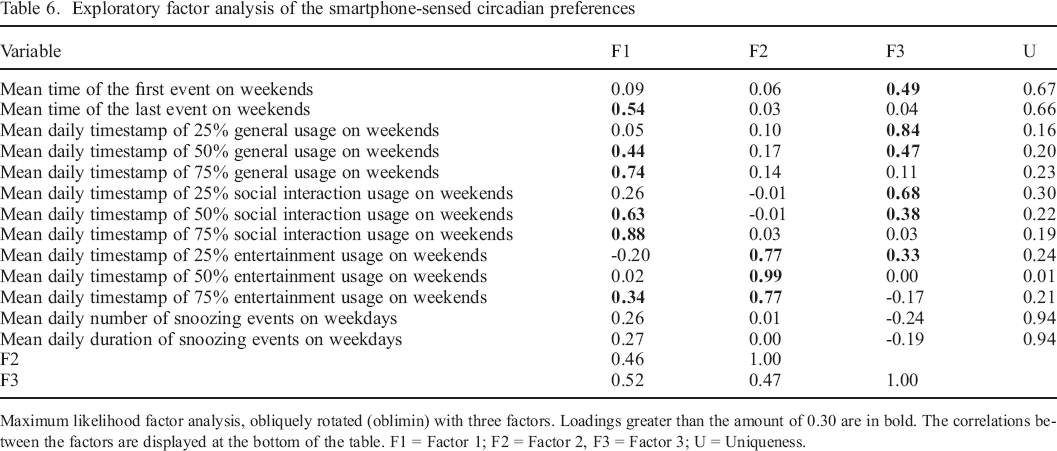
Maximum likelihood factor analysis, obliquely rotated (oblimin) with three factors. Loadings greater than the amount of 0.30 are in bold. The correlations between the factors are displayed at the bottom of the table. F1 = Factor 1; F2 = Factor 2, F3 = Factor 3; U = Uniqueness.
The Roenneberg chronotype and its correlates
The smartphone–based midpoint of sleep (MSF) and the sleep debt corrected version MSF corr , which both indicate the Roenneberg chronotype, were approximately unimodally symmetrically distributed (see Figure 2). As no weekends without alarm clock usage were available for some participants, their MSF could not be computed. Therefore, the following results are based on a subsample of n = 497 participants. On average, the mean MSF was at 4.52 am (SD = 1.42) and the MSF corr slightly earlier at 4.26 am (SD = 1.47). The MSF and MSF corr ranged between 0.75 pm and 9.91 am. The MSFwas weakly negatively related to nightly inactivity duration during the weeks (r = –0.13, CI95% [–0.21, –0.04]) as well as the weekends (r = –0.11, CI95% [–0.20, –0.03]). As suggested by Roenneberg et al. (2007), we used the MSF corr for investigating the relationship of chronotype and demographics. Age (r = –0.16, CI95% [–0.24, –0.07]) and gender (r = –0.15, CI95% [–0.23, –0.06]) were both negatively related to the corrected midpoint of sleep, indicating that older and female participants had on average earlier chronotype values. However, the age correlation should be interpreted with caution, as the plot on the right side of Figure 2 indicates that it was probably caused by data points of older participants of whom we only had few in the sample (Q3 = 25). The correlation disappears (r s = –0.03, CI95% [–0.12, 0.06]) when computing the Spearman correlation, which is only based on ranks.
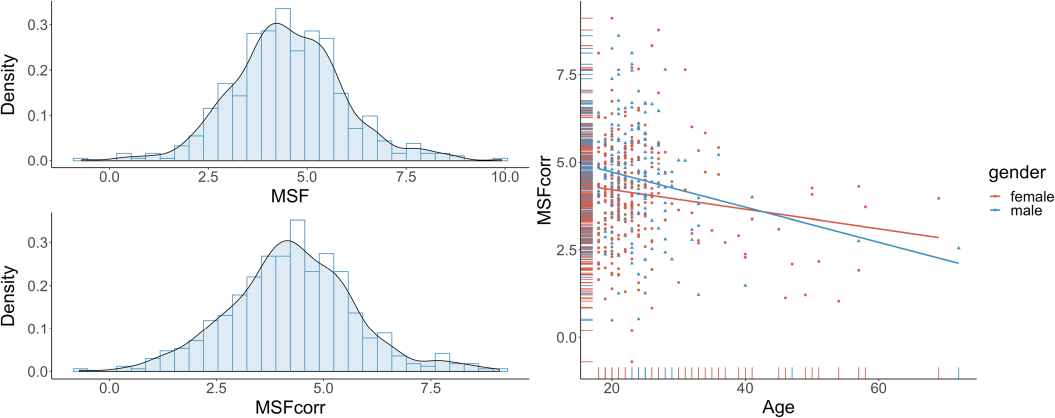
Plots displaying the distributions of the local time of the midpoint of sleep (MSF) and its sleep debt corrected version (MSFcorr) and its relationship with age divided by gender.
Day–night behaviours and personality traits
Because our analysis of relationships between behavioural day–night patterns and personality is exploratory, we do not perform any hypothesis tests, nor do we speculate about correlations on a variable–by–variable basis. Instead, based on the correlation plot displayed in Figure 3, we want to show the general result pattern and address some conspicuities. Overall, Spearman correlations ranged between r s = –0.24 (mean time of last events during the week and sense of duty) and r s = 0.15 (mean time of the first event on weekends and carefreeness). As can be seen in Figure 3, the most striking aspect is that conscientiousness and its facets (except competence) were related to various day–night behaviours. First, more conscientious people on average had earlier mean and less varying daily points of time of first and last smartphone usage events both during weeks and on weekends. Furthermore, their duration of nightly inactivity varied less on weekdays and they had lower values on the Roenneberg chronotype. Finally, individuals with higher values on the facet sense of duty snoozed on average less often and shorter on weekdays.

Pairwise complete Spearman correlations between smartphone–sensed day–night activities for weekdays versus weekends and personality traits. Male participants were coded as 0. As not all participants used alarm clock apps, the sample size for respective correlations was reduced (nweek = 506, nweekend = 371). The colour of the squares indicates the direction and the strength of the respective correlations. For better readability, correlations are presented as percentage (e.g. a value of 3 means rs = 0.03). Additionally, only correlations with greater absolute values than 0.10 are highlighted in colour.
Further but less coherent patterns in Figure 3 can be seen for openness, extraversion, and emotional stability. For example, openness to imagination showed some positive relations to day–night behavioural indicators. Openness to value and norm system was associated positively with the mean number and duration of snoozing events, especially on weekdays. Higher extraversion was related to longer smartphone checking events during nights on weekdays. Furthermore, carefreeness as a facet of emotional stability was associated positively with later day–night activity patterns. Regarding demographics, female participants’ first use on weekends and general last use was on average earlier. Accordingly, they also had lower Roenneberg chronotype values. However, no correlations of considerable size were found for age.
Using multilevel modelling to explore social jetlag
To investigate social jetlag, we explored compensatory sleep on weekends approximated as nightly inactivity duration by multilevel modelling. The duration of nightly inactivity on weekends was predicted by the duration of nightly inactivity during the week and the interindividual variables Roenneberg chronotype, big five personality traits, age, gender, and the averaged individual mean duration of nightly inactivity. The results are presented in the 12 panels in Figure 4, which show the estimates and their 95% confidence intervals across all multiverse data sets for each predictor in the model. Some aspects were evident across all data sets. There were no relationships between the nightly inactivity duration on weekends and the variables Roenneberg chronotype, openness, extraversion, agreeableness, emotional stability, and the interaction between the Roenneberg chronotype and the nightly weekday inactivity. Second, the averaged nightly inactivity duration across the study weeks (level 2) was positively associated with the nightly inactivity period on weekends. Nevertheless, estimates for the individual nightly inactivity duration on weekdays (level 1) and conscientiousness, age, and gender (all level 2) varied across the multiverse data sets. Depending on the preprocessing steps, individuals with longer nightly inactivity duration on weekdays in the corresponding week, higher conscientiousness, higher age, and male gender had, on average, longer nightly inactivity periods on weekends.
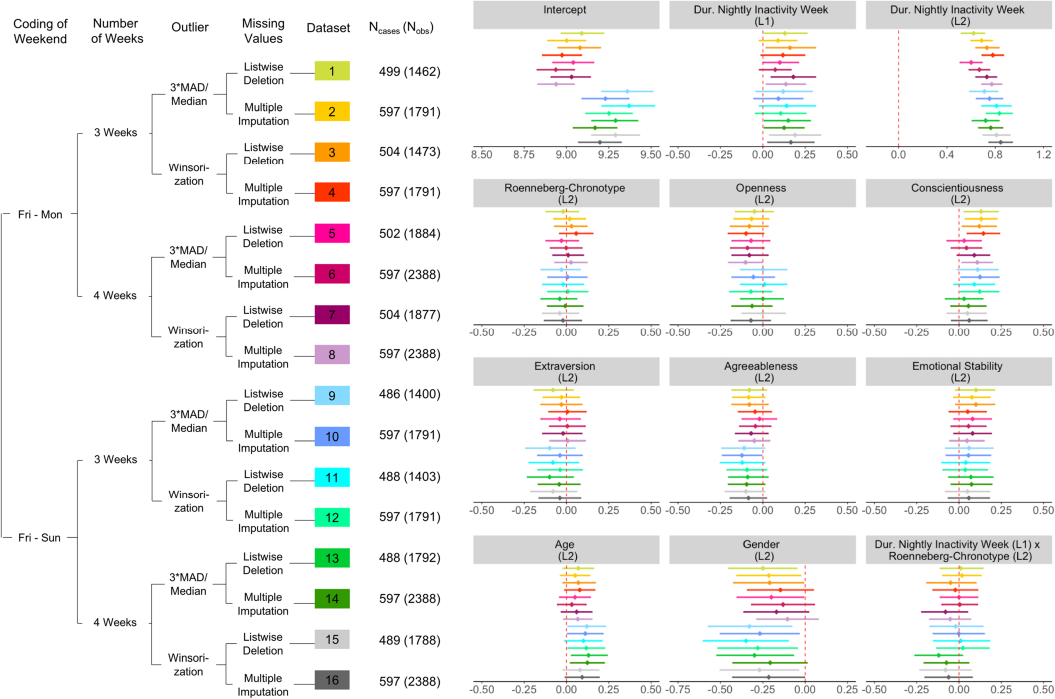
The decision tree on the left side shows how the multiverse of 16 data sets was created. The 12 panels on the right display the estimates and their 95% confidence intervals for the intercept and each predictor, resulting from multilevel modelling across the multiverse of 16 data sets. L1 = level 1 predictors (z–standardized and person–mean–centred); L2 = level 2 predictors (z–standardized, except gender). Male participants were coded as 0. The individual mean of the level 1 predictor was additionally entered as level 2 predictor. Each data set and the corresponding model are coded the same colour.
As can be seen in Figure 4, some patterns can be identified in the multiverse results across different variables: the coding of the weekend seemed to have an influence. In conditions in which the weekend was coded as nights between Friday and Monday, the mean duration of nightly inactivity on weekends was, on average, lower compared with the conditions in which weekends were coded as nights between Friday and Sunday. Also, for gender, a pattern can be determined depending on the coding of the weekend. For conscientiousness, estimates in conditions including 3 weeks were, on average, higher than conditions comprising 4 weeks. Regarding the average duration of nightly inactivity during the week (level 2), estimates were higher when winsorized and imputed.
To get a better understanding of the results concerning social jetlag, we calculated an additional multiverse analysis. For this purpose, we considered a variant of the multilevel model without personality traits and demographics as covariates. As results did not considerably differ and not to go beyond the scope of this paper, they can be found as a supplementary analysis in our OSF project.
Discussion
We investigated three prominent research questions related to common behavioural day–night patterns by using smartphone sensing data. First, we focused on individual differences in day–night activity patterns. Based on behavioural indicators of circadian preferences, we explored the structure underlying our smartphone proxy for the Horne–Östberg chronotype. Regarding the search for a smartphone chronotype, we found nondiscrete groups of individuals with similar diurnal smartphone usage patterns. In addition, our smartphone–based proxy for the Horne–Östberg chronotype turned out to be a multidimensional construct. In addition, we presented an algorithm for computing the chronotype as defined by Roenneberg et al. (2003). We used smartphone–based indicators for the midpoint of sleep and found associations with age, gender, and duration of nightly inactivity. Regarding personality traits, we found associations of conscientiousness with smartphone–sensed indicators for day–night behaviour. Finally, we explored social jetlag by examining whether people were inactive longer during weekend nights if they accumulated a deficit of nightly inactivity during the preceding workweek while controlling for individual differences. Our findings suggest that nightly inactivity duration on weekends was mainly related to individuals’ general level of nightly inactivity across all study weeks. We will critically discuss our results in the following sections. Because our research was explorative, explanations drawn post hoc should not be easily generalized but be confirmed by preregistered hypotheses testing in future studies.
Smartphone sensing in the context of behavioural day–night patterns
Individual differences in day–night activity patterns
In contrast to previous research based on self–reports, we used smartphone–sensed behavioural data to investigate the structure of chronotype and to inform both the variable–centred and the person–centred approach to chronotype. Emphasizing chronotype as a continuous dimension reflecting circadian habits, Roenneberg et al. (2003) have suggested computing the midpoint of sleep. Instead of assessing these habits by questionnaires (e.g. Roenneberg et al., 2003; Roenneberg et al., 2007), we followed Lin et al. (2019) and used smartphone sensing data to determine a smartphone equivalent for the Roenneberg chronotype. We compared our resulting measure with the findings reported by Roenneberg et al. (2007) and found similar descriptive parameters (distribution, mean) and associations with external criteria like gender and sleep duration during the week. In accordance with our assumption that smartphone–based sleep–wake timing indicators overestimate sleep times, the range of values was slightly larger for our measure. Regarding age and chronotype, we found a negative correlation, which was caused by a few older participants with lower chronotype values. However, because the age composition of our sample was highly skewed towards younger participants, we do not want to over–interpret this finding. A nonmatching result was that whereas Roenneberg et al. (2007) found a positive correlation between chronotype and sleep duration on weekends, we found a negative association. Roenneberg et al. (2007) argued that later chronotypes sleep longer on weekends because they collect a sleep debt during the workweek. In contrast to the large representative sample of their epidemiological study, our sample consisted mainly of students who are more likely to have fewer social obligations during the week than people who have a 9 am to 5 pm job. Accordingly, compared with nights during the week, our participants’ nightly inactivity (indicating sleep) did not differ considerably on weekends. Therefore, one interpretation of our results could be that students have the opportunity to be more flexible in their daily routines during the week following their chronotype. Therefore, late chronotypes do not need disproportionately more sleep on weekends. Accordingly, previous studies have shown that many students report napping after lunch during the week (Vela–Bueno et al., 2008). These naps could serve to use both the weekend and the week for sleep compensation (Gradisar et al., 2008). In line with our interpretation, students with late chronotypes have been found to nap more extensively than students with early chronotypes (Zimmermann, 2011). Please note that this is only our post hoc interpretation and further confirmatory research using behavioural data to study the interplay of sleep duration, chronotype, and work schedules is needed..
Keeping the focus on variable–centred trait assessment (Asendorpf, 2003), but following the Horne–Östberg tradition, we operationalized circadian preferences as diurnal smartphone usage behaviours and explored the underlying factorial structure. We found three correlated dimensions reflecting early use of the smartphone during the day, late use of the smartphone during the day, and entertainment usage. In comparison, findings of previous studies investigating the structure of self–reported chronotype have resulted in one to four factors (e.g. Caci et al., 2009; Lipnevich et al., 2017; Natale & Cicogna, 2002). In their recent meta–analysis, Lipnevich et al. (2017) concluded that the preferences for morningness versus eveningness are not the extreme poles of one dimension but two interdependent dimensions. Accordingly, our two correlated dimensions reflecting early and late diurnal smartphone usage activity align with their findings. Regarding our factor entertainment usage, we think that this could be regarded as a methodological artefact, as the content entertainment might have overlaid the diurnal character of the respective behavioural circadian indicators.
Dimensional approaches to personality, such as the two described above, offer the advantage to focus on individual differences. However, in contrast to person–centred approaches, they are not able to describe the structure of traits within persons (e.g. Asendorpf & van Aken, 1999; Asendorpf, 2003). In addition, types might have an advantage for applied purposes as the classification as ‘morning larks’ or ‘night owls’ is widely anchored in the popular science literature and scientific research. Therefore, besides examining dimensionality, we also explored the existence of types of individuals with similar diurnal smartphone usage patterns by using unsupervised machine learning. We found two groups that showed earlier versus later smartphone usage over the day. As the effect sizes show, these two groups considerably differed in indicators of diurnal smartphone usage patterns. However, our results also indicate that despite the high average group differences, a large number of participants could not easily be assigned to one of these two groups, which overlapped considerably in the behavioural indicators used. Therefore, we asked ourselves whether we should call the structure we found types. In previous chronotype literature, types had often been considered as empirically validated, if the resulting groups subsequently proved to be different concerning external criteria (e.g. body temperature, electroencephalography (EEG) recordings Horne & Östberg, 1976; Putilov et al., 2015). In contrast, we did not determine any cut–off values but searched for nonrandom structures in the data. Only recently, Preckel et al. (2019) followed a similar approach identifying four chronotypes in an adolescent sample. However, because circadian preferences change with age (Roenneberg et al., 2007), and our sample was older, and we focused on smartphone–sensed rather than self–reported circadian habits, we argue that the results are not fully comparable.
From a statistical point of view, the existence of types is only justified if underlying variables are multimodally distributed (Hicks, 1984; Fleiss et al., 1971), which was not the case for our behavioural day–night indicators. However, previous research in the social sciences has revealed that nonoverlapping types hardly exist for human behaviours (Meehl, 2004; Costa Jr et al., 2002). Accordingly, Asendorpf and van Aken (1999) distinguish between discrete and nondiscrete types in the context of personality research. Thus, the criteria for defining types are not uniformly defined and applied in the literature. Our results are in line with this argument. Even if there were discrete underlying chronotype groups, it is unlikely that they would appear so clearly in everyday behavioural indicators due to social obligations and societal demands. Nevertheless, the identified nondiscrete groups in our study can be a good starting point towards a smartphone–based behavioural proxy of chronotype operationalized as circadian preferences. Future research should replicate the structure in diurnal smartphone usage indicators across different samples and use external validity criteria.
Conscientiousness and differences in behavioural day–night patterns
In contrast to the majority of previous studies, we used behavioural markers for day–night activity patterns to investigate associations with personality traits and demographics. In line with past studies showing women's preference for morningness (Randler, 2007), women in our study were earlier in the day, and their day–night activity timing varied less. Besides, our results were consistent with previous research showing a majorly coherent pattern of day–night activity and conscientiousness (Adan et al., 2012; Lipnevich et al., 2017) but less clear relations for other big five personality traits (e.g. Gray & Watson, 2002; Randler et al., 2017). Precisely, highly conscientious participants on average showed lower and less varying sleep–wake timing indicators and lower Roenneberg chronotype values. Following questionnaire–based research (Adan et al., 2012; Lipnevich et al., 2017; Tsaousis, 2010; Križan & Hisler, 2019), our results indicate that more conscientious people on averagen are active earlier during the day and have longer nightly rest periods on weekends. Compared with findings from a meta–analysis (r = .33 according to Tsaousis, 2010), our correlations were smaller. However, our findings show that more conscientious people, who describe themselves as dutiful, ambitious, and disciplined (Arendasy, 2009), also act accordingly in everyday life (e.g. getting up early in the morning, longer nightly rest on weekends). Accordingly, Spears et al. (2019) found in a recent longitudinal study that conscientiousness was associated with mortality risk after 10 years and that this association was mediated by sleep duration as an everyday expression of behaviour.
In contrast to previous findings, conscientiousness and emotional stability were not related to indicators for sleep continuity, but extraversion was (Križan & Hisler, 2019; Sutin et al., 2019; Sella et al., 2020). These recent studies measured sleep continuity using actigraphy and therefore used completely different operationalizations of the related indicators sleep fragmentation and wake up after bed (Križan & Hisler, 2019; Sutin et al., 2019; Sella et al., 2020). For example, Sella et al. (2020) defined sleep fragmentation as the number of awakenings exceeding a certain duration. In contrast to actigraphy, smartphone sensing does not provide continuous measurement of wakefulness but approximates this measure via active smartphone usage. This requires the determination of a specific threshold value to classify smartphone usage either as part of a continuous usage phase belonging to the last or first event of the day or as a short usage event during the period of otherwise nightly inactivity. Determining a threshold value according to this principle, our approach has two significant drawbacks. First, using 2 minutes as a threshold was a subjective decision due to the lack of empirical data from previous literature. Second, the derived variable checking duration is restricted in its variance by a maximum value of 2 minutes. Consequently, individual differences in the actual wake after sleep onset might be masked by our smartphone–based operationalization, which in turn could explain the differences in findings compared with actigraphy.
n addition, we did not find some of the relationships that have previously been reported. For example, in our data, we did not find associations between a preference for morningness and agreeableness (Adan et al., 2012; Tsaousis, 2010) or age (Adan et al., 2012). As already discussed in the previous section, our results regarding age should be interpreted with caution due to the restricted variability of age in our sample. Overall, the differing findings could result from the usage of actual behavioural variables in contrast to self–reported preferences in most previous studies. Additionally, differences with past studies might not be surprising considering that previous questionnaire–based research is not clear either (e.g. Duggan et al., 2014; Gray & Watson, 2002). Besides, to the best of our knowledge, we have been the first to explore differences in alarm clock app usage. Our results provide first indications about the relation of snoozing behaviour and personality facets (sense of duty and openness to value and norm system). They should be further investigated in future research.
Individual differences in compensatory nightly inactivity on weekends
To explore social jetlag, we investigated which intraindividual and interindividual factors predict the duration of nightly inactivity of smartphone usage (assumed to indicate sleep duration) on weekends. To explore this research question and to get an impression of the robustness of our estimates, we created a multiverse of 16 data sets resulting from combining different choices of plausible preprocessing steps. In the following, we focus only on those aspects that have been demonstrated across all data sets. Individuals who had higher overall levels of smartphone inactivity during nights on weekdays were also inactive longer on weekend nights. Even though our inactivity measure is not identical to sleep, our results indicate that individuals differ in their nightly rest duration. These findings support the notion that sleep duration is an independent trait (Ferrara & De Gennaro, 2001; Roenneberg et al., 2007). In contrast to the assumptions of social jetlag (Roenneberg et al., 2015; Wittmann et al., 2006), we neither found compensatory nightly inactivity on weekends nor any impact of the Roenneberg chronotype. As already discussed in the section above, our sample was highly skewed towards students. Thus, maybe their social obligations during the week are less pronounced, and therefore, we could not find their need for compensatory sleep on weekends. In addition, previous studies often used self–reports to investigate social jetlag (e.g. Wittmann et al., 2006; Roenneberg et al., 2012). Even though participants are instructed to indicate their habits for the last 4 weeks (Roenneberg et al., 2003), their answers might be biased towards a more general judgment of sleep–wake timing or influenced by short–term experiences like the sleep behaviour of the previous night. In contrast, we looked at behavioural snippets of 3 or 4 concrete weeks.
Finally, our multiverse analysis showed that the results depend on the selected preprocessing steps. Especially for the predictors age, gender, and conscientiousness, the size of the estimates differed depending on the constructed data sets. Our study therefore points to two problems. First, for behavioural indicators extracted from smartphone sensing data, the definition of the weekend and the number of weeks included made a difference to the results. Future research in the field of smartphone sensing should, therefore, carefully explore and report whether decisions made in the preprocessing have an impact on the results. Second, our study highlights the issue of selective reporting in research articles (Simonsohn et al., 2015; Steegen et al., 2016). We could just as well have reported only one of the paths and the results of the corresponding model, and the choice of each path would have been equally plausible. However, depending on the preprocessing decisions, we might or might not have emphasized the effect of conscientiousness or gender or age at this point. In line with Simonsohn et al. (2015) and Steegen et al. (2016), we argue that decisions that might affect the results should be made transparent.
Limitations and outlook
Our study exemplifies the usage of smartphone sensing data in the research field of behavioural day–night patterns. Strictly speaking, the assessment of day–night structures in everyday life and, therefore, sleep–wake phases would require the collection of EEG data (Shambroom et al., 2012). For reasons of efficiency, self–report questionnaires have so far been used to approximate sleep–related behaviours. We propose smartphone sensing as an alternative to collect proxies for these behaviours. However, our approach has some limitations.
First, similar to questionnaires (Lauderdale et al., 2008), our behavioural markers are only proxies for actual sleep–wake timing. In our data set, only app, phone, screen, and notification events were available to determine the nightly inactivity period. Thus, actual sleep times were estimated based on active smartphone usage behaviours. However, for improving the accuracy of smartphone–based sleep–wake indicators, it would be helpful to include sensor data that do not require active usage, for example, brightness and ambient noise (Min et al., 2014). An even better estimate of sleep could be obtained by integrating the idea of actigraphy into the smartphone sensing approach. Meanwhile, many commercial wearables, which can also be used conveniently during bedtime, offer an open interface to integrate motion and physiological data like heart rate variability or galvanic skin response into research apps used for smartphone sensing.
Second, we defined new behavioural variables, which we extracted from smartphone sensing data. Although we derived our variables from previous literature, we had many degrees of freedom. Which period is defined as a weekend? What does active smartphone usage mean? How can daily values be aggregated? These questions are only a few examples for the vast amount of decisions we had to make during data preprocessing. To make this process as transparent as possible, we provide an extensive codebook and analyse a multiverse of data sets where appropriate. However, the researcher community should develop a common standard for sensing data so that the results obtained do not depend on the respective data preprocessing decisions in individual studies.
One further limitation of our study was the skewed sample. In comparison with previous epidemiological studies, it was skewed in terms of age and occupation. As age and work schedules are related to sleep–wake timings (Adan et al., 2012), future studies using smartphone sensing data should use more representative samples.
Finally, in our study, we only focused on smartphone sensing data. Although resulting indicators cannot be equated one–to–one with physiological sleep, smartphone sensing can nevertheless unobtrusively collect data in the field over a long period. This is very beneficial as far as day–night habits are investigated. However, in research focusing on constructs like sleep quality (Križan & Hisler, 2019), it is essential to measure a possible mismatch between behavioural sleep indicators in contrast to individual perceptions and feelings about sleep–wake timings. Consequently, the integration of the experience sampling method (e.g. Takano et al., 2014) could help to gain further interesting insights in individual differences into behavioural day–night patterns. Future studies could additionally benefit from combining actigraphy and smartphone sensing. Both methods assess actual behaviour but highlight different aspects of day–night activity patterns (Borger et al., 2019). In summary, we do not want to discuss whether self–reports, smartphone sensing, or actigraphy are better suitable for depicting actual behavioural day–night patterns. We think that all data collection approaches have their place and could be very fruitfully combined to gain better insights into human day–night behaviour patterns.
Conclusion
We used smartphone sensing data to extract behavioural variables usually assessed by self–reports in the context of day–night behaviours. Our study contributes to gain new insights into traits related to day–night behaviour patterns. First, we investigated two prominent operationalizations of chronotype: based on indicators for sleep–wake timing and diurnal activity, we found two overlapping groups of smartphone–based ‘morning larks’ and ‘night owls’ and two correlated dimensions that were similar to previously reported questionnaire–based factors. By computing a smartphone–based proxy, we presented a smartphone–sensed measure for the Roenneberg chronotype. Second, conscientiousness was related to earlier day schedules. In addition, we found individuals to differ in their overall level of nightly rest. We argue that it is important to understand individual differences in behavioural day–night patterns, as they previously have been found to be related to individuals’ well–being and health. This work demonstrates that smartphone sensing provides an efficient and ecologically valid tool that can help to foster this understanding.
Acknowledgements
We want to thank all PhoneStudy team members for making this research possible. Special thanks go to Theresa Ullmann, Michelle Oldemeier, Florian Bemmann, Daniel Buschek, Florian Lehmann, Daniela Becker, and Peter Ehrich. In addition, we thank all involved students for supporting us by recruiting participants. Finally, we want to thank David Goretzko and Caroline Zygar–Hoffmann for their helpful advice.
Supporting Information
Supporting Information, per2258-sup-0001 - To Challenge the Morning Lark and the Night Owl: Using Smartphone Sensing Data to Investigate Day–Night Behaviour Patterns
Supporting Information, per2258-sup-0001 for To Challenge the Morning Lark and the Night Owl: Using Smartphone Sensing Data to Investigate Day–Night Behaviour Patterns by RAMONA SCHOEDEL, FLORIAN PARGENT, QUAY AU, SARAH THERES Völkel, TOBIAS SCHUWERK, MARKUS Bühner and CLEMENS STACHL, in European Journal of Personality
Footnotes
Supporting Information
Additional supporting information may be found online in the Supporting Information section at the end of the article.