
Abstract
The present research provides the first direct examination of human values through concept categorization tasks that entail judging the meaning of values. Seven studies containing data from nine samples (N = 1086) in two countries (the UK and Brazil) asked participants to compare the meaning of different values found within influential quasi–circumplex model of values. Different methods were used across experiments, including direct similarity judgment tasks, pile sorting, and spatial arrangement. The results of these diverse conceptual assessments corresponded to spatial configurations that are broadly convergent with Schwartz's model, both between and within participants. © 2018 The Authors. European Journal of Personality published by John Wiley & Sons Ltd on behalf of European Association of Personality Psychology
Human values are desirable, trans–situational goals that vary in importance (Schwartz, 1992). Examples include abstract ideals such as freedom, creativity, equality, power, and freedom. As abstract concepts, values can be construed in diverse ways that have implications for how we use them as self–regulatory devices (see Maio, 2016) and as tools to justify or explain our behaviour (e.g. Eiser, 1987; Kristiansen & Zanna, 1988). To some extent, progress in understanding these meaning construals has been made by models that have distinguished among motives expressed by values (see, e.g. Gouveia, Milfont, & Guerra, 2014; Hofstede, 1980; Inglehart, 1977; Rokeach, 1973; Schwartz et al., 2001), while articulating their connections to human attitudes (Maio, Olson, & Bernard, 2006) and actions (Hitlin & Piliavin, 2004). Research has also shown how value differences are related to idiosyncratic social experiences and the sociocultural context of each person (Gouveia et al., 2014), in addition to biological and neurological factors (Leszkowicz, Linden, Maio, & Ihssen, 2016; Schermer, Vernon, Maio, & Jang, 2011; Zacharopoulos et al., 2017; Zahn et al., 2009). However, despite these advances, research has not examined the crucial question of how people conceptually map their values. As described in the succeeding text, research has focused on motivational representations of values and side–stepped the issue of conceptual similarity and diversity. The present research provides the first direct empirical examination of people's conceptual representations of values using tasks that explicitly ask about mental representations of values.
Schwartz's theory of basic human values
The most widely cited model of values is the Theory of Basic Human Values, developed by Schwartz (1992; Schwartz et al., 2012). Research has demonstrated its utility across personality, social, and cross–cultural psychology. The model postulates a universal, circular organization of human values in a space defined by motivations (see Figure 1) and has emerged frequently as a powerful theoretical perspective that is empirically supported with data from 80 nations around the world (Schwartz et al., 2012).
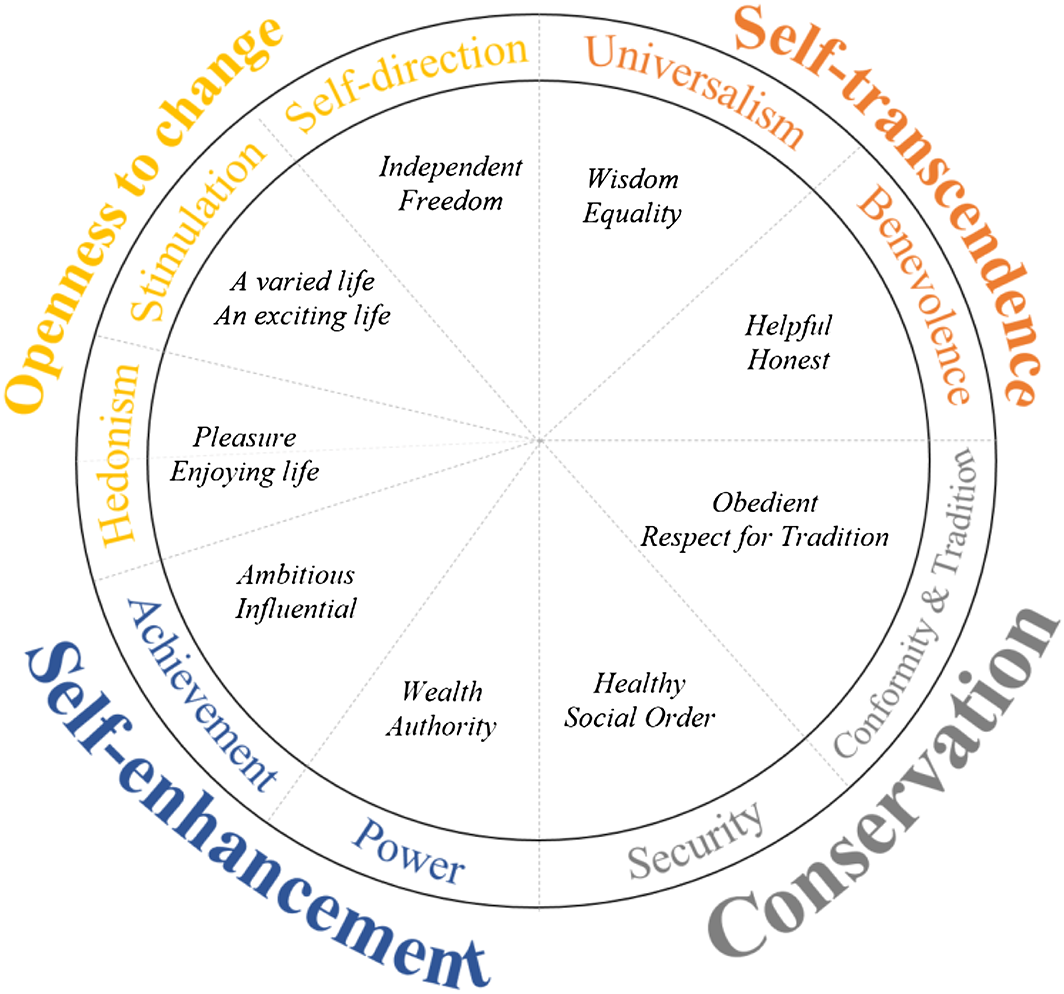
Schwartz's quasi–circumplex model of human values (in italic, examples of values). Adapted from Schwartz (1992). [Colour figure can be viewed at wileyonlinelibrary.com]
In its original version, 57 values (e.g. equality and wisdom) are spread across 10 value types (e.g. universalism and stimulation). As shown in Figure 1, these value types are positioned in relation to the two bipolar motivation dimensions, openness to change versus conservation and self–enhancement versus self–transcendence. These four quadrants of the two dimensions are also known as higher order values.
A crucial element of Schwartz's model is that values express different motivational synergies and conflicts. For example, achievement values (e.g. personal success) are adjacent to power values (e.g. dominance), because of a similar underlying motivation to self–enhance. Conversely, achievement is opposed to benevolence values (preserving and enhancing the welfare of the in–group), because the underlying motivations of these two sets of values (benefit the self versus benefit others) are putatively in conflict. The model predicts that adjacent values are more likely to be similar in importance than orthogonal values, which may be less similar in importance than opposing values. However, it is not clear that this pattern should hold for every person. For example, for general practitioners of medicine to be successful, they presumably need to value the opposing values achievement and benevolence. Therefore, benevolence and achievement could be next to each other in the two–dimensional space within a sample of general practitioners. More relevant to the present research, an unanswered question has been whether the postulated relations are consistent with the structure of values as conceptual categories.
Conceptual representations of human values
It is a natural human impulse, when facing something new, to interpret it as part of a category (Goldstone, Kersten, & Carvalho, 2012). Our cognitive system supports the classification of new objects in terms of concepts, placing them together with previously encountered items. In other words, we cognitively assess if the new object is similar to old ones (Hahn & Chater, 1997). These classifications in terms of concepts are important to provide ‘semantic knowledge’ for words, giving them meaning and allowing the comprehension of verbal communication (Kiefer & Pulvermüller, 2012). For instance, in school, concepts help children to attribute a meaning to mathematical terms (e.g. adjacent angle, acute angle, and obtuse angle), which they organize in a way that makes sense to them (e.g. geometry, trigonometry, and ‘maths stuff’).
A concept can be understood as a ‘mental representation of a class or individual and deals with what is being represented and how that information is typically used during the categorization’ (Smith, 1989, p. 502). The process of how the categories are represented and organized by individuals is known as conceptual representation (Markman, 2006).
Assessing value concepts will allow us to understand how individuals categorize values based on their knowledge, coming from their past experience and given meaning. Also, Schwartz's model focuses on motivational contents in considering relations between values. Multidimensional scaling (MDS) plots based on correlations between value importance ratings are crucial for tapping the motivational aspect of values, which is a key aspect of what is meant by values (because of their motivational significance to the self). Nonetheless, similarities and differences in motivational content among values are built on people's understanding of the values as concepts, but the conceptual representation of values has not been directly examined.
Ironically, a test that is frequently used to assess conceptual representations has instead been used to examine the motivational interrelations between values. Specifically, the motivational relations have been tested by subjecting correlations between ratings of value importance to MDS to test Schwartz's structure (e.g. Bilsky, Janik, & Schwartz, 2011). Using MDS analysis of value correlations (see Figure 2 for an example), the quasi–circumplex structure of values has been found in common space plots of data from different samples (e.g. students, teachers, and clinicians), for the perceived values of other people (e.g. perceived familial and societal values) and a variety of assessment techniques (e.g. self–reports and response latencies; Fontaine, Poortinga, Delbeke, & Schwartz, 2008; Hanel, Wolfradt, et al., 2018; Pakizeh, Gebauer, & Maio, 2007; Schwartz, 1992, 1994; Schwartz & Boehnke, 2004).
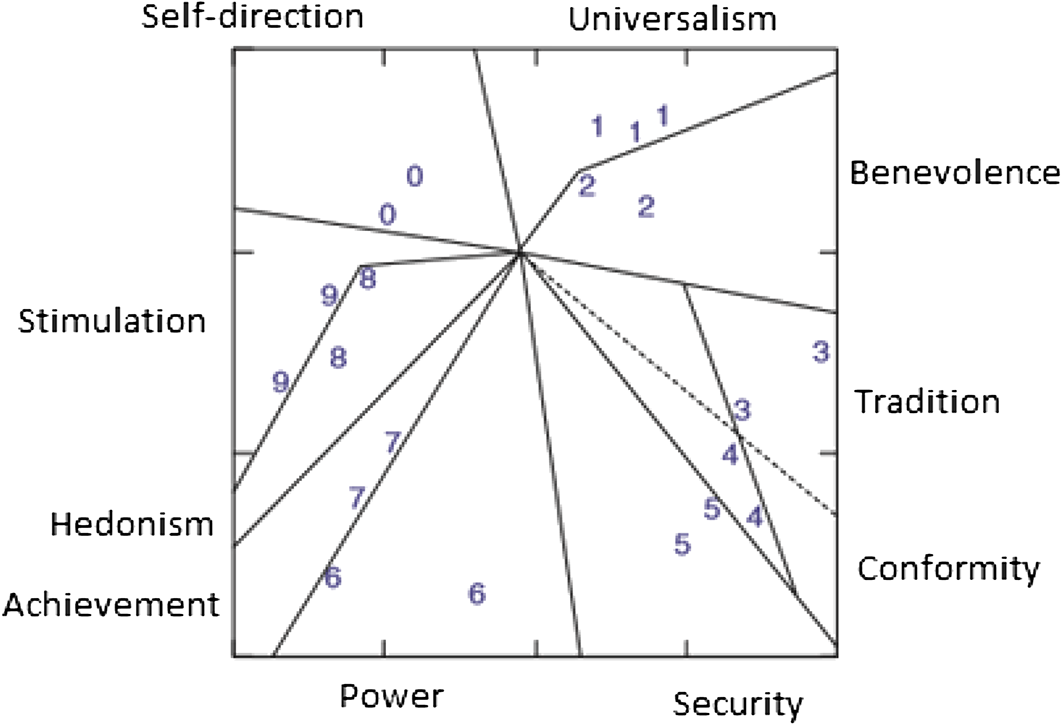
An example of multidimensional scaling applied to human values (Bilsky et al., 2011). Each number indicates the positions of the values in their respective value type. [Colour figure can be viewed at wileyonlinelibrary.com]
Multidimensional scaling is commonly used to analyse people's explicit judgments of the conceptual similarity of objects (Borg, Groenen, & Mair, 2012), with these judgments providing a spatial representation wherein item proximity can be interpreted as an indicator of conceptual similarity: Similar items are positioned more closely together than dissimilar items (Hout, Papesh, & Goldinger, 2013). The focus on more direct comparisons of the abstract concepts enables a more direct probe of their role in human concept categorization, as the values arise from abstractions or generalizations from previous experiences. Similarity has been widely considered as a basic psychological property in the categorization literature, as can be seen in prototype and exemplar theories (Medin & Schaffer, 1978; Minda & Smith, 2001; Murphy, 2004). Although these two theories differ in how they represent categories, they both rely on similarity. When presented with a putative new instance of a category, the similarity of that instance to the relevant representations (e.g. a single prototype and a set of examples) is used as a basis for assigning that instance to a category (Medin & Schaffer, 1978; Minda & Smith, 2001; Murphy, 2004). Thus, when presenting different pairs of value concepts to individuals, people are able to make categorizations based on their understanding of these values.
The results of people's conceptual comparisons of values may differ from the motivational interrelations between values. For instance, some individuals might think of wealth, a self–enhancement value, as similar to self–transcendence values (e.g. helpfulness and broadmindedness) because of past experiences that pair the values continuously (e.g. earning money to save lives as a doctor and saving money to work abroad as a volunteer), even though they might recognize conflicting motives between these values in many circumstances (e.g. decisions about whether to donate money to a beggar and spending time to help another with coursework). Therefore, values that have different underlying motives could nevertheless be similar and thus correspond to a different spatial arrangement.
Assessing similarities affords a closer look at the conceptual representations of the meaning of the values, without scrutiny of the aforementioned motives. This analysis can be important for theory development, as was recently illustrated by Koch, Imhoff, Dotsch, Unkelbach, and Alves (2016). These investigators applied MDS to similarity judgments in the context of Fiske, Cuddy, Glick, and Xu's (2002) highly influential model of stereotype content and found that the model can be improved with an added dimension. This ability to tap meaning is vital for models of values because of the abstract nature of value concepts. Many theories of values, including Schwartz's perspective, recognize the importance of diverse affective, cognitive, and behavioural components of values (see also Rokeach, 1973), which are also directly tied to specific contexts and actions that people use in mental representations of values (Maio, 2010). A number of experiments have shown that the concrete content that people provide for values makes a difference in how values relate to subsequent action (e.g. Maio, Hahn, Frost, & Cheung, 2009; Maio, Olson, Allen, & Bernard, 2001). Therefore, it is possible that the relations between values as inferred from motive endorsement may be different from those inferred from other value–concept assessments, such as similarity ratings. For example, some values might be more conceptually related to opposing or adjacent value types, depending on individuals’ mental representations. Indeed, prior research by Pakizeh et al. (2007) noted empirical differences between conceptual similarity and similarities in value importance judgments. These researchers found only a modest association between participants’ judgments of the semantic similarity of pairs of values and discrepancies in value importance (r = −0.26, p < 0.001). However, Pakizeh et al. did not attempt to map conceptual representations of values using the similarity judgments and test whether the circular structure of values held in these representations.
Fortunately, the use of similarity and categorization judgments in MDS is well–suited to revealing these conceptual representations with relatively high precision. This precision arises because the MDS matrix provides similarities judgments for all pairs of items, generating a spatial map of values based on a more direct task. This approach allows a within–subject assessment of the value space, because participants directly compare the similarities between values. In contrast to reliance on between–subject covariance in value importance judgments, this approach generates a more valid plane because each participant provides more data, explicitly considering the relations of each item (e.g. value) to all other items, rather than merely using a single set of between–participant correlations to furnish the proximity data.
Prior research supports the utility of this within–person approach. Across 17 European countries, Gollan and Witte (2014) replicated the quasi–circumplex structure. The proposed structure was also found within–persons across countries (e.g. the UK, the USA, and Iran) and across value measures (e.g. Schwartz values survey and portrait values questionnaire; Borg, Bardi, & Schwartz, 2017). However, these studies relied on importance ratings to assess the motivational structure of Schwartz's model, while our studies assess the conceptual similarities through direct comparisons.
The present research
Previous research has assessed the quasi–circumplex structure of Schwartz model in the UK and in Brazil with scales that relied on importance ratings. In the UK, Bilsky et al. (2011) found support for the quasi–circumplex structure across three representative samples. In Brazil, the structure was also replicated (Sambiase, Teixeira, Bilsky, Felix, & Domenico, 2010; Tamayo & Porto, 2009; Tamayo & Schwartz, 1993), although some minor deviations emerged. For example, some value types merged (e.g. hedonism and stimulation, Tamayo & Schwartz, 1993; stimulation and self–direction, Sambiase et al., 2010) or swapped positions (e.g. stimulation and benevolence; Tamayo & Porto, 2009). Consistently, the value types universalism and benevolence tended to occupy the same region across studies in Brazil. Fontaine et al. (2008) point to several possible explanations for deviations in values structure, including sample differences (e.g. general population and student sample), the meaning attributed to values cross–culturally, and national development.
Unlike past research using value correlations, the aim of our research was to provide a direct analysis of conceptual representations of values by applying MDS analyses (Studies 1, 2, 3, 4, 6, and 7) and common space plots (Study 5) to different categorization tasks. These methods were applied to similarity judgments of values through seven studies and nine samples across two countries (seven samples from the UK and two from Brazil). Furthermore, we assessed all three conceptual levels in Schwartz's model of values. That is, we asked participants to make comparisons involving specific values, value types, and value dimensions (cf. Figure 1). In Study 1, participants judged the similarity between specific values from Schwartz's model. In Study 2, participants judged the similarities of the 10 value types, and, in Study 3, participants were asked to compare all 57 values from Schwartz's theory to the 10 value types. In Study 4, participants compared how similar the value items are to the four higher order values. Study 5 elicited judgments of the meaning of values by asking participants to position the human values along Schwartz's two motivational dimensions. To provide an even more diverse assessment, Studies 6 and 7 assessed the structure of all value items with a pile sorting task and a spatial arrangement task. Together, these methods provided the first assessment of the structure of values based on their perceived similarities.
Methodologically, we assessed the fit between the data from experiment and the locations in Schwartz's model using a Procrustean superimposing approach (Peres–Neto & Jackson, 2001). This method can be applied to the outcome of an MDS, such as the axes of spatial configuration, but also on an individual level, as we demonstrate in Study 7. Study 1 describes how this analysis works.
The combined sample size across all nine samples is 1086 participants. Our research questions were of an exploratory nature. All data, statistical code, instructions, tasks, and Online Supplementary Material (OSM) are available through the link https://goo.gl/Vutc5K. In the OSM, you can also find task examples, Sheppard Plots, Stress–per–point tables, and Procrustes rotation figures for Study 7.
Study 1
The purpose of this study was to use similarity judgments between values to derive an MDS spatial arrangement describing conceptual representations of the values. Specifically, we aimed to test whether our approach would reproduce the quasi–circumplex structure, using a subset of all 57 values in Schwartz's model. Comparing all 57 values from Schwartz's model would yield 1596 comparisons, which would require a long period of time, leading to boredom or loss of concentration. Consequently, our first study asked participants to consider only 16 values, which were selected as being well–spaced among the quadrants from Schwartz's (1992) theory. The relations of between all values in Schwartz's model were investigated using different methods in Studies 6 and 7.
Method
Participants
Participants were 109 psychology students (n = 93 women; n = 16 men; Mage = 19.78; SD = 3.05), who took part in exchange for course credit.
Materials and procedure
Participants were asked to rate the similarity of 16 values (e.g. social order), across the four higher–order value quadrants in Schwartz's model, using items from the Schwartz Value Survey (SVS; Schwartz, 1992). Specifically, they were presented with one value and then asked to rate how similar they personally thought this value was to a list of other values. This rating was made using a sliding scale from 0 (completely different) to 100 (extremely similar) to make 120 comparisons between values. They were instructed to click on the slider and move it towards the rating that best described the similarity between the pair of values. Participants began by comparing one value with the other 15 values on one screen, and then a new screen appeared. The new screen asked participants to compare another of the 15 values with the other 14 values, and so on until just two values were remaining for comparison, with a total of 120 comparisons between values. Value items were presented in alphabetical order (ambition, equality, exciting life, and so on...). To see the full instructions and the complete tasks, for this and the next studies, please access https://goo.gl/Vutc5K.
The values in the self–enhancement quadrant were wealth, ambition, intelligent, and preserving my public image; the values in the self–transcendence quadrant were social justice, helpful, and equality; the values in the conservation quadrant were obedient, respect for tradition, national security, and social order; the values in the openness to change quadrant were independent, self–respect, exciting life, pleasure, and freedom.
Results and Discussion
Multidimensional scaling methodology
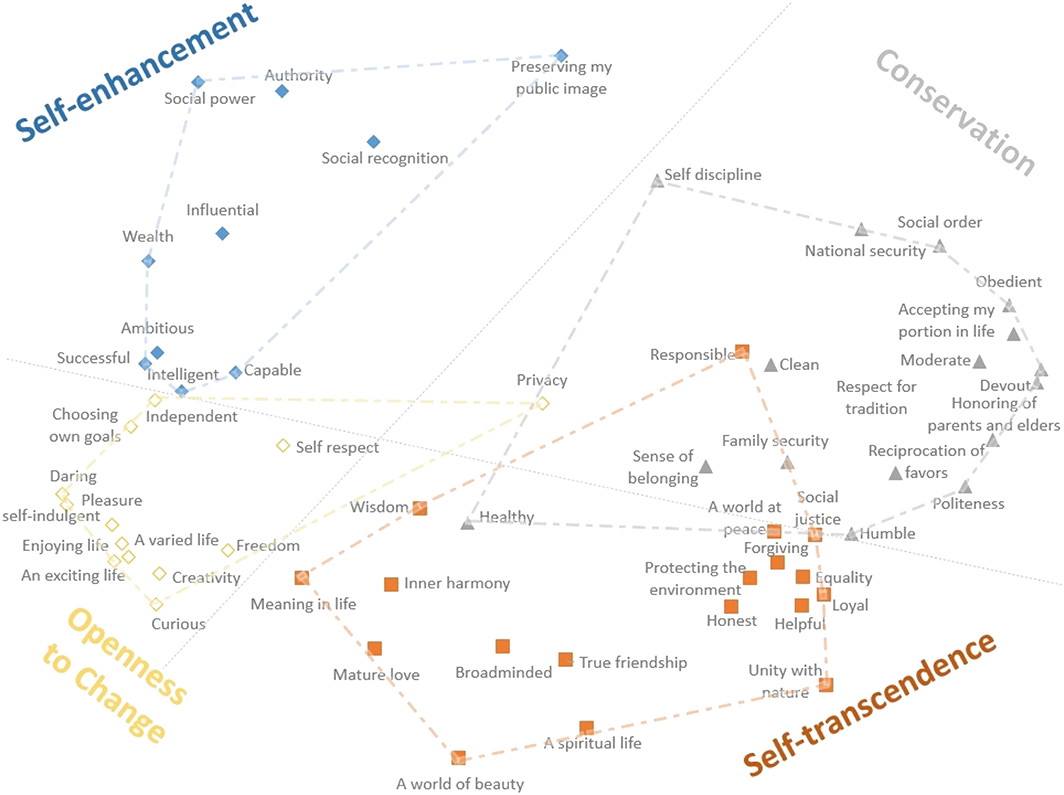
The means of all 120 comparisons were calculated, creating a half–matrix data set, also known as a triangular matrix. Next, an ordinal MDS on the half–matrix was performed using the PROXSCAL algorithm. This algorithm creates a geometric representation of the data, respecting the proximity of the items (Hout et al., 2013). The Torgerson configuration was selected as the initial configuration. This configuration is also known as classical MDS and aims to create a two–dimensional representation of high–dimensional data (Brandes & Pich, 2007). Stress–I was used to indicate the model's goodness of fit, considering the difference between the input proximities and output distances in the Cartesian plane (Jaworska & Chupetlovska–Anastasova, 2009). Lower values indicate a better model fit. In all of our studies using MDS, we employed the cut–off values proposed by Sturrock and Rocha (2000); these cut–offs consider the number of points and dimensions presented in the analyses. For this study, with 16 values in two dimensions, a Stress–I lower than 0.24 is recommended. Therefore, our results indicate a good model fit using this criterion (Stress–I = 0.14; cf. Figure 3). We also tested the stress–per–point of the model—the extent to which each one of the values contributes to the total stress. That is, we considered the normalized raw stress (
However, these indices indicate only how well the data can be characterized in a two–dimensional space and not whether the data are consistent with the specific two–dimensional space in Schwartz's proposed structure. The data could fit into a two–dimensional space with values positioned very differently from Schwartz's model. To assess this fit to Schwartz's model, we used Procrustes analysis (‘Protest’; Peres–Neto & Jackson, 2001), which tests the degree to which two sets of points align. Specifically, Protest ‘compares two ordinations using symmetric Procrustes analysis’ (Oksanen, 2015) by minimizing the sum–of–squared differences through rescaling the configurations to a common size, mirror reflecting (if necessary), and rotating (Peres–Neto & Jackson, 2001). Protest is therefore also known as an analysis of congruence (Oksanen, 2015).
To perform the analysis, we needed two configurations whose congruence we assessed through superimposition. The data were one configuration, and hypothetical coordinates for Schwartz's (1992) model were the other configuration. We specified the coordinates of Schwartz's model by approximating them through visual inspections to the MDS output coordinates from Schwartz (1992). For example, the four self–enhancement values were expected to be on x (axis) = 0 and y (axis) = 0.5, and the four conservation values on x = 0.5, and y = 0, as shown in Figure 3. For a better visualization, we also used the convex hull (the dashed lines connecting the values) in Figure 3, which provides the smallest convex set of values to each higher order value. This method was also applied to the spatial planes derived in the other studies we conducted. Note that it is not necessary to match the starting coordinates to the model fit, because the Protest function rotates and mirror reflects the coordinates if necessary, but some starting configurations that are in line with Schwartz's model are needed. Further, we focused on fit to the four higher order values rather than breaking the analysis down to the 10 value types because we were only interested in a fit to the overall model rather than small deviations within each value type.
Data were analysed with the R package ‘vegan’ (version 2.5–1; Oksanen et al., 2018), which has a Protest function based on Peres–Neto and Jackson (2001). The Protest returns a correlation–like effect size and estimates its statistical significance. Although the correlation–like effect size, which is called ‘correlation in a symmetric Procrustes rotation’, is often labelled as r (e.g. Oksanen, 2015), we will refer to it as rm to avoid confusion with the Pearson's correlation coefficient r. Larger correlations imply a better fit, and significant results indicate a match between the two sets of points. Procrustes rotation assumes that two different configurations with the same number of points are being compared. In our case, however, these points are from different levels: Our data are from the value item level, while the hypothetical configurations use coordinates from the four higher order values. This difference regarding the nature of the points means that we did not expect to find a perfect fit, because the values items of one higher order value were not all expected to be in the same position. For Study 1, the fit of the data to the model was significant: rm = 0.86, p ≤ 0.001.
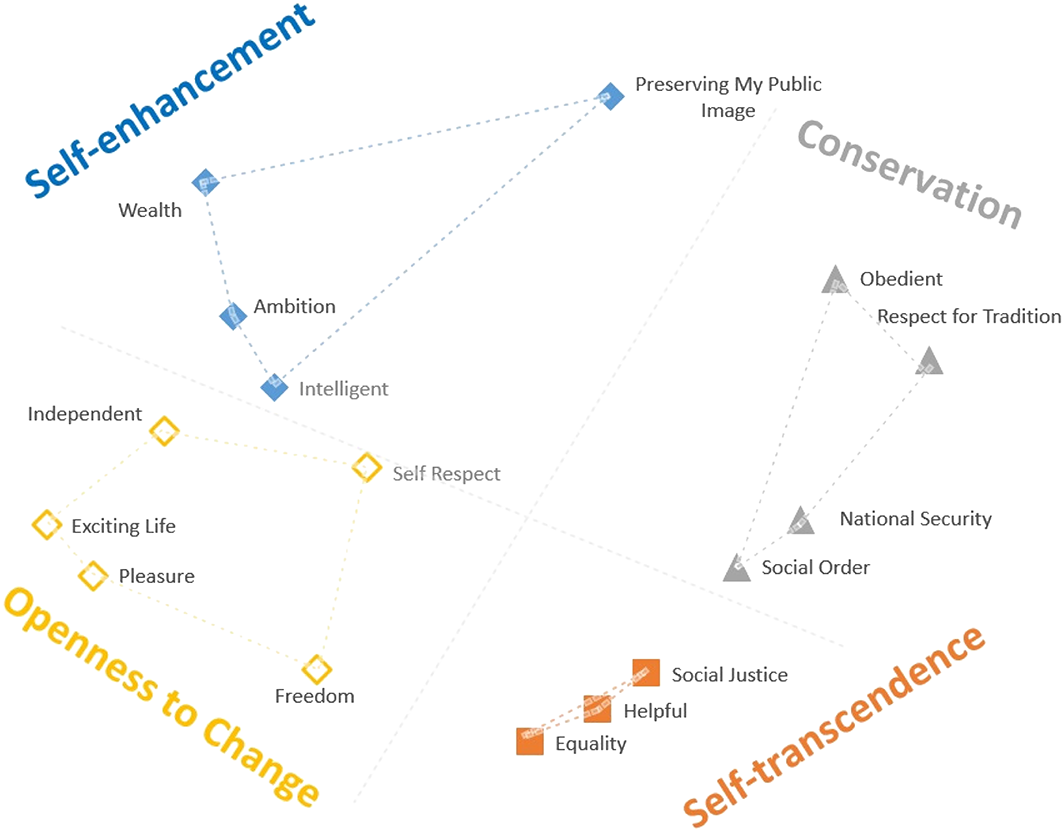
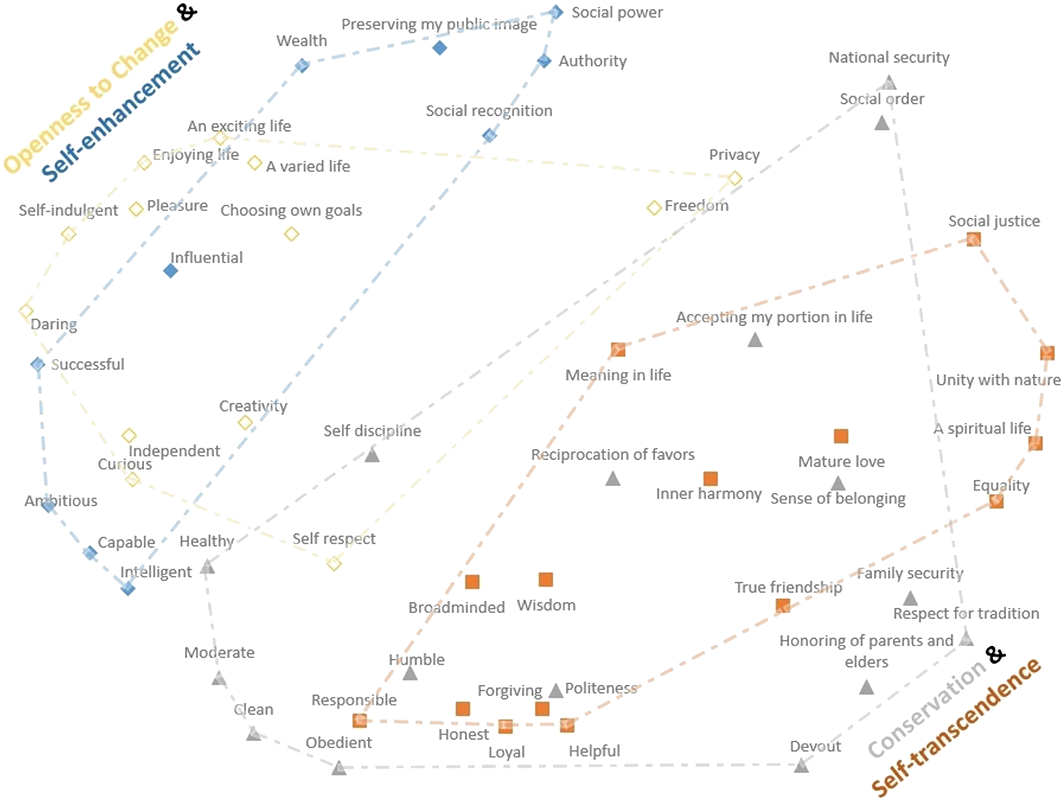
Structure based on similarity judgments between value items (Study 1). Self–enhancement (filled diamonds), self–transcendence (squares), openness to change (hollow diamonds), and conservation (triangles). [Colour figure can be viewed at wileyonlinelibrary.com]
The conceptual spatial arrangement of human values from the similarity judgment task (Figure 3) resembled the one found in Schwartz's (1992) analysis of value importance ratings. The values that were predicted to be on opposing sides of the value circle were in opposition in all cases, and most of the values serving related motives appeared near each other in the plots. Overall, then, the application of MDS to the similarity ratings revealed a conceptual representation matching the motivational patterns elucidated in Schwartz's model.
Nonetheless, a few exceptions were noted. First, if we compare the distribution displayed in Figure 1 to the one from Schwartz (1992) studies, it can be noticed that some values changed position with other values that belong to the same higher order value type, resulting in minor deviations: Pleasure (a hedonism value) switched places with independent and self–respect (self–direction values). In addition, there was an alteration in adjacent motivational value types: The security values changed position with tradition\conformity. Again, this change occurred in the same higher order values. Thus, the conceptual map does not differ substantially from the motivational patterns in Schwartz's model at the level of higher order values. This conclusion is further assessed in Studies 6 and 7 using different methods. In the next study, we aim to check these patterns at the level of lower order value types.
Study 2
The aim of Study 2 was to evaluate conceptual representations of values using similarity judgments between each of the 10 value types in Schwartz's (1992) model (e.g., stimulation, benevolence). That is, participants were asked to compare the value types, rather than individual value items, resulting in a total of 45 comparisons between the 10 value types. This was a smaller set of comparisons than in Study 1, but it enabled examination of the conceptual representation of values at the level of value type, instead of focusing only on a small number of specific values in each type. This study also evaluated culturally distinct samples, one in the UK and the other in Brazil.
Method
Participants
British participants included individuals from a community research panel who took part in exchange for a prize draw and undergraduate psychology students who took part for course credit. They responded to an Instructional Manipulation Check (IMC; Oppenheimer, Meyvis, & Davidenko, 2009), which a task created to see if the participants spend time reading instructions, and two ‘test items’ (e.g. ‘please, rate everything “extremely” ’) within the study. In total, 11 participants failed (four students and seven from general population) the IMC twice and were excluded 1 from the analysis, leaving 111 participants in the sample (n = 84 women; n = 27 men), with a mean age of 23.54 (SD = 8.99). Brazilian participants were recruited from the general population, with nine of them failing the IMC twice and/or both test items, resulting in a final sample of 69 (n = 34 women; n = 34 men; 1 missing; Mage = 32.15, SD = 13.39).
Materials and procedure
In this task, participants were instructed to rate the similarities between the 10 value types (e.g. benevolence and achievement) taken from Schwartz's (1992). Specifically, they rated how similar they personally thought two value types were, using a slider scale, ranging from 0 (not at all) to 100 (extremely). One pair was presented at a time and in a random order. Participants rated similarity by clicking on the slider and move it towards the rating that best indicated their opinion regarding the similarity of the items. All the value types were followed by a short definition [e.g. Universalism (Understanding, appreciation, tolerance, and protection for the welfare of all people and for nature)], in order to make all value types clear to participants.
Results and Discussion
As in Study 1, two half–matrix data sets containing the means of all comparisons were created. Again, ordinal MDSs were performed on each half–matrix, using the PROXSCAL algorithm with Torgerson configuration. With 10 values, a Stress lower than 0.13 is recommended (Sturrock & Rocha, 2000). Results indicated a good fit in both samples (UK, Stress–I = 0.04, rm = 0.89, p ≤ 0.001; BR, Stress–I = 0.05, rm = 0.92, p ≤ 0.001). The values types that contributed most to the model stress were conformity and security in the UK and security and hedonism in Brazil.
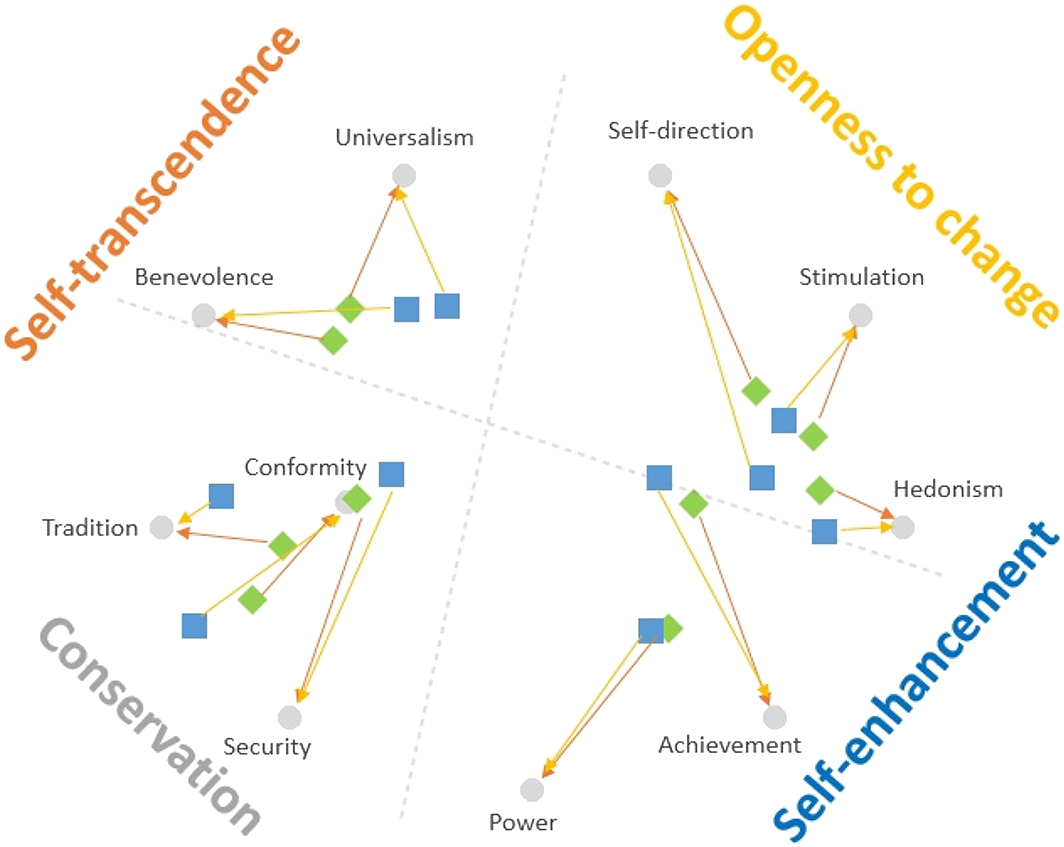
Value types along two dimensions (Study 2). Green diamonds represent our UK sample; blue squares represent our Brazilian sample; grey circles represent value type positions expected from Schwartz's model. [Colour figure can be viewed at wileyonlinelibrary.com]
As can be seen in Figure 4, some small deviations were noted. For instance, security positioned adjacent to power, instead of proximal to self–transcendence value types. These deviations do not affect the overall structure, with the value types from the same higher order value positioned broadly in the same space (e.g. self–transcendence values: universalism and benevolence). Also, the opposing higher order values were again in opposite positions (self–enhancement\self–transcendence and conservation\openness to change), supporting Schwartz's model. Thus, the two–dimensional arrangement retained the separation and ordering of the higher order value types (Bilsky et al., 2011). In the next study, we mixed the levels of abstraction in values considered in Studies 1 and 2, performing direct similarity judgments tasks between value items and value types.
Study 3
The prior studies used a limited number of value comparisons (up to 120) per participant to prevent participant fatigue. Study 3 examined similarity judgments between all 57 values and the 10 value types. This required 570 comparisons, which is far in excess of the number of comparisons made in the prior studies. Thus, to attenuate participant fatigue, these comparisons were divided into two blocks, with each participant responding to half of the randomly selected items, resulting in a total of 285 comparisons. The answers were further aggregated across participants, forming a single matrix based on the means between each pair of items.
Method
Participants
Participants were 181 psychology students, who took part in exchange for course credits. Participants answered the IMC (Oppenheimer et al., 2009) and five ‘test items’ (e.g. ‘please, rate everything extremely’), which were added in a random location among the other items. Participants who failed the IMC twice and/or two or more test items were excluded from the analyses. In total, 25 participants were excluded from the analyses. The remaining sample contained 156 participants (n = 144 women; n = 12 men), and the sample's mean age was 19.59 years (SD = 2.38).
Materials and procedure
Participants were asked to rate the similarity between each of the 57 human values (e.g. equality and freedom) and the 10 value types (e.g. stimulation and conformity) from Schwartz's (1992) theory. In this study, participants were presented with all 57 values, one by one, and compared each one to five randomly selected value types. Participants rated the similarity of each pair using a slider scale, ranging from 0 (not at all) to 100 (extremely). They moved a slider towards the score to which best represents the extent that they personally think each pair is similar.
Results and Discussion
First, the means of all comparisons were calculated, creating a full matrix (value items × value types). Next, an ordinal MDS (PROXSCAL) was performed, using the Torgerson configuration. The resulting Stress–I of 0.10 indicated a good model fit (recommended lower than 0.37, for 57 objects; Sturrock & Rocha, 2000). Privacy and sense of belonging contributed most to the stress. Protest indicated a good fit to Schwartz model: rm = 0.80, p ≤ 0.001. Figure 5 shows the spatial arrangement of the human values according to their similarities to the value types. Overall, there were high similarities between the value items and their expected or adjacent value types. As in the prior studies, the circular arrangement still retained the correct separation and ordering of the higher order value types (Bilsky et al., 2011).
Value positions according to their similarities to the value types (Study 3). [Colour figure can be viewed at wileyonlinelibrary.com]
Only three of the 57 values were positioned in unexpected places: healthy, privacy, and responsible. In previous research, these values also emerged in inconsistent positions (e.g. Schwartz et al., 2012; Schwartz & Sagiv, 1995). For example, healthy can be often found next to hedonism, achievement, self–direction, and, as in this case, benevolence (Schwartz, 1992).
Study 4
The results to this point yielded support for a model of values’ semantic meaning that closely matches Schwartz's model. To further probe the reliability of this mapping, Study 4 asked participants to rate the similarities between Schwartz's (1992) 57 values and the four higher order values. As in Study 3, we attempted to attenuate participant fatigue by presenting them with a randomly chosen subsample composed of 30 of the 57 human values.
Method
Participants
Participants were 126 individuals who were recruited online through Prolific Academic. However, 19 of these participants failed the IMC (Oppenheimer et al., 2009) twice and/or three test items, which were added in random parts of the main task. The remaining sample contained 107 participants (n = 57 women; n = 50 men), with a mean age of 37.11 years (SD = 12.56).
Materials and procedure
Participants were instructed to rate the similarities between Schwartz's human values (e.g. authority and loyal) and the four higher order values (e.g. self–enhancement and conservation). Participants were presented with one main value on the top of the screen and then asked to rate the extent to which this value is similar to each of the four higher order values, using a slider scale from 0 (not at all) to 100 (extremely). Participants clicked and moved the slider towards the response option that best indicated their personal answer regarding the similarity of each pair.
Results and Discussion
The matrix was created using the means from all value comparisons (value items × higher order values). Once again, an ordinal MDS (PROXSCAL; Torgerson configuration) indicated good model fit (Stress–I = 0.05; recommended lower than 0.37; Sturrock & Rocha, 2000). Accepting my portion in life and sense of belonging contributed most to the total stress. The final spatial arrangement can be seen in Figure 6. Protest analysis indicated a good fit to Schwartz's model, rm = 0.68, p ≤ 0.001.
Notwithstanding this replication, the distribution indicates that openness and self–enhancement values exhibited better fit to their respective higher order values, being more clustered together, whereas self–transcendence and conservation values were more widely separated in the spatial plane. One possible explanation for these findings was provided in the Schwartz et al. (2012) refined theory, in which the authors divided the 10 value types of the original model into 19 value types. Both self–transcendence and conservation were divided into more subcategories than the other two higher order values, indicating higher diversity. Therefore, their spread of positions in our results might indicate more diverse concepts in these higher order values.
Value positions according to their similarities to the value types (Study 4). [Colour figure can be viewed at wileyonlinelibrary.com]
Study 5
Study 5 asked participants to use the dimensions from Schwartz's theory to plot the values. Unlike the prior studies, this method did not ask participants to rate similarities between items but rather to pin their location onto the self–enhancement versus self–transcendence and the openness versus conservation dimensions. If a value is placed closer to one end in either or both dimensions, this end would be considered more characteristic or similar to the value. This method enabled us to examine the conceptual map when participants think about the dimensions themselves. The method was useful because the dimensions are important core features of the model, as it relies on a two–dimensional space that implicitly contrast motives. In addition, the method is more direct insofar as it plots participants’ responses without any further transformation, unlike MDS. Study 5 also probed whether the findings can be replicated in Brazil.
Method
Participants
In the UK, participants were 180 psychology students, who took part for course credit. Thirteen participants were excluded from the analyses: participants who failed the IMC (Oppenheimer et al., 2009) twice and/or two or more of four test items (e.g. ‘please, select the first option in the scale’) that were added in random parts of the study. The remaining sample contained 167 participants (n = 150 women; n = 17 men), and the mean age was 19.82 (SD = 3.12). In Brazil, participants were 94 individuals from the general population. Those who failed the IMC twice and/or the test items were excluded from the analysis. The remaining sample included 86 Brazilians (n = 40 women; n = 46 men), and the mean age was 27.21 (SD = 9.08).
Materials and procedure
Participants read a brief summary of Schwartz's (1992) theory to ensure that they understood the dimensions described in the model. Next, they were instructed to position the human values (e.g. an exciting life) on each dimension of Schwartz's model (e.g. self–enhancement versus self–transcendence), based on their personal understanding of these dimensions. Participants used a 9–point bipolar scale, with the opposing higher order value domains identified at each end. Values placed closer to one end of the dimension should be more representative of that end, while values placed in the middle should share information from both ends. The values were presented one at a time.
Results and Discussion
In this study, the spatial arrangement was specified directly from the means of the values for both dimensions, with self–enhancement versus self–transcendence as the X axis and openness to change versus conservation as the Y axis. This method allowed us to check the coordinates directly in the respective quadrants without needing an optimization function. Self–enhancement values should be located in one half of the X axis, while self–transcendence values should be located in the other half. Similarly, openness to change values should be located in one half of the Y axis, while conservation values should be located in the other half. Due to the nature of this task, we expected the values to be positioned in their half of their respective axes, but not necessarily in specific quadrants—which visually would not represent the quasi–circumplex structure. For example, some self–enhancement values may be more related to values of openness to change than to conservation, causing these self–enhancement values to fall outside of their putative quadrant.
United Kingdom
We present the findings for the UK and Brazil separately because they were somewhat different. In the UK, the fit was acceptable, rm = 0.73, p ≤ 0.001. However, as noted in Study 1, the rm does not replace a qualitative assessment of the common space plot, as is commonly used in the literature (e.g. Bilsky et al., 2011; Schwartz, 1992). Figure 7 shows all 57 human values from Schwartz's (1992) theory positioned along the two dimensions in the model. Eight (ST: inner harmony, meaning in life, mature love, a spiritual life, wisdom, true friendship; CO: sense of belonging; OP: privacy) of the 57 values were positioned in the opposite half of the higher order value dimension. Of importance, in Schwartz and Sagiv's (1995) research assessing value structure cross–culturally, six of these eight values were highlighted as presenting an inconsistent position across the spatial maps. Therefore, some of the deviations were replicated in our study.
Of interest, six of the eight shifts in location occurred for self–transcendence values. One shift arose for a conservation value, and one for an openness to change value. Although some of these eight exceptions were near the middle of the scale (sense of belonging, true friendship, a spiritual life, privacy), indicating only small deviations, many of the self–transcendence values were much further from their predicted side of the dimension. This finding may indicate more conceptual variability in self–transcendence values.
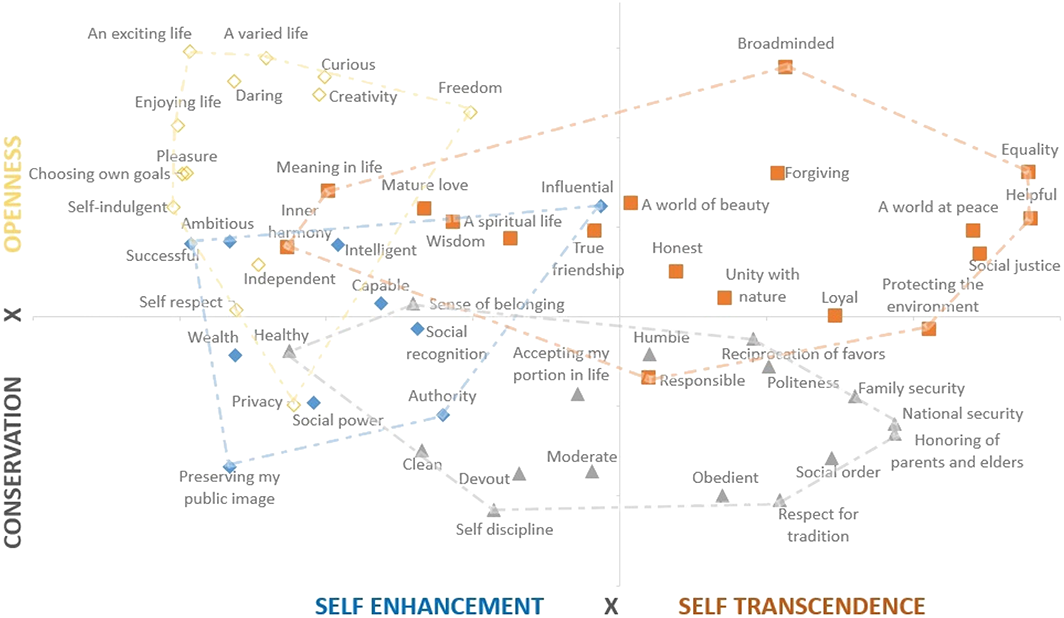
Values placed along Schwartz's value dimensions (UK; Study 5). [Colour figure can be viewed at wileyonlinelibrary.com]
Brazil
Once again, the fit was acceptable, rm = 0.72, p ≤ 0.001. As Figure 8 reveals, nine (ST: inner harmony, meaning in life; CO: healthy, sense of belonging, humble, reciprocation of favors, politeness; OP: privacy, self–respect) of the 57 values were positioned in the opposite of the predicted side of the higher order value dimension. Five of these values were also considered inconsistent in Schwartz and Sagiv's (1995) cross–cultural research. Four of the nine mispositioned values were also misplaced in the British sample (sense of belonging, inner harmony, meaning in life, and privacy).
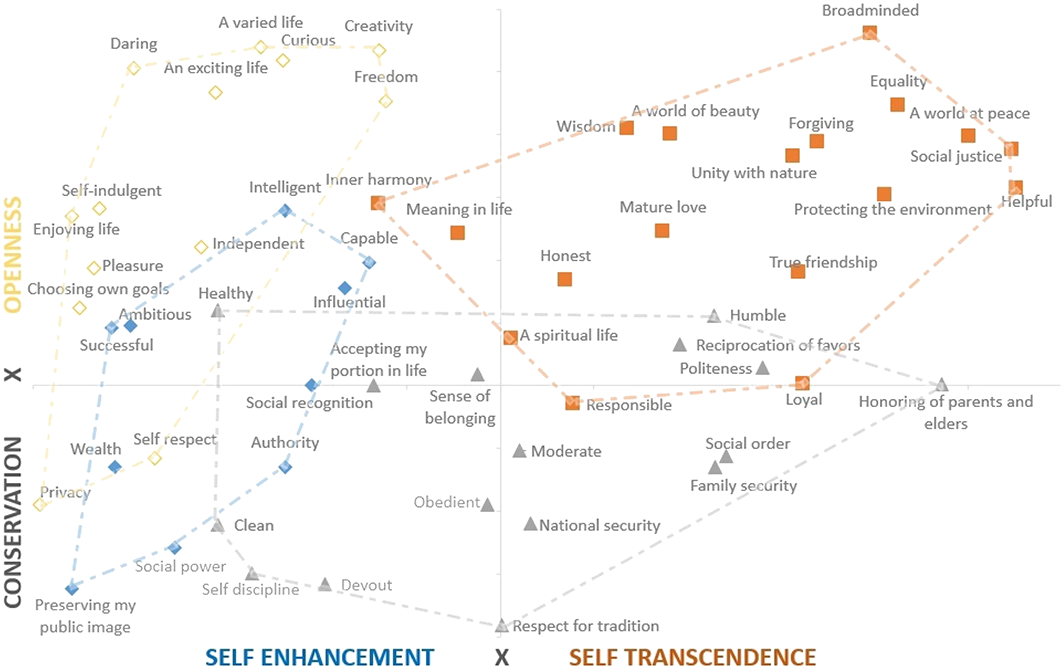
Values placed along Schwartz's value dimensions (BR; Study 5). [Colour figure can be viewed at wileyonlinelibrary.com]
Overall, the findings revealed clusters of the four higher order values, but with some of their items spread to unexpected positions in the UK and Brazil. As a result, the oppositions between the higher order values were not clearly supported, perhaps because participants positioned the values along both dimensions simultaneously and had therefore potentially made a trade–off when they saw a value fitting equally well to both opposing higher order value types. For example, the value pleasure (openness to change value) might be considered by some participants to be more closely related to self–enhancement, while for others, it was more closely related to self–transcendence (e.g. as some might conceptualise pleasure as something personal, whereas as others might see it as something social). Thus, the location depends of their individual knowledge and interpretation of the values and the value dimensions, which might differ when making the associations.
Study 6
In Study 6, we investigated the structure of all 57 values (Schwartz, 1992) with Pile Sorting, a method that has not been used before in value research. Pile Sorting (also known as card sorting) is a powerful technique to assess relations between items (Yeh et al., 2014). In our study, participants sorted the values into a number of piles\groups chosen by each participant individually, based on how similar they judged the values to be. Through the piles\groups, a distance\proximity matrix can be created, allowing us to perform an MDS to assess the structure of conceptual relations between values.
Method
Participants
Participants were 129 individuals (Mage = 37.85; SD = 12.80), who were recruited online from Great Britain through Prolific Academic (n = 64 women; n = 56 men; 9 missing). All participants passed the IMC (Oppenheimer et al., 2009).
Materials and procedure
Participants were presented a list of all 57 values (e.g. responsible and moderate) from Schwartz's (1992) value model and were asked to arrange these values into categories, based on how similar they personally think the values are. Participants used a drag–and–drop method, freely creating as many groups\piles as they saw fit to place the values, in a way that made most sense to them. Participants were asked to place the values that they judged to be more similar in the same group\pile, and they could also move values between groups, if necessary. This task was completed through the website https://www.usabilitest.com/.
Results and Discussion
In the first step of the analysis, a matrix was created based on how many times the values were grouped\piled together by the participants. This matrix was composed of 57 rows and columns, representing each combination of values. For instance, if the values freedom and obedient were placed into different groups\piles by one participant, one point would be added to the total score of this combination into the matrix. If they were placed together, no point would be added. In sum, lower scores indicate higher similarities (or a higher number of times placed together). Based on this similarity matrix, an interval MDS (PROXSCAL; Torgerson configuration) was performed. Results indicated a moderately good model fit (Stress–I = 0.27; recommended lower than 0.37; Sturrock & Rocha, 2000). Accepting my portion in life and reciprocation of favors contributed most to the total stress. Protest revealed a relatively poor fit rm = 0.49, p ≤ 0.001, because openness and self–enhancement values and conservation and self–transcendence values were mixed. The final spatial arrangement of values can be seen in Figure 9.
Value positions according to value similarities (Study 6). [Colour figure can be viewed at wileyonlinelibrary.com]
This study was the first to assess the structure of all 57 values simultaneously using a method that has not been used previously in values research. Instead of using direct similarity judgments between all 57 values, we asked participants to group\pile the values based on their perception of how similar the values are. The MDS distribution indicates an interesting structure. Instead of the two dimensions spread across the four quadrants, values were grouped into a single wide dimension. Self–transcendence and conservation values were positioned together into one end, with self–enhancement and openness to change values in the other. Although the findings support Schwartz's model less than the previous studies, the grouping of values is still meaningful: Self–transcendence and conservation have a social focus, relating to how individuals socially relate to and affect others; self–enhancement and openness to change have a more personal focus, regulating how the individuals express their personal interests and characteristics (e.g. Schwartz et al., 2012).
One possible explanation for this clustering in two groups is the Luster–Splitter Problem (Weller & Romney, 1988). This is a problem (or finding, to phrase it more neutral) commonly seen in a free pile sorting method, where participants are asked to create as many piles as they want, as long as the groups have more than one item. Some participants create just a few groups\piles, while others create many. This may lead to lower complexity in the final model, resulting in few conceptual distinctions than seen with other methods.
Study 7
In Study 7, we investigated the structure of all 57 values (Schwartz, 1992) with the spatial arrangement method (SpAM), another method that has not been used before in value research. Participants were asked to arrange the values in a spatial plane using a technique developed by Goldstone (1994) to measure similarity between items. This efficient technique was also used in previous social psychological research, where it provided innovative results suggesting as a substantial modification of the stereotype content model (Koch, Imhoff, et al., 2016). The method has been used in several other studies (Koch, Alves, Kniger, & Unkelbach, 2016; Koch, Kervyn, Kervyn, & Imhoff, in press; Lammers, Koch, Conway, & Brandt, in press). In addition, Study 7 included value importance ratings. These ratings enabled me to test the motivational structure of values in the same sample as used to test the conceptual structure of values. In this manner, we could do a within–study comparison of the findings to ensure that any differences between the models are not due to between–study differences in samples.
Method
Participants
Participants were 154 individuals recruited online through Prolific Academic. Two of them were excluded because they failed the IMC (Oppenheimer et al., 2009) and/or test items, resulting in a total of 152 participants (Mage = 37.93; SD = 11.15; n = 105 women; n = 47 men), mostly from Great Britain (n = 146).
Materials and procedure
Participants were instructed to arrange the 57 values (e.g. honest and influential) of Schwartz's (1992) model based on their similarities in a two–dimensional space. The values were positioned together in the centre of an otherwise black screen. The participants’ task was to spatially arrange the values using drag and drop. Specifically, the task was to draw a value map where a greater proximity would indicate a greater similarity and greater distance would show greater dissimilarity, in a way that makes most sense to the participants. Thus, participants drew their own value model in a two–dimensional space. All values had to be moved at least once to finish the task. A screenshot of the starting screen can be found online (https://goo.gl/Vutc5K).
Participants also completed the SVS (Schwartz, 1992), containing all 57 value items from Schwartz's theory. Participants rated the importance of each value using a 9–point scale (−1 = opposed to my values; 0 = not important; 3 = important; 6 = very important; 7 = of supreme importance).
Results and Discussion
Spatial arrangement
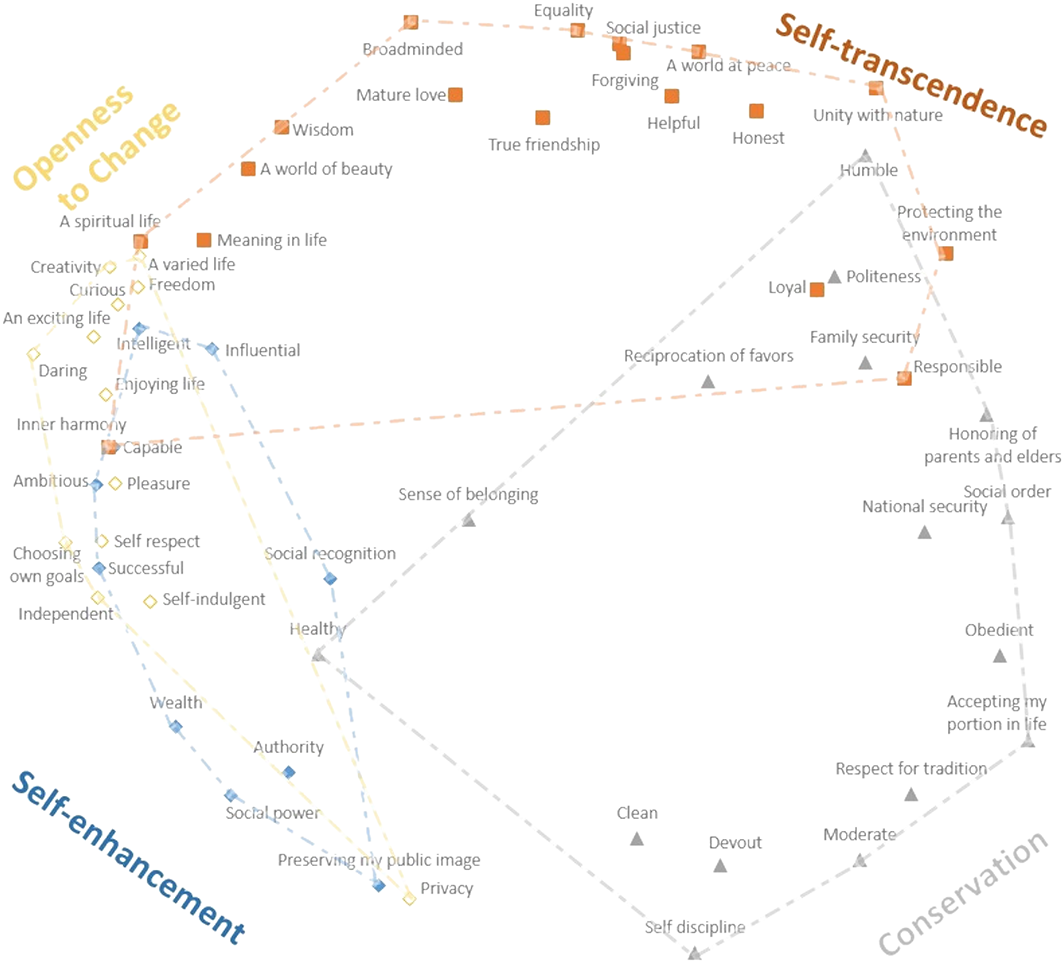
To analyse the data, we followed the Koch, Imhoff, et al. (2016) script for SpAM. Several steps were necessary before proceeding to the MDS. First, the Euclidian distance between the values was calculated—that is, the distance between all the pairs of stimuli was considered. As participants have different screen resolutions, we also divided pairwise sorting distance by the greatest possible distance (the diagonal of the screen). Thus, this division relates actual distance to available distance to account for screen size varying between participants. Then, we averaged sorting distance separately for each stimulus pair across all participants who sorted that pair, resulting in an N*N (i.e. stimuli) matrix that we then subjected to MDS. The results indicated a good model fit (Stress–I = 0.20; recommended lower than 0.37; Sturrock & Rocha, 2000) and an acceptable Protest value, rm = 0.71, p ≤ 0.001. The final structure can be seen in Figure 0010.
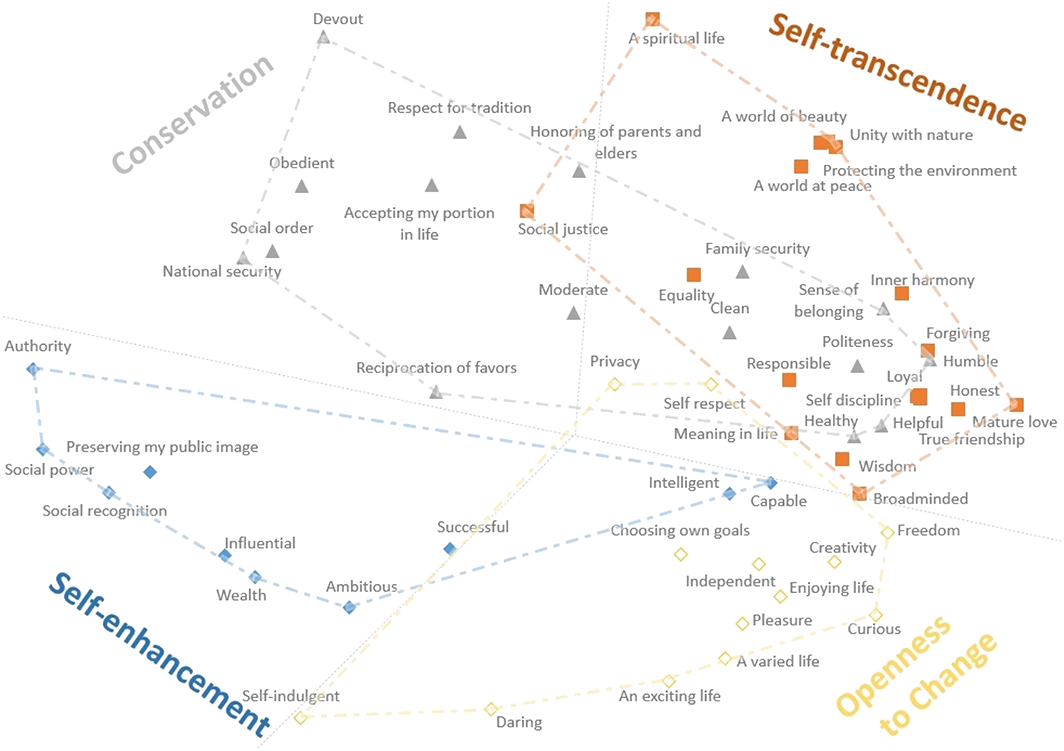
Value positions according to value similarities (Study 7). [Colour figure can be viewed at wileyonlinelibrary.com]
The spatial structure (Figure 0011) resembled the quasi–circumplex structure from Schwartz's (1992) model: The opposing positions of the two dimensions emerged clearly across the four quadrants. However, openness to change values were more clustered, while conservation values were more spread across the spatial map, merging partly with self–transcendence values. This mix might have occurred due to the social focus in these values, as happened in Study 6.
Finally, we assessed the structure for each participant individually. For 90 out of the 152 participants (59.21%), the Protest was significant; that is, the majority of participants created Schwartz's structure at least partly. Examples for a very good, a medium (i.e. just about significant), and a very poor fit can be found in Data S1. Following Gollan and Witte (2014), who found that ‘persons whose value profiles show a poor fit to the model are (a) younger than the majority and (b) endorse values that are usually considered less important’ (p. 1), we also tested for moderators. Specifically, we correlated the model fit index rm with the 10 value types as measured by the SVS, age, gender, and level of education. Of these correlates, only education significantly predicted model fit, r(150) = 0.28, p < 0.001. Higher educated participants were more likely to arrange the values in a manner that followed Schwartz's structure. This interesting finding may reflect effects of education on conceptual sophistication with values, or it may reflect effects of greater verbal ability on comprehension. The latter speculation is in line with the reasons for Schwartz's development of the Portrait Values Questionnaire (PVQ) (Schwartz et al., 2001), an alternative and more comprehensible measure of values as compared with the SVS (Schwartz, 1992). Use of the PVQ has replicated the proposed structure better in less developed (and hence less educated in a Western sense) countries (Schwartz et al., 2001). Thus, it is possible that this effect of education would be removed if the spatial arrangement task were applied to PVQ items instead of SVS items.
Schwartz Value Survey
The spatial arrangement was also assessed using value importance ratings as typically used in prior research. We followed the syntax provided by Bilsky et al. (2011), in which the MDS (PROXSCAL) is performed using a matrix of correlations between the value items, together with a restrictions file. Results indicated a good model fit (Stress–I = 0.22; recommended lower than 0.37; Sturrock & Rocha, 2000). Its distribution can be seen in Figure 0011. Finally, we assessed the fit between the similarity judgments and importance ratings distributions, with results showing good correspondence (rm = 0.74, p ≤ 0.001). This Procrustes plot can be seen in Data S1. These findings provide the first direct empirical evidence for correspondence between individuals’ conceptual mapping of values and their motivational structuring of their interrelations.
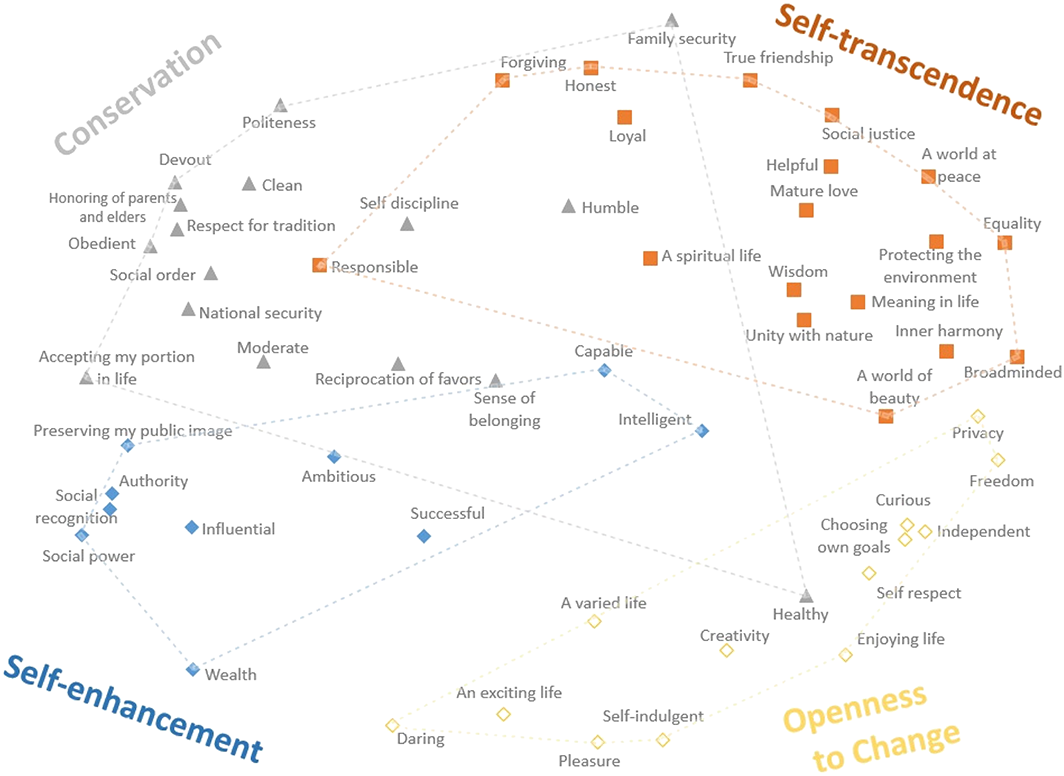
Value positions according to participants’ value importance ratings (Study 7). [Colour figure can be viewed at wileyonlinelibrary.com]
General Discussion
This research provided the first direct examination of the conceptual representation of values using similarity judgments using a diverse range of methods. We asked participants to judge the similarity between value items, value types, and value dimensions through direct comparisons (Studies 1–4), to position the values among the two dimensions using a bipolar scale (Study 5), and to provide similarity judgments of all 57 values through two different methods—pile sorting (Study 6) and spatial arrangement (Study 7). Additionally, in Study 7, we found that 59% of the participants replicated Schwartz's structure when asked to arrange the values based on their similarities, similar to previous research that used importance ratings (Borg et al., 2017; Gollan & Witte, 2014).
It was an empirical question whether these new tasks would generate the same circular structure as previously yielded by correlations between value importance given the difference in theoretical basis between the two. Our tasks asked for judgments of concepts, which should be less influenced by social desirability than personal value importance ratings. Despite these differences, the results of our concept–focused tasks generally resembled the results of the motivation–focused tasks (e.g. Bilsky et al., 2011; Schwartz, 1992). When assessing how our value spaces match a hypothetical configuration of Schwartz's model using Procrustes rotation, results showed significant congruence across all studies. Also, across two cultures (the UK and Brazil), we obtained a two–dimensional spatial arrangement that resembled the Schwartz's model and that accentuate the assumptions of synergies and conflict between the values. These consistent findings indicate that conceptual representations of the values within Schwartz's (1992) model align with the past evidence of their motivational interconnections, suggesting deep underlying connections between the two.
It is important to highlight that our research utilized a range of methods to directly map the meaning of values. When making similarity judgments, people are required to think beyond the motivational importance of each value and to explicitly compare their understanding of the meaning of the values. We asked participants to make explicit comparisons at different levels (values, value types, and value dimensions), to group values according to their understanding, or to freely position the values across a spatial plane. Thus, we were able to introduce different judgmental reference points, which is important for diverse social constructs. For instance, many decades ago, Asch (1946) observed how social traits like ‘cold’ could take on new meaning depending on the traits presented alongside them. Also, when presenting different and new stimuli to individuals, concepts are triggered in memory, allowing people to draw conclusions about similarity between the items (Medin & Schaffer, 1978; Minda & Smith, 2001; Murphy, 2004). This concept mapping exercise explicitly builds these shifting perspectives into the derivation of the conceptual model.
Cross–cultural comparisons: Importance ratings × similarities
Although we replicated Schwartz's structure across a range of methods, there are some differences between our findings and previous research that investigated value structure in the UK and in Brazil. In the UK, using importance ratings, the quasi–circumplex structure was consistently replicated across three samples, without deviations (Bilski et al., 2011). For Brazil, previous research showed only minor deviations (value types merging or swapping positions; Sambiase et al., 2010; Tamayo & Porto, 2009; Tamayo & Schwartz, 1993). The structure was similar in most of our studies, with the two opposing bipolar dimensions clearly arising. However, some structural differences were found. For instance, in our Study 2, the self–transcendence value types emerged closer to each other than the value types of the other higher order values. This is in line with previous findings based on importance ratings, which also found that universalism and benevolence tended to occupy the same region (e.g. Sambiase et al., 2010; Tamayo & Porto, 2009). Also, in Study 4, self–enhancement and openness values were more tightly clustered than the other two higher order values. This finding might indicate that self–enhancement and openness values are composed by less diverse concepts. Indeed, Study 6 found that self–enhancement and openness values were mixed together, opposing the self–transcendence and conservation values, which were also intermixed. In this case, the structure indicated an organization based on the personal and social focus of the values. Together, these comparisons show that the conceptual clustering of values can differ from their motivational clustering, despite broad alignments between the conceptual and motivational structure of values.
Deviations
Notwithstanding the support for the quasi–circumplex structure across the seven studies, we also observed small deviations that warrant consideration. For example, some values swapped positions with adjacent values (Studies 1, 2, and 3), some values clustered more than others (Study 4), some were grouped based on their focus (personal and social; Study 6), and some values were categorized differently in different nations (Study 5). These swapping and fluctuations in values positions have also been shown in previous research that assessed the quasi–circumplex structure (e.g. Bilsky et al., 2011; Fontaine et al., 2008; Schwartz et al., 2012; Schwartz & Sagiv, 1995). For example, in the UK sample of Study 5, six of the eight values positioned in the unexpected end of the dimension are known for their inconsistency across cultures (Schwartz & Sagiv, 1995). Nonetheless, it is worth emphasizing that our designs are better suited to drawing conclusions about the broad patterns of relations between values than about specific deviations, because we would need larger samples to provide powerful conclusions about the reliability of specific deviations. In this respect, the consistency of support for the circular model across all seven studies is more noteworthy.
It may nevertheless be useful to consider whether there are patterns in deviations that reflect inherent properties of the values. Consider the findings in Study 5. In the British sample, six self–transcendence values were positioned closer to the opposite end of the dimension. Specifically, inner harmony, meaning in life, mature love, wisdom, true friendship, and a spiritual life appeared in the self–enhancement side, even though the last value was next to the centre of the scale. In the Brazilian sample, there were similar deviations for two self–transcendence values, and five conservation values (healthy, humble, reciprocation of favors, politeness, and sense of belonging) were found in the wrong end of the conservation–to–openness dimension. These exceptions might have been more evident in Study 5 because of the way the task was structured. Whereas Studies 1 to 4 asked participants to rate similarities between the items, Study 5 asked participants to place the values inside the two–dimensional space proposed by Schwartz. By asking participants to make a choice inside the two dimensions, they might have been more likely to notice instances where the values can serve varied motives. In this respect, it is interesting that the six self–transcendence values may be relatively broad, inward facing, and focused on balance (e.g. inner harmony, true friendship, meaning in life, mature love, wisdom, and a spiritual life) compared with other self–transcendence values, such as equality, honesty, forgiving, and loyalty. The relative focus on inward insight and balance may help to explain their flexibility in motivational construals. For example, wisdom can be useful for one's own career. Similarly, the conservation values that deviated in the Brazilian sample may be relatively broad, indicating personal characteristics that are considered important to individuals, especially when compared with more concrete values from this higher order value (e.g. family security, national security, social order, and respect for tradition). Despite being exceptions and not the rule, these values reveal interesting ways in which particular values may readily encompass behaviours that simultaneously map onto opposing values.
Limitations and future directions
Although some of our samples were skewed towards women, research has shown across cultures that both men and women perceive the values in the same way, reproducing the quasi–circumplex model and its ideas of congruence and conflict of values (Struch, Schwartz, & Kloot, 2002). Furthermore, three of our studies (4, 6, and 7) recruited from more general populations with more gender balance in the samples, and they revealed no noteworthy differences from our other results.
Overall, the multiple structure assessment methods used across our studies indicate that the conceptual interrelations between values and the motivational interrelations currently embodied in Schwartz's model are closely aligned. We recognize the importance of motivational relations between values and their role in understanding relations between values and other psychological variables (e.g. political attitudes and personality traits; Caprara, Schwartz, Capanna, Vecchione, & Barbaranelli, 2006; Parks–Leduc, Feldman, & Bardi, 2015). For instance, why would universalism and benevolence both positively predict altruism when they are only conceptually similar (Hanel, Litzellachner, & Maio, 2018)? We expect that they both predict altruism because of similar underlying motivation. Also, as can be seen in Study 7, results indicate a correlation (using Procrustes rotation) between the distributions provided through similarity judgments and importance ratings. Thus, our findings do not undermine the importance of the motivational interrelations. Instead, they show for the first time that the conceptual and motivational aspects of value interrelations are both distinct and convergent.
The variability in conceptual locations of values across methods and cultures provides clues about their potential for variation in application to attitudes and behaviours. Knowing how similar values are to each other might help to delineate future studies that focus on understanding their predictive power. This has been a difficult task so far, because any particular attitude or behaviour can express different values at time (Bardi & Schwartz, 2003; Schwartz, 1996). For instance, one might think of influential, a self–enhancement value, as relevant to some self–transcendence values (e.g. protecting the environment and equality), because the values may be interconnected in real–world contexts (e.g. using one's influence to promote recycling and making public speeches to end the gender pay gap). Therefore, the investigation of these mental representations can help us not only to better understand the value relations based on their content, but also their association to attitude and behaviour in the real world.
Also, assessing values through their conceptual representations can aid theory development. Because people understand and interpret values in different ways, based on their personal categorizations, our research might also help to identify values that are less or more variable in representation across methods or countries. In fact, the methodology can be applied not only using Schwartz's value model but also other (circumplex) models, such as the circumplex model of goal content (Grouzet et al., 2005), the interpersonal circumplex (Wiggins & Pincus, 1989), or the circumplex model of affect (Posner, Russell, & Peterson, 2005). It might also lead to the identification of a new dimension, as previously done by Koch, Alves, et al. (2016), who modified the stereotype content model also using SpAM.
Conclusion
The motivational aspects of human values are central to understanding their implications, but conceptual representations of values are equally fundamental. The present research addresses a longstanding deficit in our knowledge of the conceptual representation of values. By examining how these values are organized as concepts, we learned about how people categorize and interpret values. This novel analysis found that the conceptual links between values are broadly consistent with the motivational relations predicted by Schwartz's model, alongside small differences that warrant further investigation.
Acknowledgements
The authors acknowledge financial support from the Coordination for the Improvement of Higher Education Personnel (CAPES Foundation, Brazil; Proc. 99999.013718/2013–04; http://www.capes.gov.br/) and from the School of Psychology (psych.cf.ac.uk), Cardiff University, to the first author, and the Economic and Social Research Council (ESRC; www.esrc.ac.uk) to the second author (ES/J500197/1). The funders had no role in study design, data collection and analysis, decision to publish, or preparation of the manuscript. The authors also wish to thank Alex Koch for providing the syntax used to run Study 7 and the data analysis script.
Supporting info item
Supporting info item, per2170-sup-0001-SI - Mapping the Structure of Human Values through Conceptual Representations
Supporting info item, per2170-sup-0001-SI for Mapping the Structure of Human Values through Conceptual Representations by Coelho Gabriel Lins de Holanda, Hanel Paul H.P., Johansen Mark K., Maio Gregory R. and Back Mitja in European Journal of Personality
Data S1: Supporting information
Supporting info item
Supporting info item, per2170-sup-0002-SI - Mapping the Structure of Human Values through Conceptual Representations
Supporting info item, per2170-sup-0002-SI for Mapping the Structure of Human Values through Conceptual Representations by Coelho Gabriel Lins de Holanda, Hanel Paul H.P., Johansen Mark K., Maio Gregory R. and Back Mitja in European Journal of Personality
Open Practices Disclosure
Footnotes
Notes
References
Supplementary Material
Please find the following supplemental material available below.
For Open Access articles published under a Creative Commons License, all supplemental material carries the same license as the article it is associated with.
For non-Open Access articles published, all supplemental material carries a non-exclusive license, and permission requests for re-use of supplemental material or any part of supplemental material shall be sent directly to the copyright owner as specified in the copyright notice associated with the article.