
Abstract
This paper presents a new automated change detection method for detecting breaches in the integrity of and attached objects in front of fence wires in multiple outdoor images of the same scene containing fence wires acquired by a mobile camera from slightly different viewing positions, angles and at different times. To detect significant changes, edges of fence wires firstly have to be extracted from multiple outdoor images using a combination of the Sobel detector and an adaptive thresholding technique. Secondly, morphological operations such as dilation and erosion are applied into binary images produced by the previous process in enhancing the binary images. Next, an area-based algorithm is applied to enhanced binary images in separating small and big objects based on their average areas determined once in the calibration process. Finally, objects that survive are then fed into a fuzzy inference system in calculating their possibility values. Based on these possibility values, the survived objects can be classified as significant or unimportant changes. Experimental results demonstrate that the method has a high success rate (94.12%) in detecting true positives in these kinds of multiple outdoor images.
Introduction
Large protected areas referred to as outdoor perimeter security, such as airfields and the perimeters of defence bases, are commonly marked by physical barriers known as wire fence systems. There are two kinds of wire fence systems: electric and non-electric wire fence systems. Electrified fence systems are often composed by numerous Close-Circuit Televisions (CCTVs) coupled to motion detection systems or infrared (IR) beams and taut wire systems (Senstar-Stellar and Magal Security Systems, 2007). Outdoor perimeter security is regularly patrolled by human guards whose duties are to inspect any breaches in the integrity of fence wires (e.g., holes), to ensure that there are no any intruders in perimeter security and to find any suspicious objects left by intruders. In addition to human patrols, it would be useful to have an automated system (e.g., a patrol robot equipped with various sensors and an automated sensor data processing system) whose niche would be to assist human guards. A patrol robot, guided by a Global Positioning System (GPS), could be tasked with patrolling large protected areas. How a patrol robot might traverse a large protected area is described in the brief scenario that follows: The robot commences its patrol from point A. At point A, it halts for a specified period (e.g., 2 seconds) to acquire an image of the area, referred to as a reference image. After capturing the reference image, the robot continues its patrol to the next image acquisition point (e.g., point B) and so on, until the entire patrol area has been traversed. The robot will theoretically have returned to point A but will not be exactly on point A because of navigation errors as a result of GPS, compass, and internal sensors errors of the patrol robot. This scenario illustrates that an automated image processing system will be required for such robotic application and it must be capable of dealing with multiple outdoor images of the same area containing fence wires acquired by a mobile-camera from slightly different viewing positions, angles and at varying times.
Electric wire fence systems are often deployed in protecting outdoor perimeter security. The systems can detect human motions, while ignoring nuisance events triggered by rain, wind, or animals. Perimeter sensors employed in the electrified fence systems can be divided into two broad categories; (1) line sensors and (2) volumetric or area-coverage sensors (Rich, B. G., 2007). Line sensors involve either physical contact with the sensor or an associated structure to trigger an alarm or beam-break sensors, where detection is closely defined by occluding a point-to-point narrow beam in a plane of detection. Line sensors consist of taut wire, vibration, acoustic, IR and contact barrier sensors. Volumetric sensors secure a defined area in which a target's motion, presence or absence may be detected. Area-coverage sensors include radio frequency, microwave, electrostatic field, video motion detection (VMD), seismic and ground radar sensors. Although electric fence systems can be employed to protect large areas, they are very expensive in costs including a visibility study prior to install them, installation, calibration and maintenance.
In non-electric fence systems, a scanning camera approach could be applied to trace fence wires (Haering et al., 2008). The approach consists of specified waypoints visited at specified times, speeds and zoom-levels. The approach uses Pan-Tilt-Zoom (PZT) cameras. Although successive frames may contain visible structures of wires, the approach may not unique enough to provide positional information of significant changes, such as breaches in the integrity of and/or attached objects in front of fence wires, because of motion estimates from PZT cameras and controlling software are not standardized.
A patrol robot guided by a GPS can be deployed in outdoor perimeter security. The patrol robot must be able to navigate autonomously and to detect automatically significant changes. However, such automated image analysis system, which can detect breaches in the integrity of fence wires and objects left behind by intruders in multiple outdoor images of the same scene containing fence wires taken by a mobile camera from slightly different viewing positions, angles and at different times, is still uninvestigated yet since detecting breaches in the integrity of fence wires and attached objects in front of fence wires while rejecting unimportant changes caused by camera motion, sensor noise, illumination variation and non-uniform attenuation (Radke, et al., 2005) in these kinds of multiple outdoor images is a complex task. Complexity further increases when the change detection is performed in an outdoor scene (i.e., background clutter and significant day-time variation in illumination) that contains fence wires. Outdoor fence wires are often composed from thin metal substance. Specular reflections apparently appear on fence wires during the sunny day and fence wires seem darker during the overcast day. Consequently, non-uniform illumination observably occurs along fence wires.
In this paper, we propose a new automated change detection method utilized in detecting regions of change in these kinds of multiple outdoor images. There are two main problems addressed in this study. The first problem is how to extract edges of fence wires without missing considerable edges of fence wires in such complex outdoor scene. An investigation of edge detectors that are quite robust towards illumination variation is conducted in this study. The second problem is how to detect breaches in the integrity of and attached objects in front of fence wires in binary images produced by the proposed edge detector. Any significant changes must be detected and located while any unimportant changes must be rejected by the automated change detection method. To the best of our knowledge, the proposed change detection method is the first application of image processing approaches in detecting breaches in the integrity of and attached objects in front of fence wires in the context of protecting outdoor perimeter security using a patrol robot.
The automated change detection method can detect and display approximate locations and possible percentages of changes whilst overcoming the above mentioned unimportant changes in these kinds of multiple outddor images. The method begins with converting an original colour input image to a gray input image and a region of interest image is automatically cropped from the gray input image. Edges of fence wires are then extracted from the region of interest by using a combination of the Sobel edge detector and an adaptive thresholding technique. Edges of fence wires are enhanced with a morphological operation, dilation. To extract objects in between edges of fence wires (i.e., diamond-shape objects), a complement operation is applied into the edged-enhancement image. In the inverted image, diamond-shape objects are eliminated from other objects based on information of an average area value in pixels. This value is determined once in a calibration process. Objects, which are not removed in the previous step, are fed into a fuzzy inference system in calculating their probability values. Based on these probability values, the objects can be separated into significant or unimportant changes. By extracting centroids of objects that belong to significant changes, approximate locations and probability values of significant changes can be displayed in the region of interest image.
The paper is structured as follows: Section 2 describes the automated change detection method; Section 3 presents input images used in this experiment and explains how these input images were acquired; Section 4 presents experimental results; Section 5 discusses the performance of the proposed change detection method. Conclusions are presented in Section 6.
The Automated Change Detection Method
The method consists of four main steps: (1) detecting edges of fence wires, (2) enhancing edges of fence wires, (3) removing diamond-shape areas and (4) determining significant or unimportant changes. Detailed explanations of the main steps are described in the following sub-sections.
Detecting edges of fence wires
Prior to detect regions of change of fence wires, edges of fence wires must be detected first. Detecting edges of fence wires in these kinds of multiple outdoor images is a very difficult problem. Not only the wires are very thin (i.e., 2.5 mm), the problem is that there could be considerable background clutter, a significant daytime variation in illumination across the fence, as well as parallax caused by camera motion. Since focus of this research is to detect only regions of change on particularly fence wires including breaches in the integrity of and attached objects in front of fence wires, parallax can be explicitly eliminated by detecting straightforward edges of fence wires.
To detect edges of fence wires, the Sobel edge detector was chosen in this research. The reason of choosing the Sobel detector is that it can be utilized to pursue edges in diagonal directions only since edges of fence wires used in this research are often composed in diagonal directions. Any edge detectors such as Prewitt, Roberts, Laplacian of Gaussian and Canny operators can be used to detect edges of fence wires.
Prior to apply the Sobel detector to an input image, a colour image, I
rgb
(x, y), is firstly converted to a gray-level image, I
gray
(x, y), that refers to (1) and (2) below (Cheng, et al., 2001).


where subscript i is the sequential index of the pixel location at u ∈ [1,U],v ∈ [1,V], UV = 2304x 1728 and superscripts r, g, b denote the RGB colour components, respectively. Secondly, a region of interest (ROI) is extracted automatically from the I
gray
(x, y) into a specific rectangle (I
roi
(x, y)). The rectangle is a four-element vector with the form [xmin ymin width height]; these values are specified in spatial coordinates and obtained by referring to (3), (4), (5), and (6) below.


where h and w are the height and width of the input image in pixels. In providing enough information of fence wires, a 4Mb file was used for each input image. The size of a 4Mb file is 2304 by 1728 pixels. Hence, h is 1728 pixels and w is 2304 pixels (Tanjung, et al. 2008). The purpose of extracting a ROI from the I gray (x, y) is to remove the sky, tops of left and right posts of the wire fence and tops of trees since searching of significant changes is limited from the ground to 1.5 meters height. In the real-time application, breaches and attached objects often occur on the ground to 1.5 meters height.
Next, the Sobel detector is applied to the I
roi
(x, y) without performing global thresholding in generating an edged image, I
edged
(x, y), by referring to (7), (8), (9), (10), (11), (12), and (13) below (Baldock, R. & Graham, J., 2000).


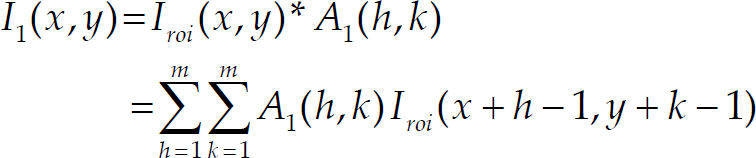

where * indicates a discrete convolution, A1 and A2 are the Sobel masks, which are m × m images and I roi (x, y) is a h/2 × w image. × runs from 1 to h/2 - m +1 and y runs from 1 to w – m +1.
Compute the gradient magnitude approximation at each pixel (x, y) as

To generate the I
edged
(x, y), for every pixel in the G(x, y),

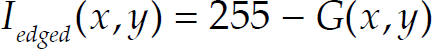
As seen in equation (13), edges of fence wires are forced into darker areas and vice versa.
Output of the Sobel detector is an edged image which is normally in a gray level image. The edged image has often to be converted to a binary image for further process like boundary tracing. The available edge detectors use the global thresholding to convert the edged image to a binary image. As a result of non-uniform illumination that occurs on fence wires, the global thresholding may not the best solution in converting the edged image to a binary image. To overcome non-uniform illumination that occurs on fence wires, an adaptive threshold technique is applied to the edged image in converting it to a binary image. The adaptive threshold technique is outlined by referring to equations (14), (15) and (16) below (Arques, et al., 2006; Tanjung, et. al., 2008).
Convolve the I
roiedge
(x, y) with the mean statistical operator,

where M fil (h, k) is an image with a n by n filter containing equal weights whose values are ones, referred to as the averaging filter in which n is 50.
Subtract the I
roiedge
(x, y) from the convolved image, C(x, y),

To produce a binary image (BW(x, y)), threshold the difference image, S(x, y), with 0.

As seen in equation (16), zero is set constant as a threshold value by the adaptive thresholding technique in converting the edged image to a binary image although pixels values vary in the edged image as a result of illumination variation.
After applying the adaptive threshold technique to the BW(x, y), edges of fence wires observably appear in lighter areas. For further process, edges of fence wires have to enhance using morphological operations such as dilation and erosion. First, small objects in the BW(x, y) are removed by referring to equation (17) below ((Gonzalez, R. C. & Woods, R. E., 2008).
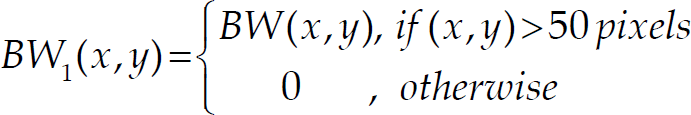
where 50 pixels represent an object with the area of 100 square millimetres (the size of a small electronic resistor) when an image is captured from a 400 cm distance in the real life setting. It means that objects whose sizes are 50 pixels are categorized as unimportant changes in this experiment.
Next, dilation is applied to the BW1(x, y) in which line structuring elements (i.e., the thickness of the line is 3 pixels) in 45 degree and 135 degree directions, B45 and B135 respectively, were used.


where a is a pixel value of the BW1(x, y) or BW2(x, y).
As a result of dilation, edges of fence wires in the BW3(x, y) become more thick than their original size in the BW1(x, y). The BW3(x, y) is a new binary image.
To detect breaches in the integrity of and attached objects in front of fence wires, an area-based algorithm is developed in this research. Since a chain-link mesh fence (i.e., a diamond netting fence) is used in this experiment, potential breaches and attached objects will have different areas and shapes with diamond-shape objects in between edges of fence wires. By knowing an average area of these diamond-shape objects, diamond-shape objects can be removed based on information of the average area. The area-based algorithm will overcome background clutter since edges of fence wires divide big objects on the background into diamond-shape objects as well.
The area-based algorithm is outlined as follows. Firstly, each element of the BW3(x, y) is complemented in generating another new binary image, CM1(x, y) referring to equation (20) below.
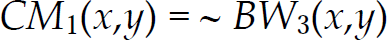
where ~ is a not logical operator.
Secondly, diamond-shape objects are removed from the CM1(x, y) by referring to equation (21) below.

The value of avgV was experimentally determined based on information of Table 1 below.
Summarization of avgV values

where d denotes the distance between a mobile camera and the wire fence in meter, s stands for a file size in Megabytes, w is the width of fence-wire in pixels and avgV was calculated by multiplying w with 1000 pixels. In this study, the file size of each input image was 4 MB and d was 4 m. Hence, the avgV value was setup constant for any input image at 3000 pixels.
Next, any line-shape objects in the CM2(x, y) is removed by referring to equation (22) below.

where ecc is an eccentricity (i.e., the ratio of the distance between the foci of the ellipse and its major axis length) value. The ecc value is between 0 and 1. An ellipse whose eccentricity is 0 is actually a circle, while an ellipse whose eccentricity is 1 is a line segment. In this study, the ecc value was setup constant for every input image at 0.99.
Finally, dilation is perform towards the CM3(x, y) by referring to equation (23) (Gonzalez, R. C. & Woods, R. E., 2008).

where B rect is a rectangle-shape structuring element whose size is 10 rows and 15 columns in the structuring element neighbourhood.
Objects in the CM4(x, y) could become significant or unimportant changes. A decision-making system is developed in this research in determining which objects in the CM4(x, y) belong to significant or unimportant changes. The decision-making system is the Mamdani's fuzzy inference system (FIS) (Asai, K., 1995; Sato, et al., 2000).
The FIS has 4 inputs (X-BoundingBox, Y-BoundingBox, Eccentricity and Xwidth), 1 output (Probabilityaschange) and 8 rules (see Table 2 below). X-BoundingBox, Y-BoundingBox and Eccentricity are interpreted as {Low, High} while Xwidth is denoted as {Small, Large}. The output is decoded as {Low, High}. Triangular membership functions (trimfs) were used for all inputs and the output. Parameters of the triangular membership functions are summarized in Table 3, below.
Fuzzy rules

Fuzzy rules
where I1, I2, I3 and I4 denote X-BoundingBox, Y-BoundingBox, Eccentricity and Xwidth. O stands for output (i.e., Probabilityaschange).
Summarization of triangular membership function parameters

X-BoundingBox and Y-BoundingBox were used to locate positions of changes. Objects with low possible percentages were often being in low ranges. Eccentricity was used to detect line-shape objects caused by straight fence wires whose eccentricity values were in high ranges. Xwidth was used to recognize low possible percentage objects whose values were often in small ranges. Output of the FIS is a single crisp value whose value is in between 0 and 100. The FIS is composed from 5 main steps:
A single number of the defuzzification output represents a change possible percentage of an object (P
b
). An object in the CM4(x, y) is classified as an unimportant or a significant change based on information of its P
b
by referring to (24) below.

where CM5(x, y) is a final change mask and κ is a variable adjusted in producing more or less objects in the CM5(x, y). In this experiment, the κ was set constant at 60. The value of 60 represents a high possibility as a significant change. Finally, locations and possible percentages of changes are depicted on the I roi (x, y) by extracting centroids of objects in the CM5(x, y).
To test the robustness of the change detection method, outdoor images, acquired by a mobile camera from slightly different viewing positions, angles and at different times, in Figs. 1, 3, 4, and 5 were selected. The following is an explanation how outdoor images were captured.
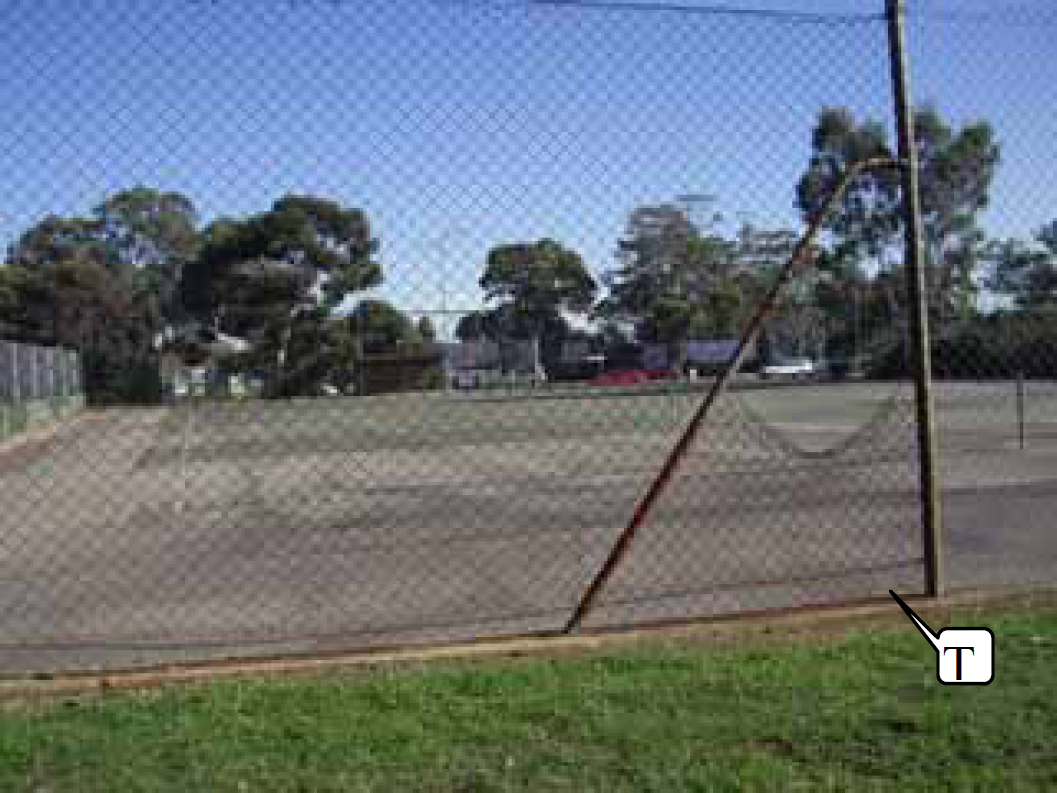
The first input image (II-1). As can be seen in Fig. 1, the image shows that there are: (1) a large breach on the fence, (2) a small cut indicated by a T symbol (see enlarging of the cut region in Fig. 2), (3) green grass in front of fence wires, (4) trees in the backgrond and (5) other objects behind fence wires. The II-1 (Fig. 1) was captured on a sunny day in the morning

Enlarged small cut region
As seen in Figs. 3, 4, and 5, illumination significantly changes in each input image. Moreover, fence wires are very thin and there are three objects attached in front of fence wires.

The second input image (II-2)

The third input image (II-3)

The fourth input image (II-4)
In this study, the movement of the mobile camera was restricted only by three degrees of freedom (X, Y, and Δθz axes). The X axis represented translation on left (−) or right (+) sides. The Y axis indicated movement on forward (+) or backward (−) sides (i.e., zoom in / zoom out). The Δθz axis was rotation on the clockwise (+) or anticlockwise (−) directions. The (0, 0, 0) position was referred as the origin position. Fig. 6, below, depicts the origin position. The  symbol represented the mobile camera. The distance between the digital camera and fence wires was 400 cm. The distance between fence wires and its background was infinity.

The origin position (0, 0, 0)
To capture the input image 1 (II-1), the digital camera was manually shifted to a new (0, 0, +10) position in which the origin position was a reference position. Fig. 7, below, depicts top view of the II-1 position.

Top view of the II-1 position (0, 0, +10)
After capturing the II-1, three new objects were attached in front of fence wires. The digital camera was then put back to the origin position. From this origin position, the digital camera was then shifted manually 20 cm forward (zoom in) and 20 cm to the right. It was then rotated 15 degrees in a clockwise direction. This current camera position, (+20, +20, +15), was referred to as the II-2 position. Fig. 8, below, depicts a top view of the II-2 position.

Top view of the II-2 position (+20, +20, +15)
To capture the II-3 (see Fig. 9, below) and the II-4 (see Fig. 10, below), the digital camera was shifted to the II-3 position, (+10, +10, +15), and to the II-4 position, (+5, +5, +10) in which the origin position was their reference positions.

Top view of the II-3 position (+10, +10, +15)

Top view of the II-4 position (+5, +5, +10)
Moreover, other multiple outdoor images of the same scene containing fence wires captured in another day were used as inputs in testing the robustness of the change detection method. Fig. 11, below, depicts the reference image (RI) for these new multiple outdoor images. It was captured in such a way that the position of a mobile camera was perpendicular towards the outdoor scene containing fence wires. The distance between the digital camera and fence wires in the scene was 6 m and the size of each new outdoor image is 8 MB. This mobile camera position was referred as the origin position ((0,0,0) position). The origin position is indicated by a red  form (i.e., 0 number position in Fig. 12).

The reference image (RI) used in the next experiment is an outdoor scene containing fence wires. As can be seen in the RI, two artificial templates are attached on left and right posts of fence wires, a black school bag is put behind fence wires, and there are no breaches in the integrity of fence wires

A top view of camera positions when capturing one reference image (a red form) and eight input images (eight black  forms)
After capturing the RI, three new objects (i.e., two small boxes in front of fence wires and someone who represents an intruder behind fence wires) were added to the scene and an object (i.e., a school bag behind fence wires that denotes a disappearing old object) was removed from the scene.
Moreover, two breaches in the integrity of the wire fence (i.e., a large breach in the middle right of and a tiny breach in the bottom right of fence wires) were added to the scene. The digital camera was then shifted manually 20 cm forward (zoom in) and 20 cm to the right. It was then rotated 15 degrees in an anticlockwise direction. This current camera position, (+20, +20, −15), was referred to as the 1st input camera position, from which the RI was captured, (see position 1 in Fig. 12, above). From the 1st input camera position, a new input image was captured (II-5). To capture the sixth input image (II-6), the mobile camera was then shifted manually to the 2nd input camera position (0, +20, 0) (see position 2 in Fig. 12, above), from which the RI was captured. The II-6 was captured at slightly different times with the II-5 (i.e., several seconds after capturing the II-5). The main reason of capturing the II-5 and II-6 at slightly different times is only to simulate that the mobile camera could probably come into these positions in the real time application. Figs. 13a and b, below, depict the II-5 and II-6.

The II-5 and II-6 were captured by a mobile camera from slightly different positions and angles, and at slightly different times; however both II-5 and II-6 were captured two and half hours later after the RI was captured. In other words, illumination has significantly changed when capturing the RI and the II-5 and II-6
After capturing the II-5 and II-6, the mobile camera was put back to the origin position. From the origin position, the digital camera was manually moved again 20 cm backward (zoom out) and 20 cm to the right. It was then turned 15 degrees in an anticlockwise direction. This current camera position, (+20, −20, −15), was referred to as the 3rd input camera position (see position 3 in Fig. 12, above). From this position, the seventh input image (II-7) was then captured. To capture the 8th input image (II-8), the mobile camera was then shifted manually to the 4th input camera position, (+20, 0, −10), (see position 4 in Fig. 12, above), from which the RI was captured. The II-8 was captured at slightly different times with the II-7 (i.e., one minute after capturing the II-7). Figs. 14a and b depict the II-7 and II-8.
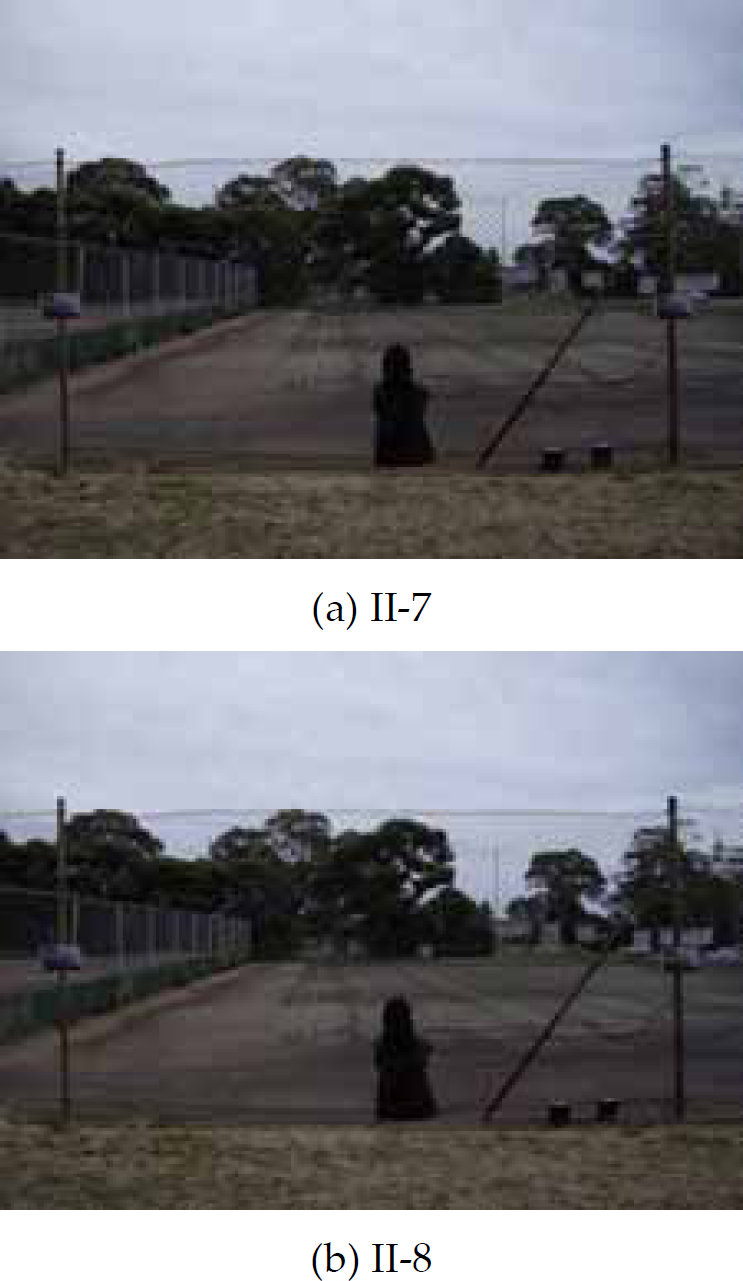
The II-7 and II-8 were captured four hours and 36 minutes later after the RI was captured. As seen in Figs. 14a and b, illumination in both images is darker rather than illumination in the RI, II-5, and II-6
A same scenario of how to capture the II-5, II-6, II-7, and II-8 is applied in capturing other input images. Figs. 15a and b depict the 9th and 10th input images (II-9 and II-10). Figs. 16a and b depict the 11th and 12th input images (II-11 and II-12).
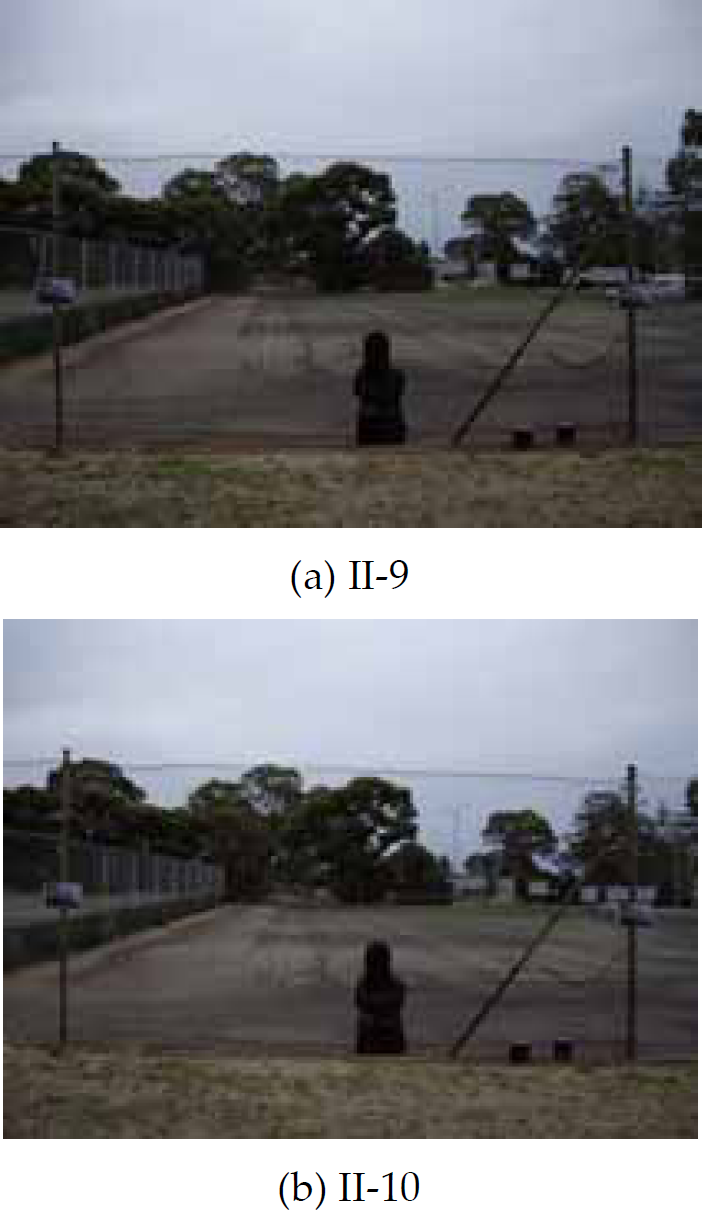
The II-9 and II-10 were captured six hours and 56 minutes later after capturing the RI

The II-11 and II-12 were captured seven hours and 14 minutes later after the RI was acquired
Table 4 summarizes mobile camera positions and times when acquiring the RI and eight input images. In the next section, experimental results of this study are presented.
Summarization of camera positions and times when capturing the RI and input images used in the next experiment

In this study, changes on trees and the sky were not under consideration; hence, searching of significant changes, such as breaches in the integrity of fence wires and attached objects in front of fence wires, was only limited on 1.5 meters height from the ground since breaches and attached objects often happen in this 1.5 meters height from ground region. Fig. 17, below, depicts a ROI cropped automatically from the II-4 by referring to (1), (2), (3), (4), (5), and (6).

A ROI of the II-4 (ROI_II-4)
The ROI_II-4 was then fed into the Sobel edge detector in producing an edged image. Fig. 18, below, depicts an edged image extracted automatically from the ROI_II-4 by referring to (7), (8), (9), (10), (11), (12), and (13).

An edged image detected from the ROI_II-4 (Edge_II-4)
Illumination varies during a day. As fence wires are metal, non-uniform illumination occurs along fence wires during a day. Fig. 19, below, depicts the result of enlarging a small section at the bottom right of fence wires in the Edge_II-4 marked by a dash line (see Fig. 18, above).

Enlarging the small bottom right of fence wires in the Edge_II-4
As seen in Fig. 19, edges of fence wires are not uniform in darker areas. The edges often change from darker areas into lighter areas.
To overcome non-uniform illumination that happens on fence wires, global thresholding might not be the best solution in generating a binary image for further processing. An adaptive thresholding technique was adopted in this study. Fig. 20, below, depicts a binary image produced after applying the adaptive thresholding to the Edge_II-4 that refers to (14), (15), and (16). To enhance edges of fence wires in the BW_II-4, morphological operations such as removing small objects and a dilation technique by using diagonal line structuring elements in 135 degree and 45 degree directions were adopted. Fig. 21, below, depicts an enhanced binary image generated after applying morphological operations that refers to (17), (18), and (19).

A binary image after performing the adaptive thresholding into the Edge_II-4 (BW_II-4)

An enhanced image produced after performing morphological operations on the BW_II-4 (EnhancedBW_II-4). As seen in Fig. 21, breaches in the integrity of and attached objects in front of fence wires have different forms and sizes with diamond-shape fence wires
By knowing an average size of these diamond-shape fence wires, these diamond-shape areas could be eliminated from the EnhancedBW_II-4. Fig. 22, below, depicts a new binary image (CM_II-4) as a result of inverting the EnchancedBW_II-4 that refers to (20).
A new binary image (CM_II-4) after inverting the EnchancedBW_II-4
Refer to (21) and Table 1, objects that have sizes less than 3000 pixels, could be eliminated from the CM_II-4 in order to generate another binary image, CM2_II-4 (see Fig. 23, below). Any line-shape objects were then removed from the CM2_II-4 by referring to (22) (see Fig. 24, below). Dilation with rectangle structuring element was then applied to the CM3_II-4 that refers to (23). Fig. 25, below, depicts the result of dilation towards the CM3_II-4.

A binary image generated after removing objects that have sizes less than 3000 pixels (CM2_II-4)

An image as result of eliminating line-shape objects (CM3_II-4)

A result of dilation towards the CM3_II-4 (CM4_II-4)
Next, properties of objects in the CM4_ II-4, such as positions in X and Y axes, eccentricities and widths in X axis, were then fed into the FIS in order to calculate possible percentages as significant changes. Based on information of each object's possible percentage, an object can be categorized as an unimportant or a significant change by referring to (24). Fig. 26, below, depicts a change mask of the II-4.

The II-4 changed mask. As seen in Fig. 26, two breaches in the integrity of fence wires and three attached objects in front of fence wires are accurately detected by the automated change detection method
Fig. 27, below, depicts possible percentages of significant changes and estimated locations of significant changes. Yellow square forms indicate that there are high possibilities as significant changes in these areas.
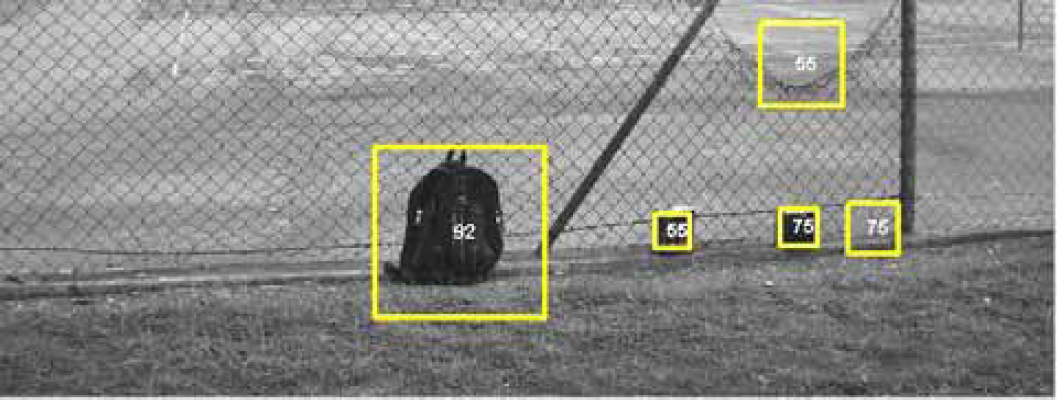
Locations and possible percentages of significant changes detected from the II-4
Figs. 28a and 28b, 29a and 29b, and 30a and 30b, below, depict change detection results of the II-1, II-2 and II-3.
The II-1 change detection result. Changed mask of the II-1 (a) and displaying a significant change in the II-1 (b). The method can only detect a big breach in the right top of fence wires while missing a small hole in the right bottom of fence wires

The II-2 change detection result. Changed mask of the II-2 (a) and locating significant changes in the II-2 (b). The method can correctly detect all significant changes in the II-2

The II-3 change detection result. Changed mask of the II-3 (a) and depicting significant changes in the II-3 (b). The method can detect all significant changes while it also wrongly detects a few significant changes

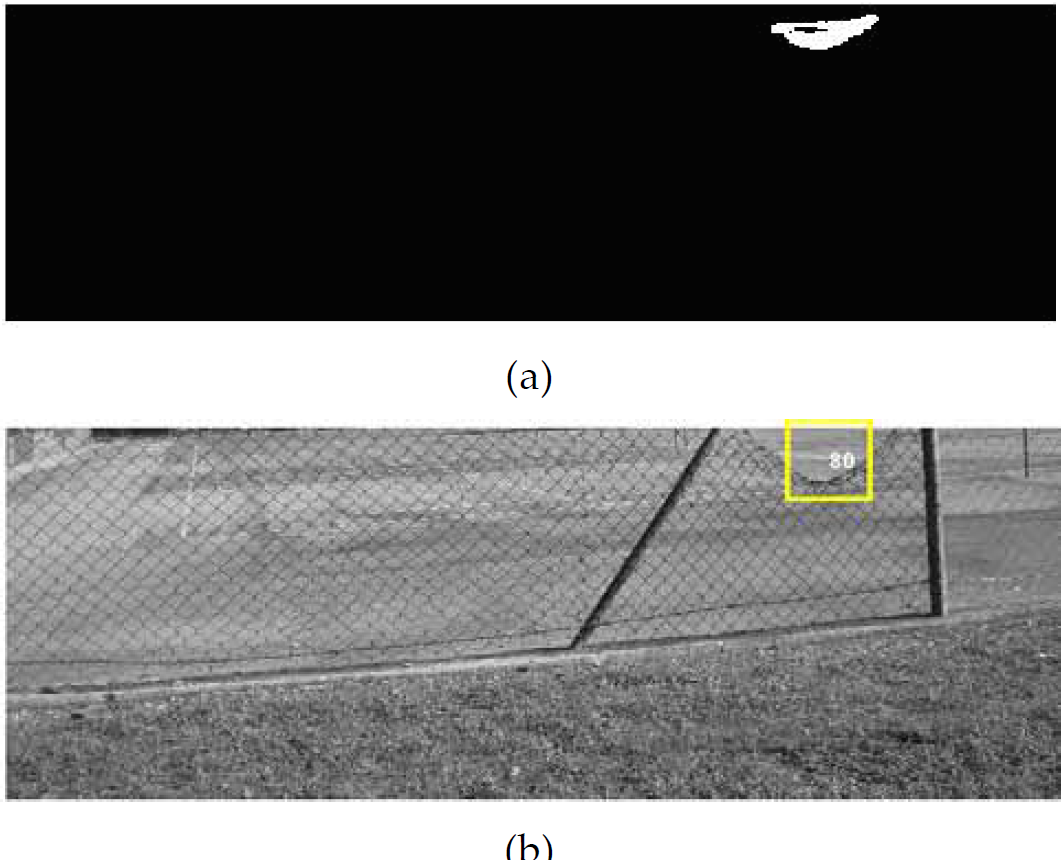
Changed mask of II-5 (CHM_II-5) (a) and locations of changes detected from II-5 (b)
The following Figs. depict change detection results towards other multiple outdoor images.

Changed mask of II-6 (CHM_II-6) (a) and locations of changes detected from II-6 (b)

Changed mask of II-7 (CHM_II-7) (a) and locations of changes detected from II-7 (b)

Changed mask of II-8 (CHM_II-8) (a) and locations of changes detected from II-8 (b)

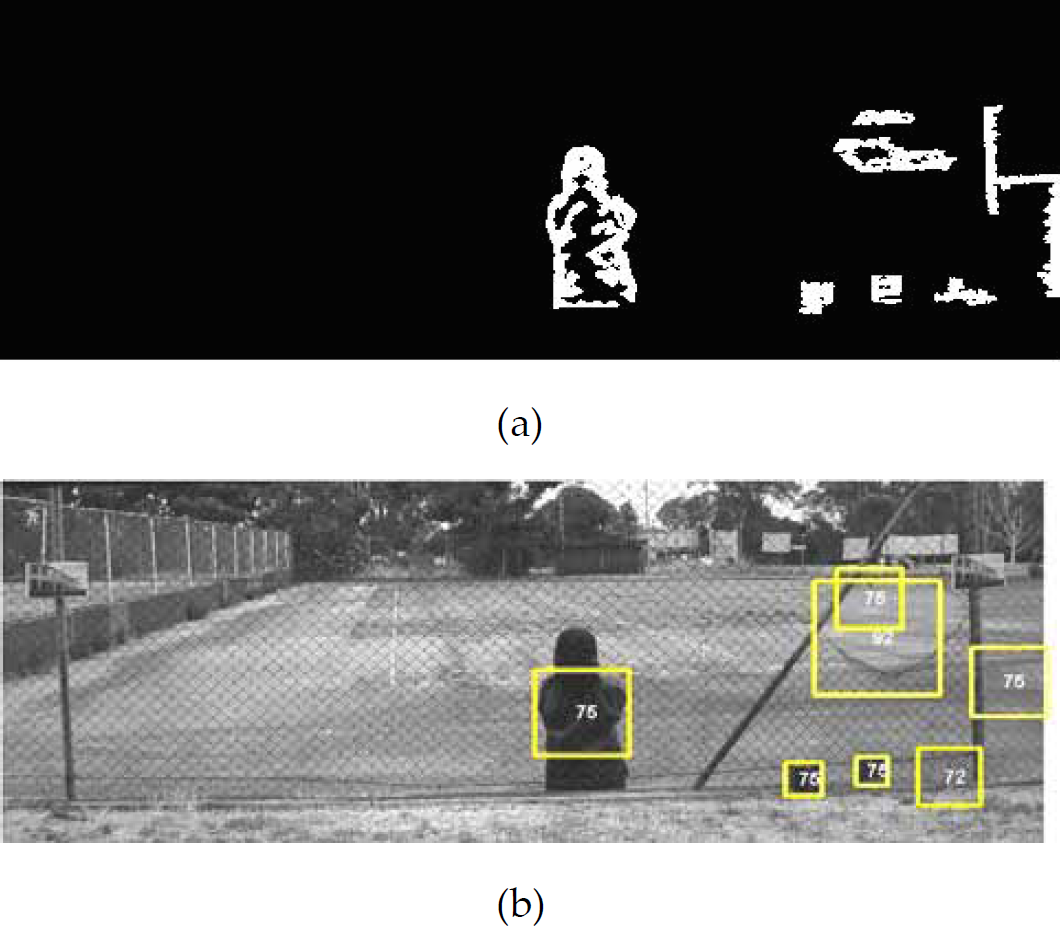
Changed mask of II-9 (CHM_II-9) (a) and locations of changes detected from II-9 (b)

Changed mask of II-10 (CHM_II-10) (a) and locations of changes detected from II-10 (b)

Changed mask of II-11 (CHM_II-11) (a) and locations of changes detected from II-11 (b)
Changed mask of II-12 (CHM_II-12) (a) and locations of changes detected from II-12 (b)
The purpose of the automated change detection method is to provide assistance to operators in an inspection room regarding regions of change in multiple images of the same scene acquired by a mobile camera from slightly different viewing positions, angles and at different times by displaying estimated locations of changes and possible percentages of changes in each ROI_II. The regions of change are presented in yellow square forms in order to attract the attention of operators in the monitor room for further assessments.
In evaluating the performance of the change detection method, subjective, quantitative and computational complexity evaluations are used in this study. The followings are the subjective evaluation by human observers. For a prior knowledge to the method, we assume that there are no any breaches and/or any attached objects on wire fences. In the II-1, there are two significant changes (i.e., large and small breaches). In the II-2, II-3 and II-4, there are five significant changes such as large and small breaches, a school bag and two small boxes. In the II-5, II-6, II-7, II-8, II-9, II-10, II-11 and II-12, there are four significant changes such as large and small breaches and two small boxes. The intruder is not included into consideration since the intruder is behind fence wires. This research focuses only on detecting breaches in the integrity of and attached objects in front of fence wires. Table 5, below, summarizes results of change detection towards the all input images (IIs). The true positive rate (TPR) and the false negative rate (FNR) are determined by referring to (25) and (26), below.


Recapitulating of change detection results

The TPR and FNR of the change detection method are 97.96 % and 2.04%.
where TP stands for true positive, correctly detected as foreground, FN is false negative (miss), falsely detected as background, and FP is false positive (false alarm), falsely marked as foreground.
For the quantitative evaluation of the method, the ground truth based measure is utitilized. Figs. 39a, b and c depict ground truth images (expected changed masks) for the II-1, II-2 – II-4 and II-5 – II-12.

Grouth truth images of the II-1 (a), II-2 – II-4 (b) and II-5 – II-12 (c) used in the pixel-based measure
Table 6, below, summarizes TP, FN, FP and TN (i.e., true negative, correctly detected as background) of each input image.
Grouth truth measure parameters of all IIs

Referring to equations (25) and (26) above, the TPR and FNR of the change detection are 46.32% and 53.68%. The false positive rate (FPR) and true negative rate (TNR) are calculated by referring to equations (27) and (28) below.


The TNR and FPR of the change detection method are 99.21% and 0.79%. Based on information of the TPR, FNR, TNR and FPR, the proposed method has enough capability to detect correctly all significant changes in these kinds of multiple outdoor images. However, the proposed method has to improve since the method misses a lot of true positives. Although the method fails to spot lots of corrected pixels, the method can minimize unimportant changes in these kinds of multiple outdoor images. Overall, the method can detect correctly any potential significant changes such as breaches in the integrity of and attached objects in front of fence wires while minimizing unimportant changes caused mainly by camera motion, illumination variation, background clutter, tiny sizes of fence wires and non-uniform illumination that occurs on fence wires.
For the computational complexity evaluation, all input images are processed in a computer laptop with specifications as follows. Its hardware is Toshiba Tecra A3, Intel Pentium M 1.6 GHz and 760 MB of RAM. Its software is Windows XP Professional Version 2002, Service Pack 1 and the program was run in the Matlab environment. Time consumptions needed by the computer to process all input images are depicted in Table 7, below.
Time consumtions

As depicted in Table 7 above, the computer needs 0.98 to 2.7 minutes to process each input image. It happens as a consequence of utilizing a big file image (i.e., 4–8 MB) in providing enough information of tiny fence wires in pixels (i.e., 2–3 pixels) and the adaptive thresholding technique in dealing with non-uniform illumination that occurs on fence wires. 80% of the computational time is used by the adaptive thresholding technique in converting an edged image to a binary image.
In this paper, a new change detection method has been developed for detecting regions of change, such as breaches in the integrity of and attached objects in front of fence wires, in multiple outdoor images of the same scene containing fence wires captured by a mobile camera from slightly different viewing positions, angles and at different times. At the same time, the presented method also can reduce unimportant changes caused mainly by camera motion, illumination variation, background clutter, tiny sizes of fence wires and non-uniform illumination that occurs on fence wires. To overcome tiny sizes of fence wires and non-uniform illumination on fence wires, a combination of the Sobel detector and an adaptive threshold technique has been used to extract edges of fence wires since the global threshold approach may not be the best solution in this specific case. To improve quality of edges of fence wires, morphological operations such as dilation and erosion have been used to enhance edges of fence wires. An area-based algorithm and a fuzzy inference system have been utilized to separate and classify objects to significant or unimportant changes.
Experimental results show that the presented method can detect and display locations and possible percentages of any potential significant changes such as small and large breaches in the integrity of fence wires, a school bag and two small boxes in front of fence wires. However, the presented method still needs much improvement in reducing false negatives and computational times. To minimize false negatives, tracking and finding directly discontinuities on edges of fence wires are another possible solution that can be investigated further instead of using an area-based algorithm in detecting breaches in the integrity of fence wires. In addition, the computer hardware has significantly improved in terms of speed and capacity, thus the computational complexity will be able to be overcomed respectively. In the future, the presented change detection method could be integrated into a patrol robot in order to assist human guards in protecting outdoor perimeter security.
Footnotes
7. Acknowlegment
Authors thank to the Defence Science and Technology Organisation (DSTO) for supporting this work.