
Abstract
Infrared small target detection is widely applied in lots of practical applications, but due to the complicated edges in practical scenarios, most existing detection algorithms usually lead to many false alarms and cannot detect the target accurately. Addressing this problem, a novel edge-preserving background estimation method based on maximum patch similarity was proposed in this article. At first, we will propose an improved local adaptive contrast measure to suppress the pixel-size electronic noises. Then, maximum patch similarity with minimum improved local adaptive contrast measure can be utilized to preserve the edge in the estimated background. Finally, we can obtain target image by filtering the background image from original image and use adaptive threshold segmentation to detect the small target in our target image. It is shown from experiments that our proposed method has better detection results in diverse infrared images, improving signal-to-clutter ratio gain and background suppression factor of the images significantly and efficiently.
Keywords
Introduction
Infrared small target detection can be used in remote sensing, industry, military, precision-guided munitions, and many other fields. In recent decades, there are a large number of papers on the long-range infrared small target detection and tracking algorithms are put forward for research and discussion. However, there are a variety of scenarios with complicated background in practical applications, which usually leads to many false alarms and cannot accurately achieve the target detection. So, it is still an important and urgent problem to design a good infrared small target method, which can decrease false alarms caused by edges.
Generally, researchers detect the small target under two main theoretical foundations. For one thing, the small target is relatively small, roughly several pixels 1,2 ; for the other thing, the gray value distribution is different from surrounding local background, that is, the target has no spatial correlation with the surroundings. 3 –6
Thus, a class of background estimation methods that utilize gray value differences between the small target and its surroundings is proposed. For example, Chen et al. proposed a local contrast method (LCM) 3 and kernel regression model, 7 –9 which use local gray value contrast of small target and its surroundings to distinguish the target from background. Since the edges also have a high level contrast with their surroundings, the method could only segregate target from the image only containing small target and homogeneous background. Hence, it is necessary to propose a method to protect the edges in the background image.
Addressing this problem, a large number of background estimation methods are proposed, such as bilateral filter (BF) methods. 10,11 Unfortunately, edges are easy to be smoothed out in the process of filtering. Some methods dedicate to detect the direction of edges and use it to accomplish background estimation. For example, John Barnett proposed median subtraction filter in 1989. 12 Kim et al. proposed modified-mean subtraction filter 13 but the method could only preserve boundaries with horizontal directions. Deng and Sun came up with a weighted local difference measure to separate the true target from jamming objects, 1,2 the method calculated the modified local entropy of an image to weight the multiscale local contrast. However, the corners in the image also have a high leave of local entropy and some zigzagged edges still be remained in the background. In addition, the L2 norm also used to estimate background. Yuan et al. came up with two-dimensional least mean square (TDLMS) filter to detect the small target, 14 but owing to its sensitivity to outliers, the background estimation method usually produces unsatisfying results in junction area of different edges. 15 Bai and Wang proposed a novel semi-supervised learning-based edge-preserving background estimation. 16 Background estimation ability of this method is improved to some extent; nevertheless, the model not suitable for practical application owing to its parameters tuning result usually cannot catch up with the vagaries of practical images and heavy computation.
In order to detect the dim and small infrared small target accurately and efficiently in various complex background with clutters and noises, a novel edge-preserving background estimation model based on maximum patch similarity was proposed in this article.
Different from only utilizing the gray value contrast between pixels, the structural features of the target are taken into full consideration in this article. By analyzing the structural features of flat regions, edge regions, and small target in infrared images, we find that one patch in the flat region or in a complete edge always contains the same structure with its surroundings. So we can obtain an improved local adaptive contrast measure (ILACM) by calculating the summation of the Euclidean distance between a center patch and its surrounding areas, which could successfully suppress the pixel-size electronic noises (PSENs) with high brightness. 6 Then, ILACM is used to measure the patch similarity among different patches. At last, we utilize the patch with maximum patch similarity to estimate the background image in order to preserve more edges in the background image.
The structure of the article can be expressed as follows: the infrared small target detection model is introduced in “Infrared small target detection model” section. Then, an ILACM and patch similarity based on ILACM are proposed in “Improved local adaptive contrast measure and Patch similarity based on ILACM” sections. In “Background estimation model using maximum patch similarity” section, edge-preserving background estimation method using maximum patch similarity is introduced. “Adaptive threshold segmentation using estimated background” section displays a simple adaptive threshold segmentation using filtered target image. “Experiments and analysis” section introduces the experiments results, including a deep analysis of our methods and comparison results with the state-of-the-art methods. Conclusion will be presented in the last section.
Infrared small target detection model
In small target detection, target image, noise image, and background image are three components of original infrared image, which can be demonstrated by the following equation

where (x, y) is pixel coordinates in the original image. G(x, y) is the original infrared image. GT(x, y) represents the target image. GB(x, y) indicates the background image, which mainly consists of uniform gray-scale areas and edge areas. The noise image GN(x, y) includes high brightness PSENs and stochastic noise. Therefore, reducing the effects of the noises as far as possible and getting an accurate background image estimation are becoming two difficulties of small target detection.
Improved local adaptive contrast measure
Dim and small targets usually are small in size with a few pixels and show few distinct characteristics such as shape and texture, but human visual system (HVS) can distinguish them in the complex background easily by the gray scale contrast between target and background. 17 –19
A traditional LCM for small infrared target detection was proposed 3 based on HSV. However, the region with high brightness PSEN which usually exists in the infrared image also have contrast differences with its surrounding areas; therefore, the LCM may leads to a high false alarm and a low signal-to-clutter ratio (SCR) 20 of the image. In order to deal with this problem, we propose an ILACM in which the structural feature of the small target is adequately considered.
Let V0 be a patch in the image, and its size is

Compared to the traditional LCM, ILACM calculates the summation of the Euclidean distance between the center patch and its surrounding areas; although there is a long distance between one PSEN and its corresponding pixels, the contrast would only be changed in a few pixels and not have too much change by summation. On the contrary, if the small target is included in the center patch, the gray value of all pixels in the patch is more likely to have completely different gray value from its neighbors. Hence, ILACM suppresses PSENs.
Patch similarity based on ILACM
As mentioned above, we have proposed ILACM, which is possible to suppress PSEN in infrared images. Here, the patch similarity can be proposed according to ILACM.
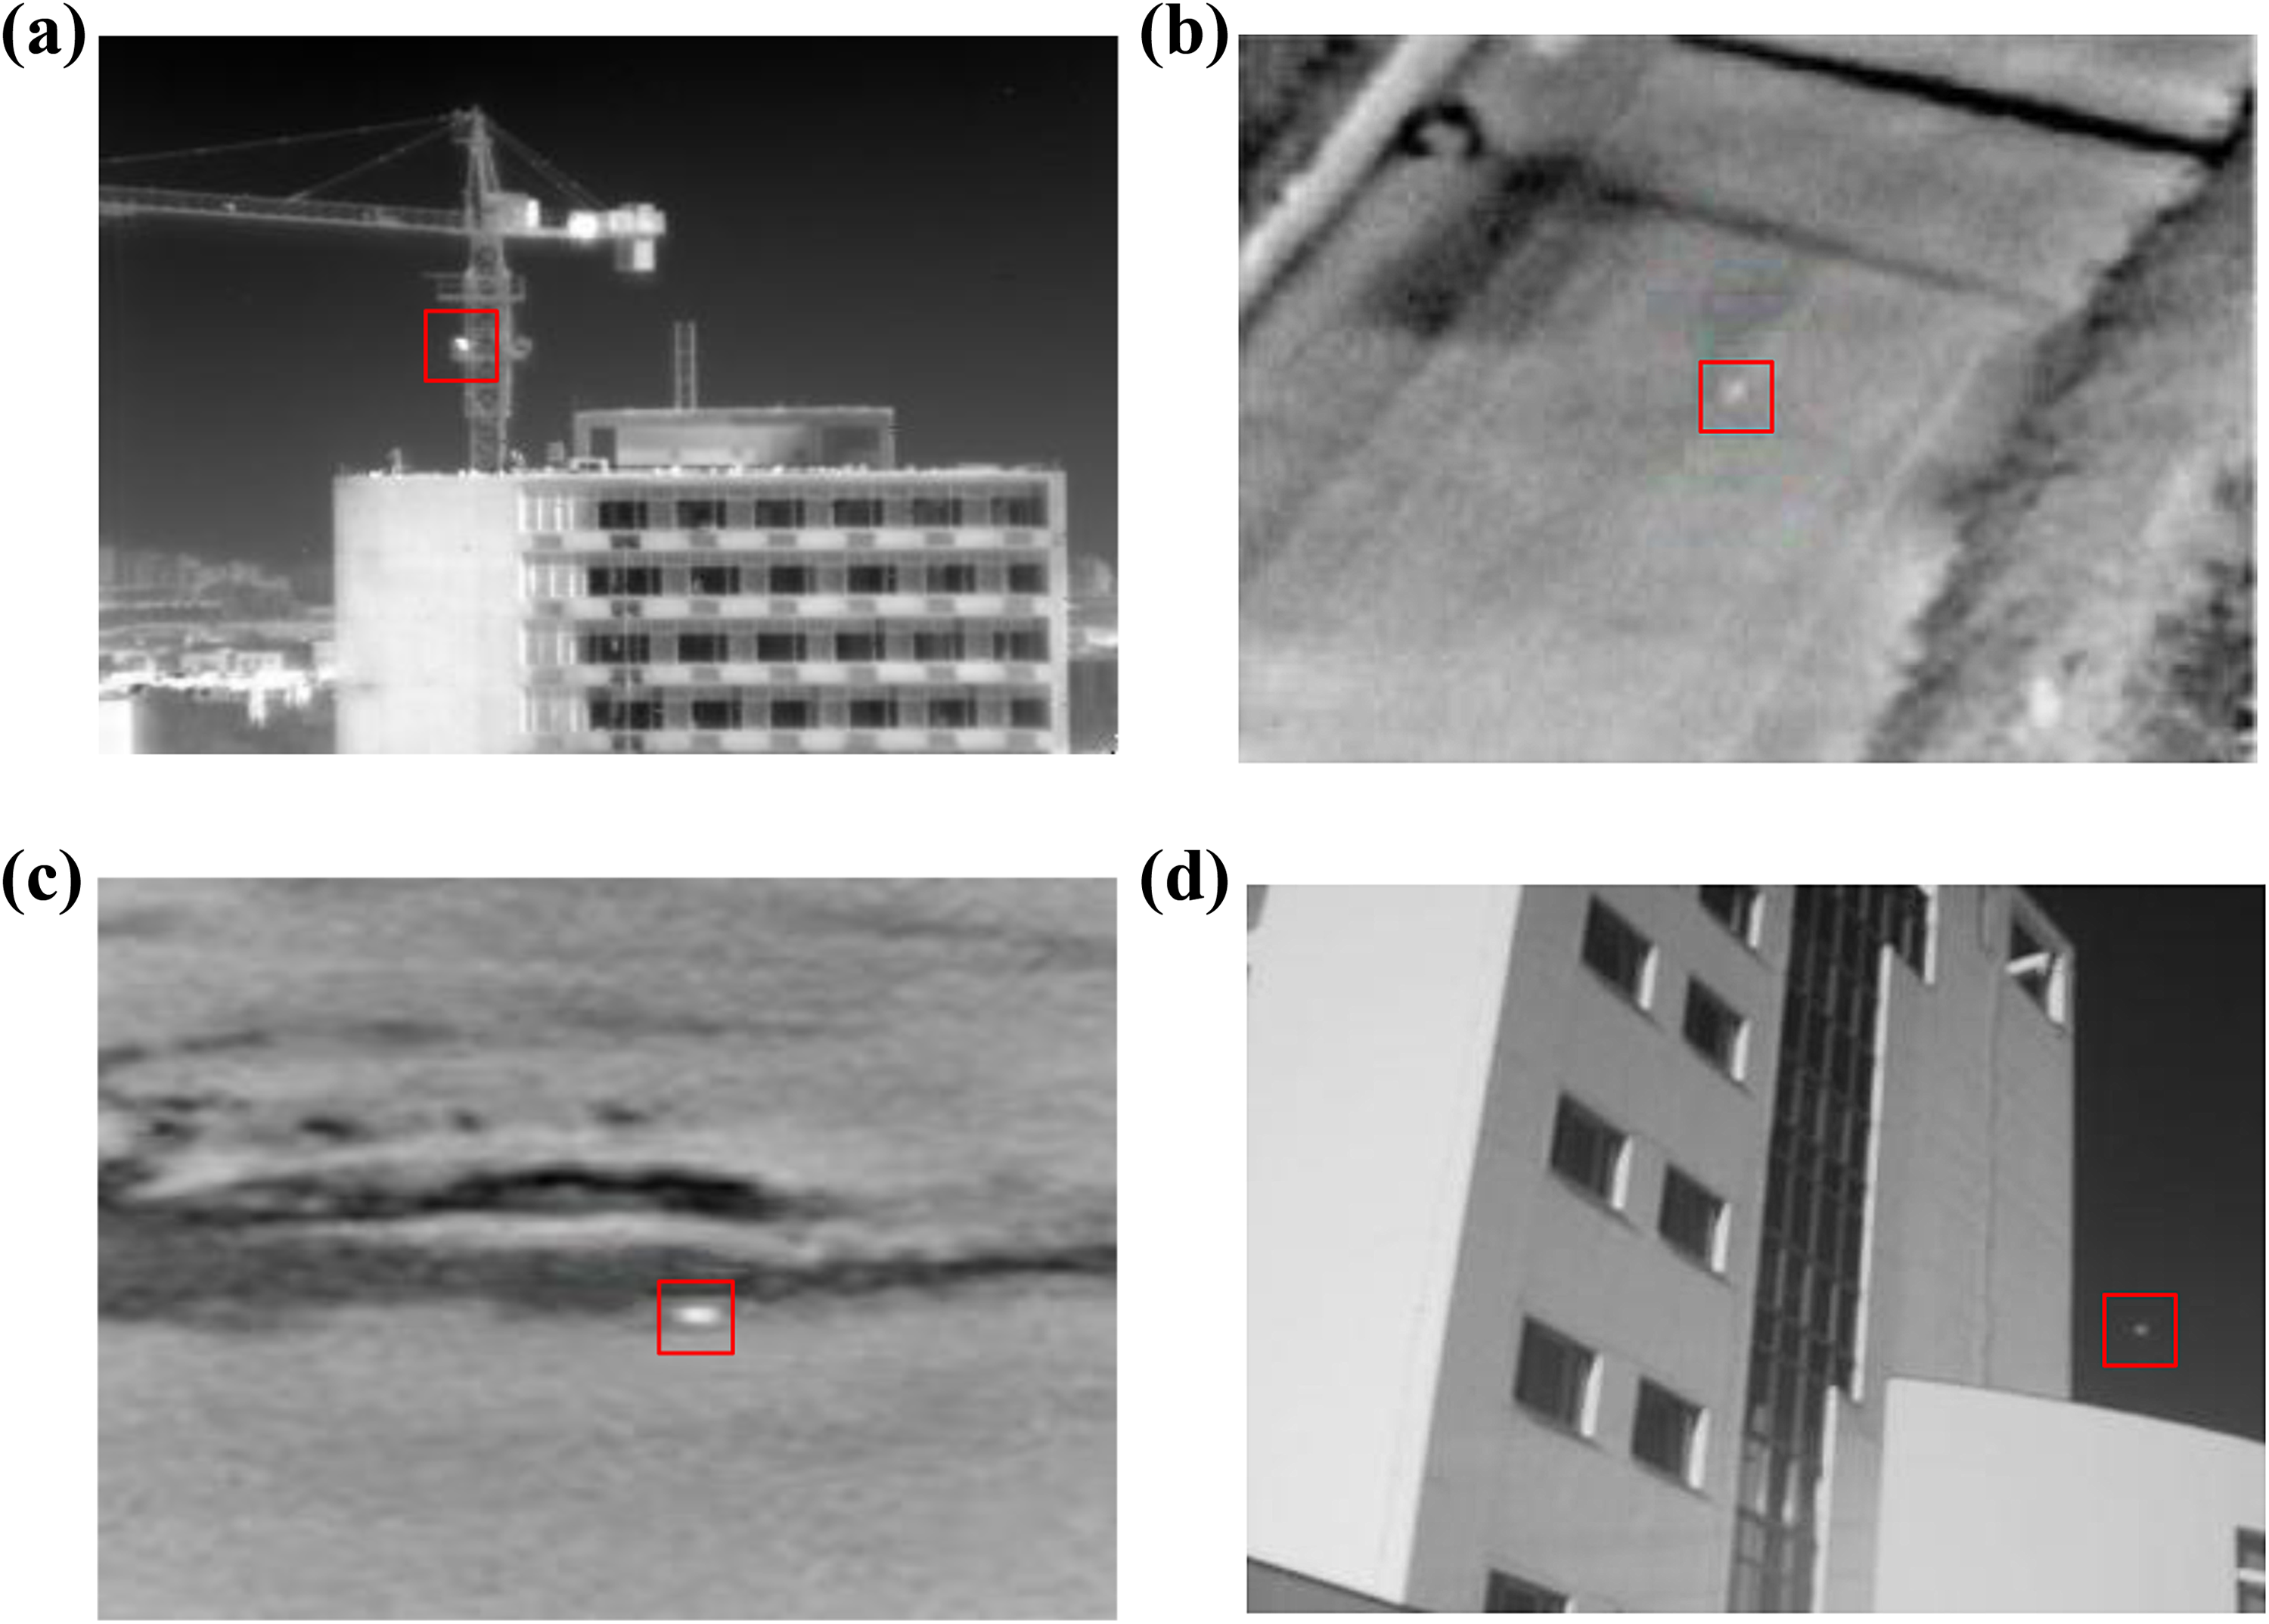
An intricate small target image consists of homogeneous regions, edge regions, and small target; the edge regions usually contain complex edges between different homogeneous regions (namely, the edged of buildings, the border areas between the sky and cloud). Figure 1 shows one infrared small target image with heavy cloud clutter and three marked rectangular as local regions of homogeneous regions; edges and target are magnified for analysis; and images in the last column correspond to their three-dimensional (3-D) gray value distributions. We can easily find one scene with homogeneous gray value usually has the same infrared radiation, which indicates it has a high similarity to the surrounding areas. Similarly, edge, as a complete structure, although it has different gray values with some of its neighborhoods, we can still find there are some similar regions locating along or around the edge on account of the structural integrity, while there is obvious difference between target gray value and its neighboring pixels. So we propose patch similarity which is based on ILACM between different patches.

Structural features of homogeneous regions, edge regions, and small target. (a) One representative infrared image, (b) local region of homogeneous background, (c) local region of edge, (d) local region of small target, and (e) to (g) 3-D gray value distributions of (b) to (d). 3-D: three-dimensional.
As mentioned above, the ILACM k about a center patch and one of its surrounding areas k can be obtained by equation (2). Then, the patch similarity is calculated using the following equation

Obviously, the dynamic range of Sk is (0, 1], which should be inversely proportion to Euclidean distance between the gray value of
Thus, when we want to estimate the gray value of the center pixel of a patch, equation (3) can be used firstly to find a patch with maximum patch similarity in its surrounding areas and then use it to estimate the gray value of the center pixel of the patch. If an edge is included in the patch, we can also find a patch that has a high similarity with it and preserve them well in our estimates. Furthermore, the target does not have similar patches around and can’t be estimated using patch similarity, so the effect of small target on background estimation can be precluded effectively.
Background estimation model using maximum patch similarity
In above sections, we have proposed patch similarity based on ILACM, which is possible to search for a patch with maximum patch similarity to estimate the edge and preserves the edge in the background image successfully.
Here, based on patch similarity, we will propose an edge-preserving background estimation model using maximum patch similarity. In the “Patch similarity based on ILACM” section, we have introduced the computation of patch similarity. Consequently, if we want to estimate a patch, we should firstly search the patch Vs with maximum patch similarity in its neighboring patches. Considering the center patch has the highest similarity with itself, a preserving band should be established to exclude its own impact on the estimated results. In addition, the central patch should have a higher level of similarity to the closer patches than remote patches, so the search region does not need to be too large. This search strategy not only ensures a more accurate background estimation model but also reduces computational complexity.
As depicted in Figure 2, the search region G(x, y) is decomposed into multiple small patches, and the red rectangle denotes the center patch V0, whose size is


where i represents the ith image patch in the search region, and Si indicates the patch similarity of the central patch and its ith surrounding patch in the search area.

Search strategy illustration of patch with maximum patch similarity.
Furthermore, if the center pixel

where
Adaptive threshold segmentation using estimated background
In above sections, we have completed the background estimation of the infrared image and obtained the filtered target image. Then, an adaptive threshold, called constant false alarm rate, 13 is introduced to detect the small target, which can suppress the clutters because the threshold value is adaptive to the density of background clutters and produces constant false alarms. The adaptive threshold is obtained as follows

where μfil is average gray value of target image, σfil represents standard deviation of target image, and k is used to control detection rate and false alarm rate. If the gray value is higher than the Adaptive threshold, we think it belongs to target. Otherwise, it belongs to background.
Based on the above analysis, we verify the proposed method using some typical real infrared images, and one example of small target detection results is shown in Figure 3. Image (a) is the original image, image (b) is the edge-preserving background estimation result of our proposed method, image (c) is the target image, and image (d) is the segmentation result with adaptive threshold segmentation, and parameter k is set as 10. The clutters and noise residual are well eliminated in image (d), so our proposed method has achieved purpose on edge protection.

One example of small target detection results. (a) Original image, (b) background image, (c) target image, and (d) segmentation result.
Experiments and analysis
A superior small target detection method can efficiently suppress background clutters and noises. First, we select some typical infrared images. In these images, different edges such as buildings, sea-sky, clouds, and land are sufficient to appraising the edge-preserving ability of different background estimation methods. In experiments, the size of center patch is 3 × 3 and the size of the search area is set as 11 × 11 in the proposed method.
Some detection results are displayed in Figure 4. Four representative small target images (image 1 to image 4) are in the first row, where the small targets submerged in clouds are marked by red rectangle. The 3-D gray value distributions of original images and target image are shown in the second row and the last row, where the targets are labeled by arrows. We can easily find that infrared small targets are completely submerged in complex backgrounds in original images. However, as shown in the last row, the edges and noises are well suppressed by our edge-preserving background estimation model.

Small target detections result in real infrared images using our method. (a1) to (a4) Original small target images (image 1 to image 4). (b1) to (b4) 3-D gray value distributions of (a1) to (a4). (c1) to (c4) 3-D gray value distributions of the target image obtained by using our method. 3-D: three-dimensional.
Then, the effectiveness and practicality of the proposed method are demonstrated by comparing with some of the methods mentioned above. BF, 10 TDLMS, 14 and Bai and Wang’s method 16 are applied to small target images against different complex and noisy backgrounds to do the comparison. As shown in Figure 5, the other four typical infrared images (image 5 to image 8) are added in this experiments. In image 5 and image 8, buildings with little edges exist in their background. In image 6, the land and some zigzagged edges exist in the background. In image 7, the background contains huge mass of clouds. The above eight images include all the edge types of infrared small target image, which can fully validate the detection results of different methods.
Other four original infrared images used in experiments.
In the experiments, we can get target image by eliminating the estimated background image from original image. As well known that the fewer edges contained in target images, the better edge-preserving background estimation results we obtain. The target images of our method and baseline methods are displayed in Figure 6, the first column is target image results of BF, the second column is results of TDLMS method, the third column is results of Bai’s method, and the last column is the results of our method. Obviously, in this visual comparison, the target images of the proposed method contain the least edges.

Target images of our method and other three baseline methods. The first column is target image results of bilateral filter, the second column is results of TDLMS method, the third column is results of Bai’s method, and the last column is the results of our method. TDLMS: two-dimensional least mean square.
Now, we will analyze the edge-preserving ability of the above four methods in detail. Firstly, due to the smoothness of the BF, a large number of edges have been retained in target image besides small targets, so it is not adaptable to small target images with complex backgrounds. Secondly, the edge of the target image obtained by TDLMS is suppressed to some extent, especially the linear edge in the infrared original image. However, its edge-preserving ability is poor when the original image includes zigzagged edges or junction of edges; this is because these edges have similarity with small target in sizes and gray value, so it is very easy to cause false alarm in detecting process. This disadvantage can be avoided by our edge-preserving background estimation model, since we adopt the characteristic of similarity between the edge and its neighborhood rather than the unstable edge direction, which is more adaptable to various edge structures. Therefore, our algorithm have better edge-preserving capability in these areas. Although Bai’s method can preserve some edges well in the background image, but the model is complex and too many parameters need to tuning, it is not suitable for high-resolution images and the real-time detection. Through the above analysis, we can come to the conclusion that our background estimate method preserves the most accurate edges.
Then, in order to further illustrate the superiority of our algorithms in edge protection and target detection, qualitative analysis from three aspects will be adopted between our method and other baseline methods. At first, SCR gain and background suppression factor (BSF) 22 are two important indicators to measure the detection performance of diverse methods, and the SCRgain and BSF are defined as follows


where S is the intensity of target and C is standard deviation. The indicators in and out denote the original image and target image, respectively. SCRgain represents the improvement of SCR value of the original image (SCRin) and the target image (SCRout). BSF represents the amount of background subtraction using small target detection method. Thus, the higher the SCR gain and BSF, the more prominent the target, the less edge clutters, and the better the detection results.
As shown in Figures 7 and 8, the target images which are achieved and used our edge-preserving background estimation method have the highest SCR gain and BSF in the compared methods. The highest SCR gain and BSF imply that least edges left in our target image and our proposed background estimation model can preserve edge efficiently. Therefore, it can be concluded that the edge clutters in the target image are maximum suppression in our proposed method.

SCR gain of target images obtained by different methods. SCR: signal-to-clutter ratio.

BSF of target images obtained by different methods. BSF: background suppression factor.
Another important indicator to demonstrate the effect of methods is receiver operating characteristic (ROC) curve, 7 which is an intuitionistic display of the relationship between the false alarm rate and detection rate in the detection results. The ROC often determined by the clutter in the target image. If the target image contains less clutter, we can get a detection rate under a relatively low false alarm rate. Therefore, the ROC curve of the method will have a high target detection rate and a low false alarm rate only if the edges are preserved effectively in the background image.
From Figure 9, the ROC curves from left to right and top to bottom are obtained from the eight experimental images. We can see that the ROCs based on maximum patch similarity in this article have the maximum target detection and the minimum false alarm rate in each image, which implies the target image of the proposed method including least edge clutters. By the above experiments, the proposed method is able to realize the benefits of accuracy, high efficiency, and practicality of small target detection.

ROC comparison of different methods on experimental images. The ROC curves of (a) to (h) corresponding to image 1 to image 8 mentioned above. ROC: receiver operating characteristic.
Conclusion
In this article, an ILACM is first proposed. Then, we can find a patch with maximum patch similarity to construct the edge-preserving background estimation model. The experimental results show that our proposed method can obtain higher SCR gain, BSF and detection rate, lower false alarm rate, and have better small target detection results than other state-of-the-art methods.
Footnotes
Acknowledgements
The authors would gratefully acknowledge the editors and the anonymous reviewers for their valuable comments.
Declaration of conflicting interests
The author(s) declared no potential conflicts of interest with respect to the research, authorship, and/or publication of this article.
Funding
The author(s) disclosed receipt of the following financial support for the research, authorship, and/or publication of this article: This research was supported by National Advanced Research Project of China under grant no 41415020402 and partially supported by “the Fundamental Research Funds for the Central Universities” 2017KFYXJJ179.