
Abstract
In this study, novel electrodes were prepared via decoration of nanotubed TiO2 (TiNT) films with crystalline two-dimensional (2D) MoS2 species by a one-step hydrothermal synthesis approach. Obtained products were characterized in detail by scanning electron microscopy, Raman spectroscopy, U-I measurements and X-ray diffraction techniques. The influence of hydrothermal synthesis conditions on the composition and morphology of the products formed in the solution and within the TiNT film are also discussed. For the first time, acceptable decoration of TiNT films, by tethering 2D layered MoS2 leaflets onto the TiO2 nanotubes, and on the film surface was obtained in the low concentration solutions, while the performance of these heterostructures in relation to electrochemical hydrogen evolution reaction (HER) was tested. Stable catalytic activity of the obtained 2D MoS2-in-TiNT films was demonstrated under intense HER conditions within the potential window [−0.2 to −0.4 V] vs. RHE with a notably low Tafel slope of 33 mV/decade.
1. Introduction
The unique physical and chemical properties of various TiO2 nanoparticles and nanostructured films have resulted in a wide range of their recent applications in photocatalysis, sensors, solar energy converters, Li+-ions batteries etc. [1, 2] To enhance photocatalytic activity, widen the region of light absorption and increase the photoconversion efficiency, numerous methods have been proposed, including the fabrication of more ordered TiO2 structures [3], anchoring of dye molecules [4], plasmonic species [5, 6], semiconducting nanoparticles [7, 8] and other dopants [9–11]. In spite of great efforts made in this area during the past decade, the fabrication of new heterostructured TiNT films with enhanced and innovative properties still remains an interesting research topic. To the best of our knowledge, the formation and application of nanbotube-shaped TiO2 films, which are heterostructured with transition metal dichalcogenides that have a laminar 2D structure, have not been reported so far. On the other hand, there are numerous reports about the exciting optoelectronic and catalytic properties of single- and few-layered MoS2, MoSe2, WSe2 and TiSe2 [12–22]. The heightened attention on 2D dichalcogenides should be linked with unique physical [12, 13, 15, 20, 23], mechanical [24], optical [18, 19, 25] and chemical [14, 17, 21, 26] properties of single-layered [12, 18, 20, 25], nanoparticular [19, 27], nanotubular [28] or even flower-shaped [21] architectures, which are comparable with graphene. Owing to these properties, 2D MoS2 was successfully applied in high speed photovoltaic devices, Li+-batteries and highly active catalytic systems.
In the form of chemically deposited film, molybdenum disulphide is an indirect gap semiconductor with a band gap (Eg) of 1.17 eV [29]. In contrast, a single-layered MoS2 is a direct gap semiconductor with Eg = 1.8 eV [30] and can replace graphene in the fabrication of low power electronic devices. Superior electrical performance [31] and emerging photoluminescence [25] of nanostructured MoS2 species are usually linked with quantum confinement effects [19]. It is also worth noticing that, in contrast to electronic and optical properties, the catalytic and sensing properties of few-layered freely suspended MoS2 nanosheets are usually better compared with mono-layered films, which result from significantly higher catalytic activity of the 2D MoS2 edges [32]. Therefore, we reasonably expect that novel heterostructures, composed of nanotubed anatase-TiO2 film and two-dimensional (2-D) MoS2 species, may be of interest from the viewpoint of hydrogen evolution reaction (HER) electrocatalysis and other catalytic reactions.
In this study, hydrothermal synthesis approach was successfully applied in terms of direct synthesis of crystalline MoS2 species tethered on the inner and outer titania nanotubes in the aqueous solutions of heptamolybdate and thiourea. As far as we know, this approach has not been reported either for the one-step synthesis of crystalline nanoflower-shaped MoS2 particles or the decoration of TiNT films with tethered MoS2 leaflets onto the TiO2 nanotube walls. We also found that TiNT films decorated with nanostructured MoS2 exhibit good catalytic performance in electrochemical HER.
2. Experimental
2.1 Electrochemical formation of TiNT film
Ti foil of 99.7% purity and 0.127 mm thick, which was purchased from Aldrich, was used to prepare all specimens of the size of 12 ×12 mm2. The surface of samples was ultrasonically cleaned for six minutes each in acetone, ethanol and water, then air dried and anodized in a thermostated glass cell containing ethylene glycol (Etg) with 0.3 wt. % of NH4F and 20 mL L−1 of H2O at 20 ± 1 °C and 50 V using a DC power supply for 20 minutes. Two platinum plates were maintained at a distance of 13 mm from the Ti specimen as cathodes. Every sample was anodized in a fresh solution. After anodizing, the specimens were ultrasonically agitated in ethylene glycol for five seconds to remove the debris from the surface, then thoroughly rinsed with pure water and air-dried. The resulting specimens were calcined in air at 450 °C for 2 h using a 10 °C min−1 ramp and subjected to hydrothermal treatments.
2.2 Hydrothermal synthesis of MoS2 species
For the fabrication of flower-shaped MoS2 species, which possessed crystalline structure and a few layered 2D leaflets in the solution bulk, as well as inside the TiNT film tubes, the hydrothermal synthesis in the thiourea, (NH2)2CS and ammonium heptamolybdate, (NH4)6Mo7O284H2O solutions was carried out. Analytically pure ammonium heptamolybdate was purchased from REAC EM, Slovakia, whereas thiourea was purchased from Sigma. In these investigations, a Teflon-lined autoclave of 20 mL capacity was filled to 60 vol. % with a working solution, while the concentration of both precursors varied from 0.5 to 15 mmol L−1 for (NH4)6Mo7O24 and from 9 to 270 mmol L−1 for thiourea. The cleaned TiNT specimen was immersed vertically into the solution using a special holder made of Teflon. The autoclave was sealed into a stainless steel tank and the reaction was conducted in the Zhermack programmable oven between the 170° and 225 °C temperature range using the 10 °/min ramp. Hydrothermal synthesis lasted from 1 to 20 h, after which the autoclave was cooled to room temperature naturally. After the hydrothermal reaction, as-formed products were carefully rinsed with water and dried. Some specimens were annealed in air or in an oxygen-free atmosphere by means of heating them together with Cu foil in a sealed glass tube at 300 °C for 20 h.
2.3 Characterization tests
The morphology and elemental composition of the products obtained was investigated using a scanning electron microscope (FEI Quatra 200F) and an AURIGA CrossBeam Workstation, equipped with a field emission gun and an EDX spectrometer. Samples were also investigated using the FEI TECNAI F20 electron transmission microscope, equipped with a field emission electron gun. Accelerating voltage was 200 kV. X-ray powder and glancing angle diffraction experiments were performed on a D8 diffract meter (Bruker AXS, Germany), equipped with a Göbel mirror as a primary beam monochromator for CuKα radiations.
Raman spectra were recorded using inVia (Renishaw) spectrometer equipped with a thermoelectrically cooled (−70°C) CCD camera and microscope. The 532 nm beam of the solid-state laser was used as an excitation source. The Raman scattering wave number axis was calibrated using the silicon peak at 520.7 nm. The 50x objective was used during the measurements of TiNT/MoS2 and TiNT samples, while the 20× objective was employed for the analysis of MoS2 in powder form. To avoid damage of the sample, the laser power was restricted to 0.3 mW. Parameters of the bands were determined by fitting the experimental spectra with Gaussian-Lorentzian shape components using GRAMS/A1 8.0 (Thermo Scientific) software.
Electrochemical measurements were performed at an ambient temperature in a three-electrode glass cell connected to the AUTOLAB 302 electrochemical workstation. Prior to the measurements, Ar gas was bubbled through the electrolyte solution for at least 30 minutes to remove the dissolved air. The catalytic performance of the obtained electrodes was studied in a 0.05 mol L−1 of H2SO4 solution by cyclic voltammetry at a scan rate of 5 mV s−1. In these measurements, a Pt wire served as a counter-electrode, while a reversible hydrogen electrode in the working solution (RHE) was used as reference. Photosensitivity regarding TiNT films, decorated with MoS2, was investigated via the determination of the variation of the open circuit potential (Eoc) under illumination. An Xe lamp, with a 6,000 K spectrum and calibrated with silicon diode to obtain 100 mW cm−2 of intensity at the working electrode surface, was used as the light source. These tests were conducted in a three-electrode electrochemical cell supplied with a quartz window, a 0.1 mol L−1 of KOH solution and an RHE reference electrode. All potentials in the text refer to RHE.
Electric resistance of Ti/TiNT and Ti/TiNT-MoS2 films was determined by a two-probe method using tungsten probes controlled by a Summit 11000B-AP manipulator. Measurements were conducted with an analyser of Keithley 4200 semiconducting parameters. The resistance value of each sample was based on an average of five measurements generated in different places of the sample. To test the influence of hydrogen absorption, the sample was kept in an H2 gas atmosphere at an ambient pressure for 1 h.
3. Results and Discussion
3.1 Hydrothermal synthesis of crystalline MoS2 nanoflowers
It has been recently reported that, throughout the hydrothermal treatment of a solution containing 15 mmol L−1 of (NH4)6Mo7O24 + 270 mmol L−1 of thiourea at 180°, “superaerophobic” MoS2 film can be formed on a well-cleaned surface of a pure titanium sheet [33]. Our investigations have indicated that such treatment also leads to the formation of black-coloured powdered species in the solution bulk. According to XRD patterns, while the crystallinity of these species is poor, they increase in terms of the autoclaving temperature (Figure 1A). The main diffraction peaks of the product obtained at 225 °C are seen at 2theta 14.10, 32.89, 33.68, 39.50 and 58.73. According to PDF card no. 01-075-1539, they match well with the (002), (100), (101), (103) and (110) planes attributable to MoS2, whereas a decrease in the synthesis temperature below 220 °C results in a shift of the main diffraction peaks away from their typical positions, pointing to the formation of more non-stoichiometric MoS2. We note that the stoichiometry of these products can be significantly improved by prolonged annealing of these species at 300 °C in air (Figure 2). However, judging from the appearance of the small diffraction peak at 2theta 26.0, the annealing in air resulted in the formation of insignificant content of MoO2, while crystalline MoS2 was not formed by hydrothermal synthesis at 225 °C without subsequent calcination (Figure 1B).

XRD patterns of:
As can be judged from the SEM images, the morphology of the products obtained in the tested solutions, within the autoclaving temperature (Ta) range from 180 to 225 °C, is quite similar, varying mainly in the size of agglomerated flower-type buttons (Figure 1C and D). Note that the increase in the Ta resulted in the formation of slightly larger MoS2 buttons.
To elucidate the nature of the synthesized MoS2 products, their layer-dependent Raman spectra phonon modes were further studied in detail under 532 and 638 nm of light excitation. Figure 2 demonstrates the effect of laser power on the Raman spectra of the products formed at 225 °C for 20 h. As seen, at relatively low laser powers (0.06–0.6 mW), the pair of bands at 408 and 382 cm−1 dominate in the Raman spectrum. Bulk MoS2, excited with a 532 nm laser line, exhibits A1g (408 cm−1) and E12g (383 cm−1) Raman modes, due to out-of-plane vibrations of only S atoms and on opposite vibration of two S atoms with regard to the Mo atom, respectively [34, 35].

Raman spectra of the product produced by autoclaving in the solution as in Figure 1 at 225 °C for 20 h collected at different excitation laser powers. The excitation wavelength was 532 nm. The integration time was 300 s for 0.06 mW of laser power and 100 s for other experiments. Inset: SEM image of the product.
Thus, the observed spectra of this sample evidence the presence of 2-D layered MoS2 having a 1.0 cm−1 lower separation value between the A1g and E12g active modes. It can also be seen that, during excitation involving a higher laser power (3 mW), drastic changes take place in the spectrum, indicating decomposition of MoS2, since the clearly defined peaks at 127, 151, 285, 337, 662, 819 and 993 cm−1 belong to orthorhombic α-MoO3 [36, 37]. To avoid the chemical transformation of MoS2, further experiments were conducted with 0.3 mW of laser power. Figure 3A compares the Raman spectra of three samples, which differ in the synthesis temperature in the spectral region from 120 to 600 cm−1. Besides the dominant A1g (407 cm−1) and E12g (379 cm−1) modes, several low intensity bands are visible near 188, 223, 366 and 453 cm−1. Assignments of these bands are not obvious. The band near 453 cm−1 might be attributed to the second order peak of the mode, LA(M) [38, 39]. A similarly very weak feature was detected previously in the non-resonant (532 nm) Raman spectrum of MoS2 [38, 39]. We assign the band at 223 cm−1 to the first order LA(M) mode. Intensification of this mode in the resonant Raman spectrum (633 nm) was explained as being due to the impact of disorders [38, 39]. The important parameter of the Raman bands, which are sensitive to the disorder in the sample, is the full width at half maximum (FWHM) [39]. In this study, exact parameters of the Raman bands were determined by fitting the experimental spectra with Gaussian-Lorentzian form components (Figure 3B). Table 1 compares the parameters of Raman lines for tested samples.
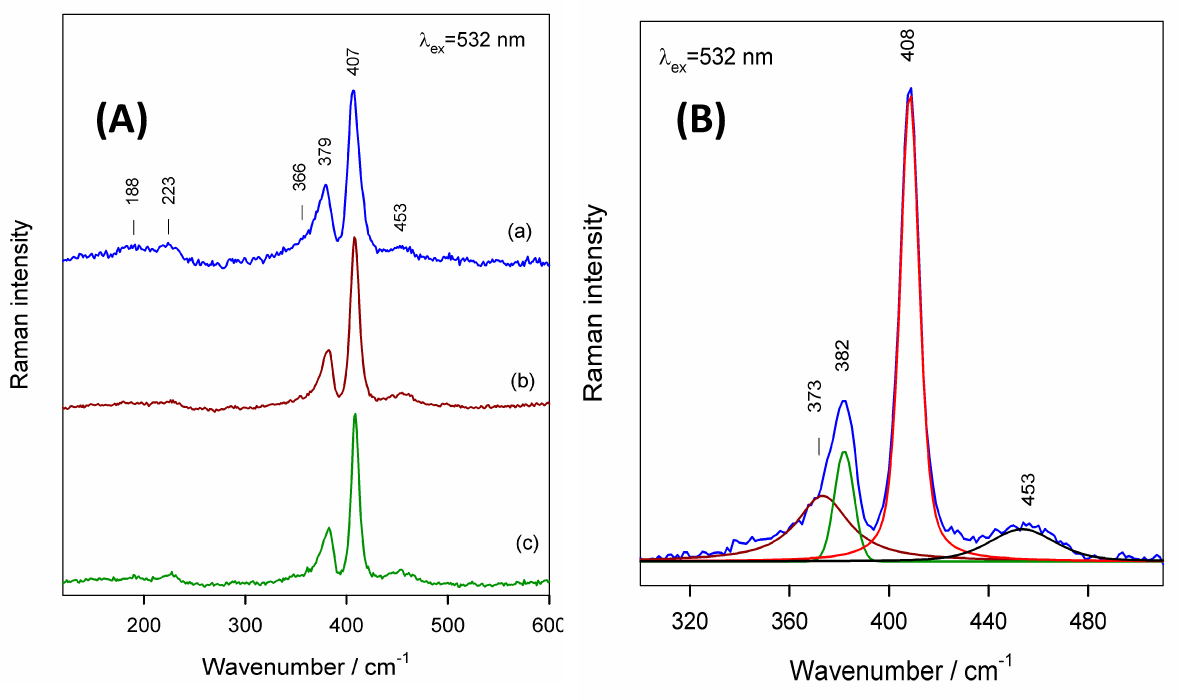
A: Raman spectra of products obtained by autoclaving in an aqueous solution of 15 mmol L−1 of (NH4)6Mo7O24 + 270 mmol L−1 of thiourea at (a) 180°, (b) 210° and (c) 225 °C for 20 h with (a,b) and without (c) subsequent annealing in an oxygen-free atmosphere at 300 °C for 15 h. The excitation wavelength was 532 nm (0.3 mW). B: fitting of a Raman spectrum (c) (see Figure 3A) with Gaussian-Lorentzian form components.
Raman peak positions and FWHM values for E12g and A1g modes of MoS2 species formed by autoclaving at the indicated temperatures

Based on FWHM values, the disorder increases in the following order: synthesis at 180 °C + annealing > synthesis at 210 °C + annealing > synthesis at 225 °C without annealing. These results allowed us to conclude that more ordered MoS2 2-D species can be fabricated directly by autoclaving at higher temperatures.
3.2 Decoration of TiNT films with MoS2
Furthermore, we investigated the possibilities for decorating the surface of a TiNT nanotube film with MoS2 species. In turn, analogous hydrothermal synthesis was carried out by inserting the Ti specimen covered with titania nanotube film, produced by a typical anodizing method [40], into the reaction solution. Figure 4 shows typical SEM images of TiNT films before (A, B) and after hydrothermal treatment in (NH4)6Mo7O24 and thiourea solutions, in which different loadings with MoS2 are illustrated.
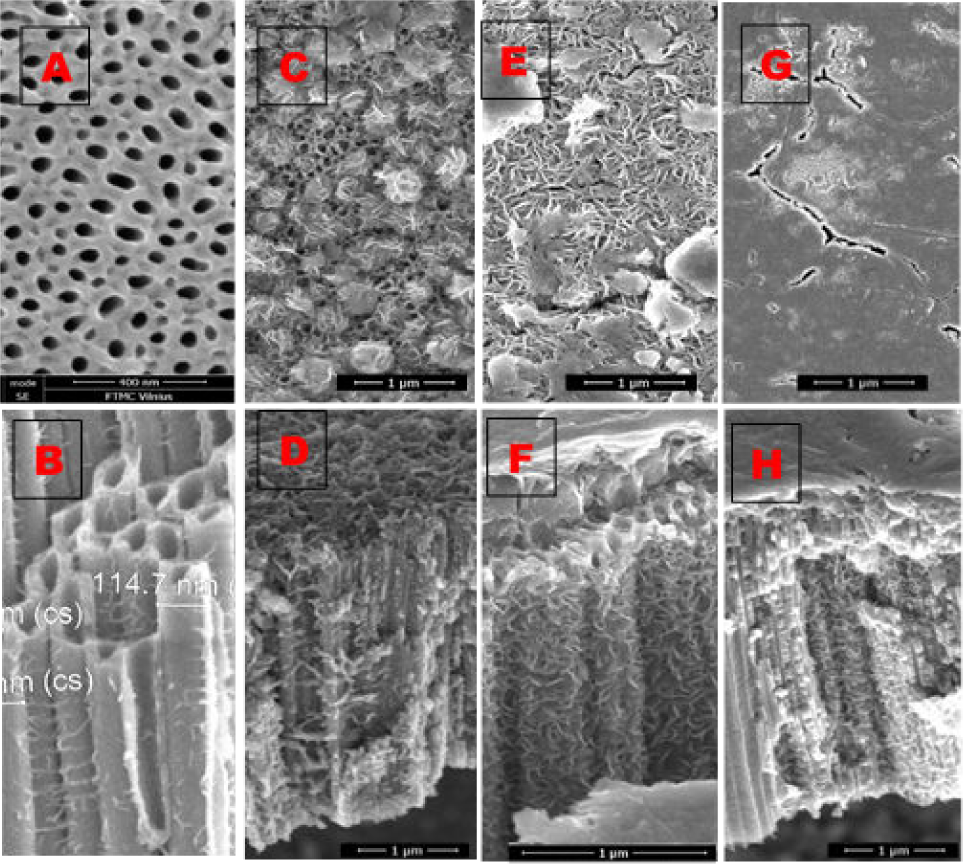
Characteristic FESEM views of TiNT films before (A,B) and after (C-H) hydrothermal treatment at 225 °C for 20 h in solutions containing (NH4)6Mo7O24 + CS(NH2)2 (in mmol L−1): 1.0 + 18.0 (C,D); 3.0 + 54 (E,F); 15.0 + 270 (G,H).
In the case of the most concentrated solution tested herein, namely, the one comprising 15 mmol L−1 of (NH4)6Mo7O24 and 270 mmol L−1 of thiourea, the TiNT film surface was completely covered with MoS2. Moreover, it also seems likely that some nanotubes at the surface side were clogged (not shown herein). In contrast, a nice decoration of titania tubes with nanoplatelet species, having an abundance of exposed edges, was obtained in the diluted solutions that were composed of only 1 to 3 mmol L−1 of (NH4)6Mo7O24 and 18 to 54 mmol L−1 of thiourea, with all other conditions being the same (Figure 4C-F). It is noteworthy that uniform covering of nanotubes along their whole length was only obtained in the diluted solutions (Figure 4F), which points to the affinity between the fabricated nanoplate-lets and the titania surface. At the same time, significantly smaller and less agglomerated spherical particles, resembling cabbages composed of numerous leaves with exposed edges, were fabricated in the solution bulk. It was also found that the average size of 2-D platelet species can be controlled by varying the solution concentration. In the case of 3.0 mmol L−1 of heptamolybdate and 54.0 mmol L−1 of thiourea, the autoclaving at 225 °C for 20 h yielded tethered nanoplate-lets with an average length of less than 100 nm and slight nanometre thickness at their edges. Note that a quite similar decoration of the titania nanotubes and surface was formed at 180 °C (Figure 5A, B) and 200 °C (Figure 5C, D). Besides, the cabbage-shaped MoS2 species formed in the solution bulk at 180 °C, 200 °C 220 °C are quite similar (Figure 5E, F and inset in Figure 6B).
3.3 Raman view
Typical Raman spectra of bare TiNT film used in this study and the products obtained by hydrothermal treatment at 225 °C in the bulk of diluted solutions, as well as those tethered to TiO2 nanotubes, are shown in Figure 5.

Cross-sectional (A,C) and top side (B,D) SEM images of MoS2 nanoplatelet species formed on the TiNT film (A-D) and the solution bulk (E,F) by hydrothermal treatment in 3.0 mmol L−1 of (NH4)6Mo7O24 and 54 mmol L−1 of CS(NH2)2 solution at 180 °C (A,B,E) and 200 °C (C,D,F) for 20 h

(A): Raman spectra of TiNT film before (b) and after (a) hydrothermal treatment in a solution containing 3.0 mmol L−1 of (NH4)6Mo7O24 + 54 mmol L−1 of CS(NH2)2 at 220 for 20 h. (B): Raman spectrum of MoS2 cabbages formed in the solution bulk. The excitation wavelength is 532 nm (0.3 mW). Insets: illustration of the morphology of the tested products.
According to numerous reports, the bands at 147, 396, 517 and 637 cm−1 of pure TiNT film are characteristic of a crystalline anatase TiO2 structure [18], whereas the intense peak near 407 cm−1, observed for TiO2/MoS2 hybrid material, can be immediately assigned to the A1g mode of the MoS2 compound [34, 35]. Other bands that are characteristic of MoS2 are located at 382 (E12g), 455 (second order mode of the longitudinal acoustic phonon mode, LA(M)) [38, 39] and 227 cm−1 (first order La(M) mode). Note that these bands are clearly visible in the spectrum of MoS2 cabbages synthesized in the solution under the same conditions. Again, the low intensity peak around 147 cm−1 of the TiNT/MoS2 specimen belongs to the most intense band of anatase-TiO2. It was determined that relative intensity of this band increases in the spectrum of TiNT films, which are hydrothermally treated in the lesser concentrated solutions.
To ascertain the possible disordering of MoS2 structure upon being tethered to the nanotubed anatase-TiO2 film surface, the analysis of the FWHM of the 407 cm−1 band was performed. The experimental spectral contour was fitted by mixed Gaussian-Lorentzian form components. Thus, it was found that the FWHM value increases from 9.0 to 10.7 in the spectra of MoS2 in powder form and MoS2 deposited on the TiO2 substrate, respectively. This indicates an increase in the disordering of the MoS2/TiO2 structure [18], although an increase in FWHM might also be associated with a decrease in the size of MoS2 crystallites embedded in the TiNT matrix.
3.4 Resistance measurements
To the best of our knowledge, variation in the electrical resistance of TiNT films upon decoration with semiconducting species has not been reported to date. However, voltage-current (U-I) plots of Ti/TiNT and Ti/TiNT-MoS2 specimens, fabricated under the conditions of this study, revealed large differences between these two samples (Figure 6).
In particular, the resistance of crystalline TiNT film, which approximated to 38 GΩ, decreased down to ∼ 14 kΩ, i.e., by six orders of magnitude, after decoration with MoS2 nanoplatelet species. Furthermore, the resistance of the same heterostructured specimen after treatment in an H2 atmosphere decreased down to several kΩ. These results led us to the conclusion that, under conditions of hydrogen evolution reaction (HER) in aqueous solutions, the resistance of the Ti/TiNT-MoS2 heterostructure should attain the level of tens of ohms, thus providing the basis for its application as efficient photo- and electrocatalyst due to the large surface size and chemical stability.
3.5 Voltammetric measurements
The photosensitivity of Ti electrodes covered with nanotubed anatase-TiO2 film and heterostructured with MoS2 2-D species was investigated in the solution of 0.1 mol L−1 of KOH via determination of the variation of the open-circuit potential (Eoc) under simulated solar light illumination. The results obtained for TiNT film, before and after MoS2 loading, are shown in Figure 7A. One can see that both pure TiNT and TiNT decorated with MoS2 species demonstrate typical behaviour regarding n-type semiconductors.

Typical variations in the current strength of bare TiNT film (1) and TiNT film decorated with MoS2 by hydrothermal treatment (2)
In the case of calcined TiNT film, Eoc values under illumination and in the dark lie within the range of TiO2, according to the Pourbaix diagram [42], while the magnitude of ΔEoc between the values in dark and light is about 250 mV. The magnitudes of Eoc and ΔEoc of the TiNT-MoS2 heterostructured electrodes depend significantly on the content of MoS2 deposited on the TiNT film surface. In the case of complete coverage with bulk MoS2, which is characteristic for concentrated solutions, electrodes became non-photosensitive, whereas moderate decoration of film with MoS2 species resulted in the increase of the Eoc value seen during the illumination period.
Cyclic voltammetry (CV) was also applied in an acidic solution of 0.5 mol L−1 of H2SO4 to investigate the catalytic performance of bare and MoS2-decorated TiNT films. For comparison, a Pt electrode was also tested. As seen (Figure 7B, curve 1), the capability of the Ti electrode, covered with nanotube-shaped anatase-TiO2 film of ∼ 4.1 μm thickness with an average tube diameter of ∼ 110 nm, to generate hydrogen gas is very poor, even at −0.5 V vs. RHE. The performance of the same Ti/TiNT electrode, decorated with MoS2, in the electrocatalytic generation of hydrogen was found to be strongly dependent on the concentration of heptamolybdate/thiourea solution used for the hydrothermal treatment of TiNT film, with all other conditions being the same (see plots 2 to 4 in Figure 7B). It is worth noting that the performance of Ti/TiTN/MoS2 electrodes, decorated in the concentrated solution (curve 4), remained quite low and similar to that of bare TiNT film. However, Ti/TiNT electrodes, which underwent hydrothermal treatment in the solution containing only 1.0 to 3.0 mmol L−1 of ammonium heptamolybdate and 18 to 54 mmol L−1 of thiourea at 220–225 °C, exhibited a nice catalytic performance in terms of hydrogen evolution reaction. The stability of the catalytic performance of Ti/TiNT-MoS2 electrodes was further investigated in the 0.1 mol L−1 of H2SO4 solution by potential cycling within 0.04 V to −0.4 V at a potential sweep rate of 10 mV s−1. Typical voltammograms for Ti/TiNT and Ti/TiNT heterostructured with nanoplatelet MoS2 species are shown in Figure 8. As can be seen, the shape of the E–I plot, with characteristic hysteresis in the region of low voltages, remained unchanged, but only during the first 50 potential cycles (plots 1 and 2). Surprisingly, the intensity of HER increased with further cycling (up to 500 cycles), resulting in current densities that were twice as high as those for the first cycles.

(A) Variation of the open-circuit potential of Ti/TiNT electrode upon illumination in 0.1 mol L−1 of NaOH solution before (1) and after (2–4) decoration with MoS2 nanoplatelet species by hydrothermal treatment in the solutions containing (NH4)6Mo7O24 + CS(NH2)2 (in mmol L−1): (2) 1 + 18, (3) 3 + 54 and (4) 15 + 270 at 225 °C for 20 h. (B): Cyclic voltammograms for Pt and the same electrodes as in (A) in a deaerated 0.5 mol L−1 of H2SO4 solution with corresponding Tafel plots. Potential scan rate 5 mV s−1.

Cyclic voltammograms of Ti/TiNT and Ti/TiNT-MoS2 (1–6) electrodes in the deaerated solution of 0.1 mol L−1 of H2SO4 run at the potential seep rate of 10 mV s−1. The corresponding cycle number is indicated in the figure.
The calculated Tafel slopes for HER taking place at the Ti/TiNT-MoS2 electrode are given in Table 2. In general, the onset potential of HER was about −120 mV and the reaction proceeded with quite small and stable Tafel slopes, ranging from 32 to 37 mV per decade during prolonged exploitation. Note that the Tafel slope of HER taking place on the Pt electrode under the same conditions was 30 mV per decade.
Tafel slopes of HER, calculated from experimental E-i plots within −0.2 V to −0.4 V for indicated electrodes and the specified potential cycle

4. Conclusions
In summary, we present a facile and efficient strategy for the decoration of TiNT films with crystalline nanoflowered and nanoplatelet MoS2 species using the modified one-step hydrothermal method. By using this strategy, TiNT films heterostructured with nanoplatelet MoS2 species, densely packed along the whole nanotube length, were formed at 210°–225 °C in the solutions containing only 0.5 to 3.0 mmol L-1 of ammonium heptamolybdate and 9 to 54 mmol L−1 of thiourea. The use of diluted solutions prevents clogging of the tubes and complete blocking of the TiNT film surface. It is shown that MoS2-decorated Ti/TiNT films demonstrate good electrocatalytic activity in hydrogen evolution reaction, which take place in an acidic solution during prolonged exploitation involving Tafel slopes of 32–37 mV per decade. It is also demonstrated that the decoration of titania nanotubes with nanoplatelet MoS2 species results in a significant decrease in electric resistance of this heterostructure by six orders of magnitude.
Footnotes
5. Acknowledgements
We appreciate the input of Dr. V. Pakštas for the XRD spectra collection and Dr. V. Bukauskas for the U-I tests. This study was carried out as part of the VP1-3.1-ŠMM-08-K-01-009 project, which is partly supported by the National Programme entitled “An improvement in the skills of researchers”, launched by the Lithuanian Ministry of Education and Science.