
Abstract
In this work, we produced nickel oxide nanostructures that show high electrochemical capacitive behaviour, using fungus – one of the most common life forms in nature. Cladosporium cladosporioides fungi are particularly attractive biotemplates due to their tubular structures. The nanostructured porous microtubes were prepared by chemical precipitation onto fungi. The morphological properties of the biosynthesized NiO microtubes were studied by transmission electron microscope (TEM). The Brunauer–Emmett–Teller (BET) surface area was found to be 119.72 m2 g−1 with an average pore size distribution of 7.5 nm. A maximum capacitance value of 334 F g−1 was observed at 0.8 A g−1, and a capacitance retention of approximately 95% was obtained after 1000 cycles.
1. Introduction
Supercapacitors are currently considered promising energy storage systems. Supercapacitors store energy in the electric field generated at the interface between a metal electrode and an electrolyte. Supercapacitors have unique properties as compared to batteries, such as fast charge and discharge rates, high power density and long cycle life. Many carbon materials are and have been used as supercapacitor electrode materials, including graphene oxide, activated nanoporous carbon, carbon aerogel, carbon nanosheets, carbon nanotubes [1], and metal oxide materials (e.g., RuO2, MnO2, NiO, Co3O4, Fe3O4, V2O5, In2O3, and Bi2O3 [2]) as well as metal calconites (e.g., Ni3S2 and MoS2 [3,4]). Among the various available supercapacitor materials, NiO has attracted attention because of its theoretical capacitance value of 3228 F g−1 [5] and its cost-effectivity compared to other materials.
Recently, scientists have reported a new approach for designing metallic nanomaterials, which will give rise to important areas of research in biomedicine and energy storage systems. In biomedicine, these materials can be used for drug delivery, diagnostics, imaging, and sensing. Biological structures, such as bacteria and bacterial cell surfaces, actinomycetes, plants, yeast, algae, viruses and fungi act as templates for the synthesis of nanostructures with strong electrochemical performance, particularly for potential applications in batteries and supercapacitors [6-11]. The advantages of using biotemplates are that they are low-cost, environmentally benign and renewable.
As reported by Leitão et al. and Fomina et al. [12,13], fungal cell walls can act as cation exchangers due to their negative charge, which originates from the presence of different functional groups (e.g., carboxylic, phosphate, amine or sulfhydryl) in different wall components (hemicelluloses, pectin, lignin, etc.). Fungal cells have walls that mainly contain chitin, some protists that contain cellulose and some mannoproteins. These polymers make rich sources of metal binding ligands. Most fungi grow as hyphae, which are cylindrical, thread-like structures 2–10 μm in diameter and up to several centimetres in length. The tubular structure of fungi results in high tolerance towards metals, high wall-binding capacity and intracellular metal uptake capabilities compared to bacterial strains [14]. In this work, we have produced electrode materials showing high electrochemical capacitive behaviour using Cladosporium cladosporioides fungi. To the best of our knowledge, this is the first time these microtubular NiO nanostructures have been obtained using fungi.
2. Experimental Report
Nanostructured nickel oxide porous microtubes were prepared by chemical precipitation onto fungi. First, C. cladosporioides fungus was grown in 250 mL Erlenmeyer flasks containing 50 mL of potato dextrose broth (PDB) at 28°C on a rotary shaker at 150 rpm for 72 hours. After incubation, mycelial biomass was separated from the culture broth by centrifugation at 9000 rpm and 4°C for 15 minutes. Mycelia were washed twice with sterile distilled water to remove traces of media components. The crude cell filtrate was collected for subsequent experimentation.
Next, 200 ml of 200 mM NiCl2 solution was added to a cell suspension of C. cladosporioides at 10 ml min−1 using a burette. After shaking the mixture for 30 minutes, 100 ml of 25 mM NH4OH solution, used as a reducing agent, was added to the mixture at 10 ml min−1. The mixture was stored at room temperature under continuous shaking at 150 rpm in darkness for 72 hours. This step was followed by centrifugation and collection of the precipitate. The Ni(OH)2/fungus precipitate was washed thoroughly with deionized water twice, followed by ethanol. The formed Ni(OH)2 tubes precipitate was dried for 12 hours in an oven at 60°C. Next, the precipitate was heated from room temperature to 360°C in air at a rate of 1°C/min−1 where it was maintained for 12 hours, followed by cooling to room temperature at a rate of 10°C/min−1. Following this, the Ni foam was degreased with acetone, etched with 3 M HCl for 10 minutes, and washed thoroughly with deionized water and acetone, followed again by deionized water. Subsequently, the nanostructured NiO microtubes (75%), acetylene black (20%) and PTFE (5%) were ground and mixed in a Zr2O3 mortar for 45 minutes. Then, 5.6 mg of this mixed material was placed on a Ni foam sheet and compressed at a pressure of 10 MPa for 10 minutes. The Ni foam-supported material was used as the working electrode, with a platinum plate counter electrode and Ag/AgCl (with ceramic frit, ALS, and saturated KCl) as the reference electrode. The electrolyte was 6 M KOH.
Thermogravimetric analysis (TGA) measurements were performed in air by heating the samples from room temperature to 800°C with a ramp rate of 10°C/min−1 using a Shimadzu TGA-50 thermogravimetric analyser. The crystal structure and orientation were determined by a Rigaku-RADB X-ray diffractometer (XRD) equipped with CuKα radiation. The cyclic voltammetry (CV) measurements and galvanostatic charge-discharge tests were performed using a Gamry Reference 3000 potentiostat/galvanostat/ZRA.
The electrochemical impedance spectroscopy (EIS) tests were conducted with a frequency loop from 300 kHz to 10 mHz with a 5 mV AC oscillation amplitude under an open-circuit potential.
Optical densities of pure fungus cultures and coated fungus were measured by a UV-Visible spectrophotometer (SHIMADZU, UV-1601). The morphology of the NiO microtubes was characterized by transmission electron microscopy (TEM; FEI Tecnai G2 F30). Nitrogen adsorption was performed at 77.3 K by means of a Micromeritics Gemini VII 2390t. The surface area was calculated using the BET equation. The pore size distribution was determined by the Barrett-Joyner-Halenda (BJH) method.
3. Results and Discussion
TGA and differential thermal analysis (DTA) curves of pure fungi and metal-coated fungi in the range of 25°C-800°C are shown in Fig. 1. The steady weight loss from room temperature to 120°C in the TGA data shows the initial loss of moisture. Subsequent steady weight loss from 120°C to 290°C can be attributed to the continual expulsion of water and ethanol from the sample. Subsequent steady weight loss in the temperature range of 290°C-800°C can be attributed to fungal degradation. The TGA curve for metal-coated fungi shows that there is steady weight loss from 290°C to 335°C with a gradual loss of ∼24.67%. The exothermic nature of the DTA curve along with the steady weight loss in the TGA curve suggests that Ni(OH)2 gradually decomposes in this temperature range. The TGA curve for metal-coated fungi also illustrates that gradual decomposition of Ni(OH)2 and degradation of the fungi occurred simultaneously in the temperature range of 290°C-525°C with a gradual weight loss of ∼37.43%. Above 525°C, the curve shows no further weight loss, indicating that approximately 62.57% of the inorganic matter, most of which is likely metal oxide, remained at 525°C. The weight fraction of NiO in the metal-precipitated sample may be below 62.57% because of the intrinsic inorganic components of pure fungi, e.g., C, N, P, S, etc. The TGA results of the fungi C. cladosporioides indicate that the amounts of the residues were 37.34% and 24.71% at 360°C and 525°C, respectively. Thus, we can infer that fungi still exist in the structure of the produced material at 360°C.

TGA /DTA measurements of pure fungi and coated fungi
Fig. 2a shows the XRD profile for the precipitated and then annealed NiO powder. The peaks observed at 2θ= 37.2°, 43.2°, 62.8°, 75.4° and 79.30° can be indexed as the (111), (200), (220), (311) and (222) reflections of the cubic NiO structure with the lattice constant, a=4.1717 Å respectively, which correspond well with the standard crystallographic data for fcc NiO (PDF CARD NO. 65-5745). When C. cladosporioides is used as a biological template, before the annealing process, the precipitated structure consists of only pure Ni(OH)2 peaks (Fig. 2b). After the annealing process, the obtained structure is cubic NiO. Because the fungi are amorphous, no diffraction peaks assigned to the fungi were observed in the pattern of the samples (Fig. 2c). When two annealed samples are compared, the XRD pattern of the sample obtained using fungi shows relatively broad peaks, indicating the smaller size of the NiO nanocrystals [15]. Mean crystallite size is calculated to be ∼9.9 nm for pure NiO and ∼5.6 nm for the NiO-coated fungi.

XRD patterns of a) NiO powder b) Ni(OH)2 c) nanostructured tubular NiO
Fig. 3a and Fig. 3b-d represent transmission electron microscopy images of the bare C. cladosporioides and NiO nanoparticles attached directly to the template, respectively. The bare C. cladosporioides have a diameter of approximately 500 nm but the NiO microtubes have a diameter of approximately 3 μm and a length 25 μm. Additionally, the external surfaces of the microtubes have a nanoporous structure. Fig. 3e shows the corresponding selected area electron diffraction (SAED) pattern. The SAED pattern indicates a nanoscale polycrystalline structure. The observed SAED rings can be assigned to the (111), (200), (220), (311), (222), (400), (420) diffractions of face-centred cubic NiO, which agree well with the XRD results. The high-resolution transmission electron microscopy (HRTEM) image of NiO shows that lattice spacings are 0.21 nm and 0.24 nm, which correspond to the (200) and (111) crystal planes, respectively (Fig. 3f).

TEM images of a) pure Cladosporium cladosporioides fungi, b-d) nanostructured NiO sample, e) HRTEM image and f) SAED pattern of NiO sample
The metal ion precipitation onto the fungi was also confirmed using UV-Vis spectroscopic analysis. The characteristics of the surface plasmon absorption bands are known to be related to the diameter and aspect ratio of metal nanoparticles [16]. The UV–Vis spectra of the fungi, NiCl2, Ni(OH)2-coated fungi and NiO-coated fungi were recorded in the wavelength range of 200–800 nm in Fig. 4. When the sample was analysed, the maximum absorbance was observed at 271 nm for the as-received fungi, which is attributed to the presence of a protein template (cell wall proteins and glycoproteins of fungi). Fungi possess abundant functional groups on their cell walls, which provide suitable binding sites of metals on fungi. The absorption peaks at approximately 394 nm and 715 nm were also observed for the NiCl2 solution. These peaks notably disappeared after incorporation of the fungal solution. After the annealing process, the absorption peaks assigned to the fungi were not observed due to fungal degradation.
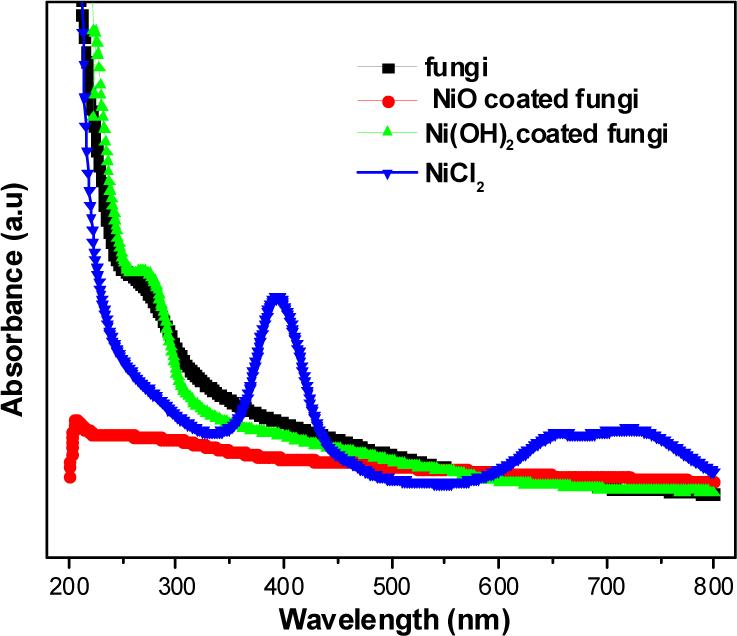
UV-Vis spectra of various aqueous media
The porosity of the annealed NiO microtubes was characterized using nitrogen gas adsorption, as shown in Fig. 5. The NiO sample exhibits a typical type-IV isotherm of mesoporous samples. Calculations based on the isotherm give a BET surface area of ∼119.72 m2 g−1 and an average pore volume of ∼0.146 cm3 g−1. The nitrogen adsorption isotherm and pore size distribution measurements indicate that the sample has a porous structure mainly comprising mesopores with diameters ranging between 2 nm and 18 nm. The material has a broad pore size distribution with an average pore diameter of approximately 7.5 nm, which was calculated by the BJH method.

BET isotherm of nanostructured NiO microtubes. Inset shows BJH pore size distribution of NiO nanostructures.
The electrochemical characteristics of the NiO electrode were studied using cyclic voltammetry, with 6.0 M KOH as the electrolyte, over the voltage range of 0–0.5 V (vs. Ag/AgCl) at various potential scan rates between 5 and 100 mV s−1, as shown in Fig. 6. The CV curves indicate that the electrochemical capacitance of the NiO electrode mainly results from the pseudo-capacitance, which is based on the redox mechanism. Additionally, the redox current increases with increasing scan rate, which suggests good reversibility of the fast charge–discharge response. The specific capacitance was calculated from the CV curves using the following equation [15]:

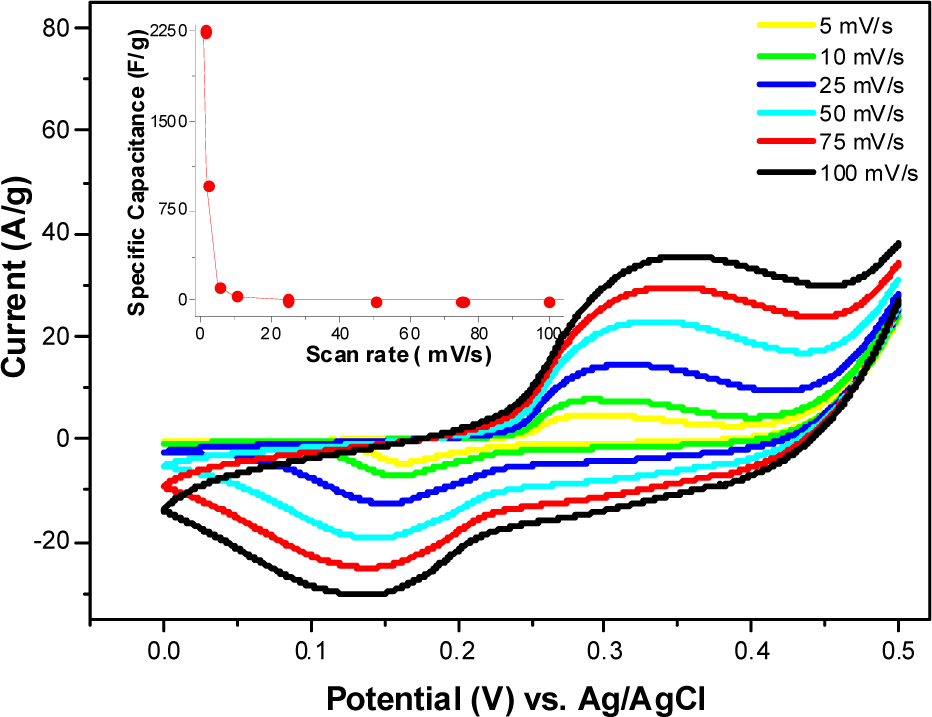
CV curves of NiO electrode at different scan rates
where I is the current, s is the scan rate, ΔV is the potential window and m is the mass of the active material. The maximum specific capacitance was observed to be 2250 F g−1 at 1 mV s−1 (as shown in the inset of Fig. 6). When the scan rate is increased to 5 mV s−1, the specific capacitance of the NiO porous electrode is 117 F g−1. It was found that the specific capacitance value decreases with increasing scan rate, which is attributed to limited ion movement at high scan rates. The calculated maximum specific energy density and power density are 112.5 Wh/kg and 3375 W/kg, respectively.
The charge-discharge profiles of the NiO electrode at a current of 0.8A g−1 are displayed in the inset of Fig. 7. The long-term galvanostatic cycling stability of the NiO electrode was investigated over 5000 cycles. The specific capacitance values were also calculated from the galvanostatic discharge cycles using the following formula:

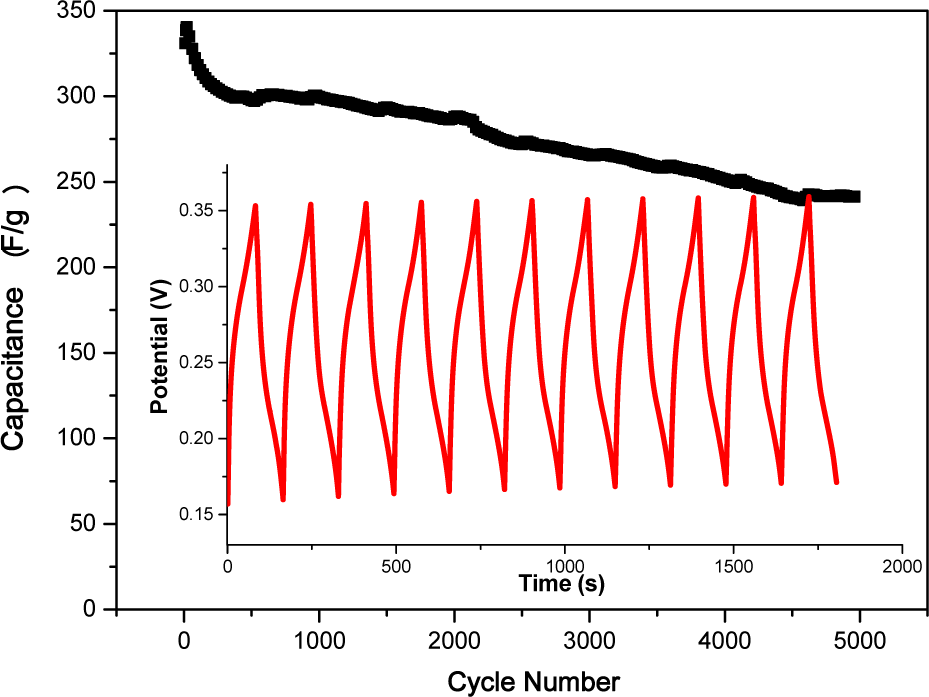
Variation of specific capacitance as a function of cycle number of NiO electrode. The inset shows the first eleven cyclic charge-discharge curves.
where Cs is the specific discharge capacitance, I is the discharge current, Δt is the discharge time, ΔV is the potential drop in the discharge progress and m is the active mass of the electrode. The initial capacitance value of the NiO electrode was 313 F g−1, which increased gradually during the first 80 cycles. Then, the system reached a maximum value of 334 F g−1, after which the capacitance value gradually decreased. After 5000 continuous charge/discharge cycles, a minimum capacitance value of 241 F g−1 was obtained. The charge-discharge efficiency was 95% and 77% for the nanostructured NiO electrode after 1000 and 5000 cycles, respectively. The obtained specific capacitance value was comparable to that of previous reports [5, 17-19].
Fig. 8 shows the Nyquist plots of AC impedance of the NiO electrodes at an open circuit potential. After 1000 continuous cycles, the obvious decrease of charge transfer resistance in the middle frequency range and the 67° slope of the straight line in the low frequency range indicate good electrochemical behaviour of the NiO porous electrode.
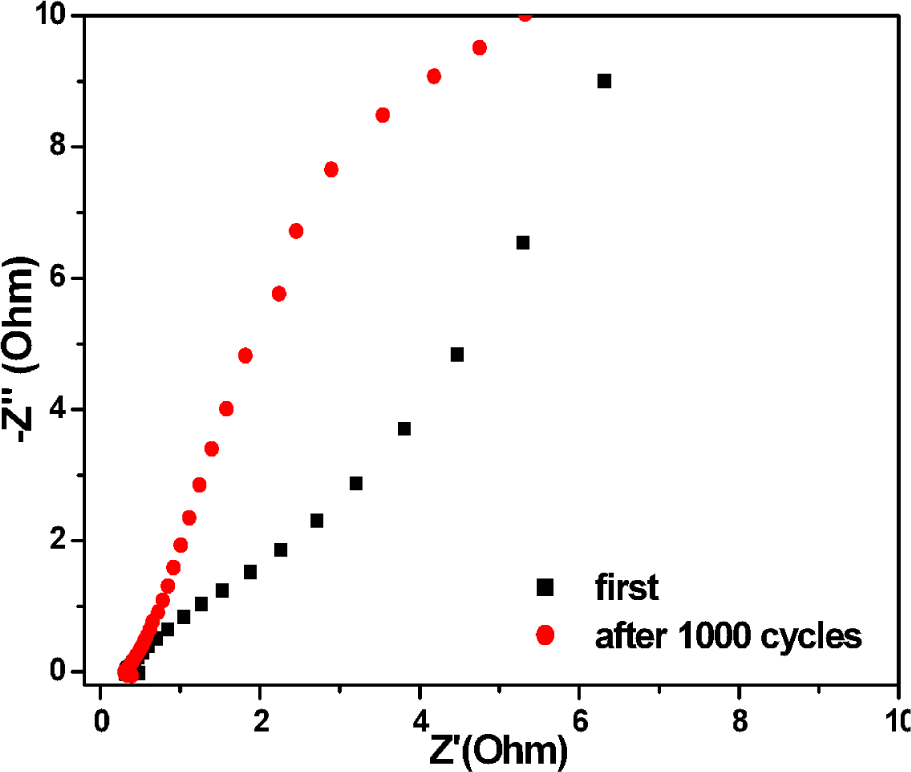
Nyquist plots of NiO electrode at open circuit potential in 6 M KOH solution
4. Conclusions
NiO microtubes were synthesized using C. cladosporioides fungi as a biotemplate. It has been observed that nanoparticles attached directly to the fungal surface lead to tubular structures, which are mechanically stable even after the annealing process. It has also been determined that the obtained porous electrode with high surface area exhibits pseudo-capacitive properties with high capacitance, long cycle life and good coulombic efficiency. The fungal structures appear to be extremely good candidates for the synthesis of nickel oxide nanoparticles as a supercapacitor electrode material.
Footnotes
5. Acknowledgements
This work was supported by TUBITAK under the project number MAG-113M335 and Inonu University under the project number I.U.A.F-2014/25.