
Abstract
Perovskite bimetallic oxides as electrode material blends can be an appropriate method to enhance the supercapacitor properties. In the present research, SrO 0.5:MnO 0.5 nanostructures (NS) were synthesized by a facile co-precipitation method and calcinated at 750–800°C. Crystal structure of SrO 0.5:MnO 0.5 NS were characterized by X-ray diffraction, surface chemical composition and chemical bond analysis, and dispersion of SrO into MnO was confirmed by X-ray photoelectron spectral studies. Structural morphology was analyzed from scanning electron microscopy. Optical properties of SrO 0.5:MnO 0.5 NS were studied using UV-Visible spectrophotometer and SrO 0.5 and MnO 0.5 NS showed ∼75 nm grain, ∼ 64 nm grain boundary distance, with two maxima at 261 nm and 345 nm as intensity of absorption patterns, respectively. The synthesized SrO 0.5:MnO 0.5 NS exhibited high specific capacitance of 392.8 F/g at a current density of 0.1 A/g. Electrochemical impedance spectroscopy results indicated low resistance and very low time constant of 0.2 s ∼73% of the capacitance was retained after 1000 galvanostatic charge-discharge (GCD) cycles. These findings indicate that SrO 0.5:MnO 0.5 bimetallic oxide material could be a promising electrode material for electrochemical energy storage systems.
Introduction
In recent years, transition metal oxide nanomaterials like TiO2, MnO2, V2O5 and SrO. have attracted research interest as electrode materials due to their stability, tunable material properties and higher energy storage densities than traditional carbon-based electrodes. 1 Different forms of manganese oxides have been vastly researched for its role as electrode material in sensors, batteries and electrolysis, owing to its catalytically active surfaces.2–4 The wide spread applications of MnO2 nanomaterial for energy storage and conversion is due to its theoretical capacity (∼300 mA/g), low cost, low toxicity and abundance. 5 MnO2 possesses polymorphisms and exists in various morphologies due to edge sharing or corner sharing of MnO6 octahedral units. Consequently, the properties of MnO2 are also strongly dependent on morphology, crystal structure and particle size. 6 However, electrodes prepared using single metal oxides (MO) have shown poor cyclical stability and low conductivity. 7 Hence, synthesis of binary metal oxides and metal oxide composites has gained attraction for their use in energy storage systems.8-11 Recently, Sr-based bimetal oxides (Srx My Oz) where M is any metal (for example SrTiO3, Fe: Sr (OH)2) has been demonstrated for diversified physical properties and excellent material for supercapacitor electrode.12,13 Recently, SrTiO3 nanoparticles (NPs) with cubic structure synthesized by using sol-gel technique demonstrated high specific capacitance of 212.5 F/g, cyclic retention of 74.5% and excellent cyclic stability (99%, 5000 cycles). 14 Sr-doped LaMnO3/MnO2 (LSM) composites reported to have positive effect on the MnO3 electrodes. 15 SrBiO3 nanostructures (NS) in aqueous electrolyte (6 M KOH) reported exhibiting a specific capacitance of 810.93 F/g. 16 Porous structure of the bimetallic combination of MnO2 with Zn materials synthesized by microwave irradiation presents high specific capacitance of 215 F/g. 17
In this context, we synthesize stable bimetallic oxide, SrO 0.5:MnO 0.5 NS, as electrode material for energy storage applications by facile co-precipitation method using surfactants and reducing agents. The materials were characterized using scanning electron microscopy (SEM), X-ray diffractometer (XRD), X-ray photoelectron spectroscopy (XPS) and UV-Visible spectroscopy. Electrochemical analysis was studied by cyclic voltammetry (CV), galvanostatic charge-discharge cycles (GCD) and electrochemical impedance spectroscopy (EIS) in three electrode setup. High capacitance of 392.8 F/g was observed for synthesized SrO 0.5:MnO 0.5 NS, which suggests potential applicability of SrO 0.5:MnO 0.5 as electrode materials for supercapacitors.
Materials and methods
All the chemicals and reagents purchased from Sigma Aldrich, Alfa Assar and Super capacitor ltd and used without any further purification. Crystallinity and doping of the SrO to MnO have been identified by X-ray diffractometer instrument made by Rigaku MiniFlex 600 with power of 600 W, tube voltage of 40 kV with 600 W X-ray tube, D/teX Ultra silicon strip detector accepting unusual samples having power requirement of 1Ø, 100–240 V 50/60 Hz. Chemical compositional analysis, chemical and electronic states of the bimetallic oxides and exact doping of the bimetallic oxides were measured by using XPS having auger electron spectroscopy instrument with PHI 5000 versa probe II, with Ar ion as well as C60 sputter Guns. Versa Probe chemical state maps are created by scanning the X-ray beam pixel by pixel over the defined area. The dimensions of the mapped area, pixel density and spot size are user adjustable. UV-visible spectroscopy was performed by using instrument by Analytik Jena (An Endress and Hauser Company). Optical properties were recorded using SPECORD 210 PLUS Analytik Jena with variable spectral resolution and cooled double beam detection was incorporated for UV-Visible absorption spectrum. Morphology, grain size distribution and size of the nanoparticles were investigated by using instrument by Nova Nano SEM (5.0 mm AWD with 35° cut off angle) equipped with 5 X to 1,000,000 X HR/UHR mode, high sensitivity, low kV directional backscattered detector and fitted with quadrant semiconductor diode.
Synthesis of SrO 0.5:MnO 0.5 nanostructures
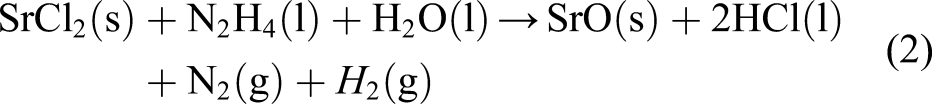
In order to synthesize the nanostructures of SrO 0.5:MnO 0.5 bimetallic oxides, Mn (SO)4.6H2O (0.5 M wt. ratio) was dissolved in deionized water and stirred for ∼3 h, with addition of TEA (triethanol amine) (1 mL) and CTAB (cetyl trimethyl ammonium bromide) (200 mg). A brown precipitate of MnO was obtained (Reaction (1)) upon adding NH4OH solution drop wise, which was transferred to another round bottom flask containing SrCl2.6H2O (0.5 M wt. ratio) dissolved in 20 mL of deionised water and N2H4 (2 mL) which was stirred for 5 h at 80°C. The reaction mixture (RM) was maintained at pH ∼11 (alkaline) warmed in a water bath at temperature of 80°C with continuous magnetic stirring for 2 h. The RM was cooled subsequently the precipitated (brown coloured) SrO 0.5:MnO 0.5 NS were filtered, washed with cold water and ethanol was used to remove surface bound impurities, and then the RM was dried at 100–200°C, calcinated at 700–800°C and grounded as fine powder. Schematic illustration of the preparation is shown in Figure 1. Schematic illustration of the synthesis of SrO 0.5:MnO 0.5 NS.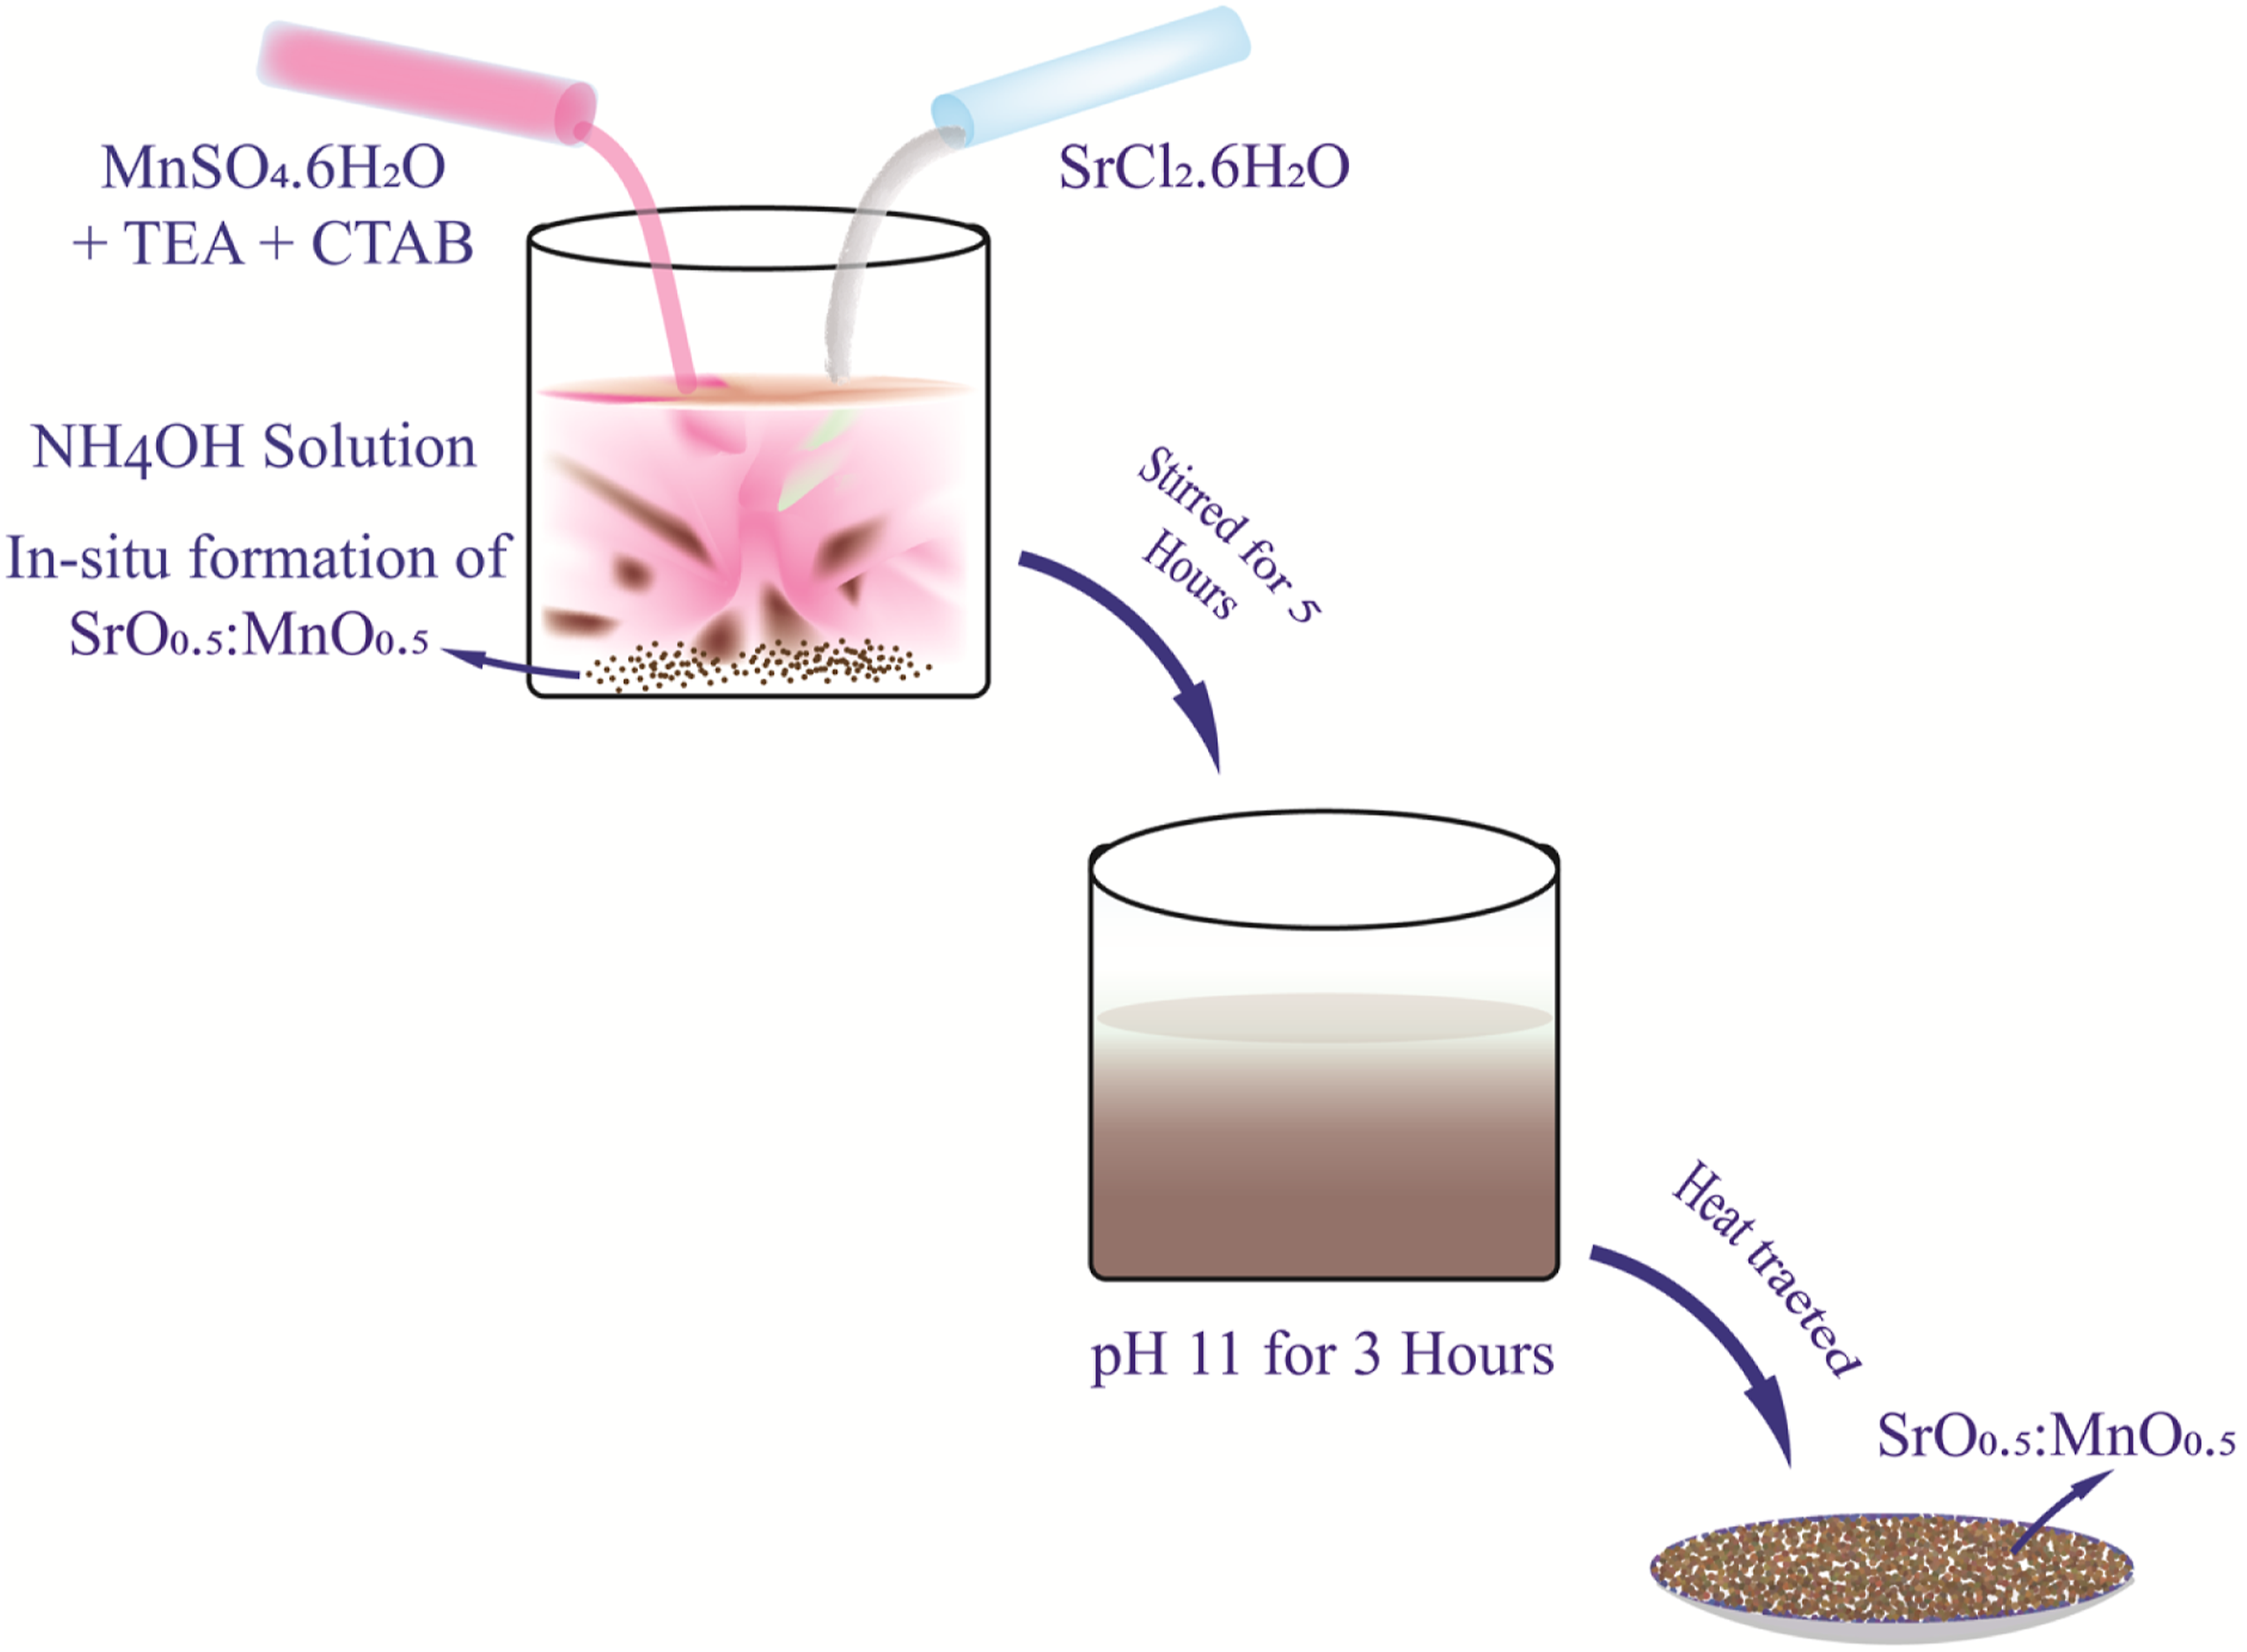
Reactions

Electrochemical studies
All the electrochemical studies of the synthesized SrO 0.5:MnO 0.5 were assessed using AUTOLAB M204 (The Netherlands) in three electrode setups. The working electrode was prepared by mixing 90 wt. % of the active material (SrO 0.5: MnO 0.5), 5 wt. % black carbon and 5 wt. % polyvinylidene fluoride (PVDF) in N-methyl-2-pyrrolidone (NMP) as solvent, followed by drying on a Ni foam current collector (1 × 1 cm2 area) at 100°C overnight. The mass loading of the prepared electrode was ∼7 mg. A Pt rod and saturated calomel electrode (SCE) were used as counter and reference electrodes, respectively, using 6.0 M KOH solution as the electrolyte. Cyclic voltammetric (CV) tests were done at potential range of −1 V to 0 at different scan rates (10, 25, 50, 75 and 100 mV/s). Galvanostatic charge-discharge (GCD) tests were done at the same potential window at different current densities (0.15, 0.25, 0.5, 0.75, 1.0 and 2.0 A/g). Specific capacitance (CS) of the electrode from GCD curves were calculated by equation (3) reported in earlier works.18,19


Results and discussion
Optical behaviour
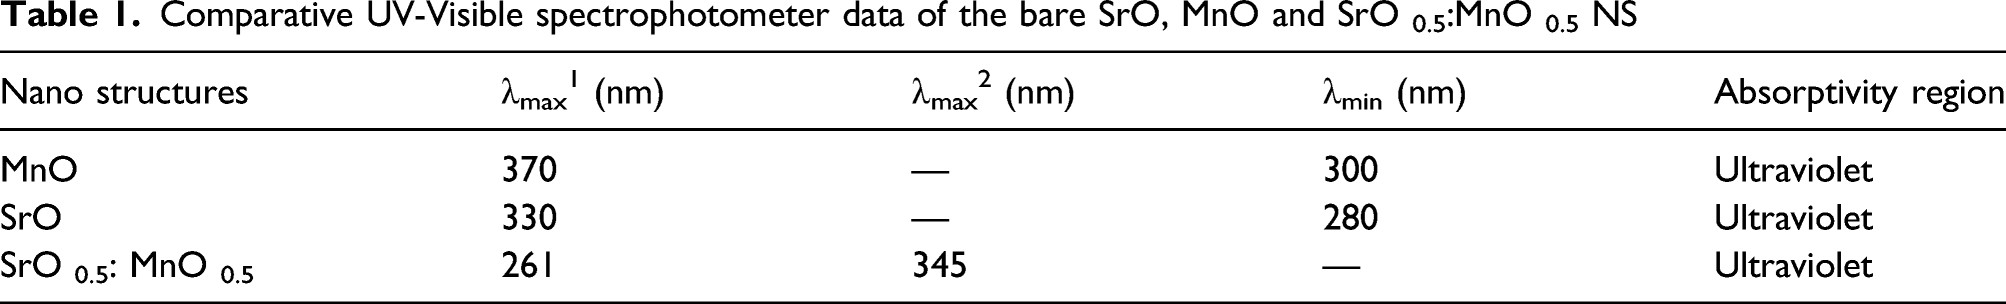
The bimetallic oxides of SrO 0.5:MnO 0.5 NPs recorded with UV-Visible spectra (optical absorption) were in powdered form in order to investigate NPs optical behaviour (absorptivity, band gap and NPs interaction with photons). SrO 0.5: MnO 0.5 NPs exhibited absorptivity from near to far UV when exposed to the radiation source of 100 nm–1000 nm. UV-Visible spectrum of SrO 0.5: MnO 0.5 NPs showed absorptivity at two different regions in the UV-Visible spectrum having sharp absorption wavelength of 261 nm and 345 nm, respectively, (maxima 1 and maxima 2, respectively) as shown in the Figure 2 and this was attributed to the presence of SrO and MnO NPs. Maximum and minimum absorptivity region of the bare SrO NPs and MnO NPs are summarized in Table 1. Recent studies on the SrBi2B2O7 nanocrystals coated over glass substrate revealed sharp optical absorptivity ranging from 400–500 nm (UV–Visible region). Nanomaterials of Sr-doped SnO2 exhibited absorption edge of 350 nm and 370 nm, respectively, and Sr+2 ions incorporated into SnO2 NS provided additional energy levels between the conduction and valence band. Increase in the Sr+2 impurity decreases the band gap of SrO/SnO2 NS.21,22 The red shift in the absorptivity at two different regions in the UV-Visible spectrum is due to the presence of bimetallic oxide of Sr and Mn densely agglomerated into the crystal structure. The NPs of SrO 0.5:MnO 0.5 possesses interaction with near UV and far UV energized photons indicating the increased optical activity and absorption of photons of lower wavelength (higher energy). No intense peaks were observed in the visible region of the spectrum. However, optical absorptivity of the SrO quantum dots shows sharp edge at 203 nm confirming the presence of indirect band gap (6.1 eV) and also reported that SrO quantum dots are defect-free in nature.
23
Absorptive wavelengths and band gap of SrO 0.5:MnO 0.5 NPs were calculated using the formula hγ = A (hγ - Eg)2, where, A is the absorptivity constant, γ the frequency of the source radiation and Eg is the optical gap of nanomaterials. UV-Visible spectra of SrO 0.5:MnO 0.5 NPs recorded as powder sample. Comparative UV-Visible spectrophotometer data of the bare SrO, MnO and SrO 0.5:MnO 0.5 NS
Elemental compositional analysis of SrO 0.5:MnO 0.5 NPs
Elemental compositional analysis of bare SrO, MnO and SrO: MnO NS.

Crystallinity
Crystallinity of the SrO 0.5: MnO 0.5 NPs was examined by XRD analysis8,24 with radiation from Cu-K alpha at λ = 1.5406 Å. X-Ray diffraction patterns were recorded over a range of 2θ from 20 to 90° (Figure 3). Peaks observed around 29.97°, 31.8°, 32.8°, 33.6°, 38.38° and 40.0° can be attributed to MnO diffraction peaks of (222), (201), (201), (111), (211) planes which have grater similarity to JCPDS file number 04-0326 corresponding to Mn3O4 with lattice constants a = 0.576 and b = 0.976. Diffraction peaks centred at 43.52°, 45.7°. 47.78°, 48.76°, 49.75°, 50.5° and 58.28° corresponds to planes (011), (112), (112), (201), (011), (221) of SrO. The obtained 2θ values matche well with the JCPDS file number 00-006-0520 for SrO.xH2O as well as JCPDS file number of 00-019-1276 of SrCO3. However, NPs of Mn3O4 with tetragonal crystal structure reported dramatic change in the decomposition behaviour under the reaction conditions.
11
Change in the reaction temperature results in the variation of MnO NPs size. The conversion of hexagonal square and cross-shaped MnO NPs mixed with Mn3O4 and XRD lattice patterns confirms (Figure 3) the retention of size and shape of the NPs under applied conditions.25,26 By using the Scherrer equation (6) X-ray powder diffraction patterns of SrO 0.5: MnO 0.5 nanostructures.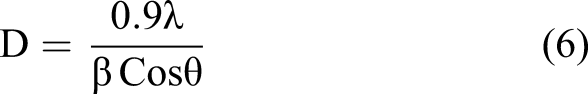

where λ is the wavelength of the X-ray radiation (1.5418 Å) and β is the full width at half maximum (FWHM) of the peak at diffracted angle θ, a total of 14 diffraction peaks of the NPs were obtained, and the crystal nature that has been estimated from the intense peak of SrO 0.5:MnO 0.5 with (011), (111), (201), (112) diffraction planes and average crystallinity were found to be 55 nm. The XRD reflection peaks of SrO (011), (112), (112), (201), (011), (221) and MnO (222), (201) (201), (111), (211) confirms core shell configuration of synthesized NPs which indicates the orthorhombic crystal structure (agglomerated). These observations confirm that flake kind of NPs of SrO:MnO NPs as shown in Figure 4. Comparison of the XRD patterns, crystal structure of the SrO:MnO NPs are summarized in the Table 2. SrO NPs reported in earlier works suggest trigonal crystal structure and the tetragonal crystal shape for MnO NPs.27,28 Furthermore, MnO NPs when dispersed onto graphene nanosheets (GNs), MnO NPs were found to act as nanoscale spacers increasing the spacing between adjacent C-atoms in the hybrid NS
29
which was confirmed by the shift in the diffraction peaks and formation of crystalline MnO NPs over outer surface of GNs. TiO2 when, loaded with SrO NPs exhibited same crystal size and shape during the anodization process.
30
Crystallographic structure of the SrO-decorated graphene oxide (GO) NS showed monoclinic structure with the absence of impurities like Sr2O or SrO (OH)2.
31
Whereas, binary composites of SrO/PANI crystallographic morphology indicates well incorporation of SrO nanorods
32
with JCPDS for SrO file No 01-075-0263. The authors demonstrated in the present work, flake-like structure of NPs with particle agglomeration and orthorhombic structure of the synthesized SrO:MnO NPs. Table 3 summarizes the corresponding planes, peak values, ratio and the reflection peaks. Data obtained from XRD patterns suggest that complete dispersion of SrO and MnO into the orthorhombic crystal phase and the orthorhombic crystal sample produce sharp diffraction peaks with the plane orientation of intense peaks of (111), (201) corresponds to MnO and (011), (112) peaks for SrO, respectively. Scanning electron microscopy images of the SrO 0.5; MnO 0.5 (top view) of NPs recorded at different distances (a) at 2 µm (b) 10 µm (c) 4 µm (d) 20 µm. XRD spectral diffraction patterns of SrO 0.5:MnO 0.5 NS
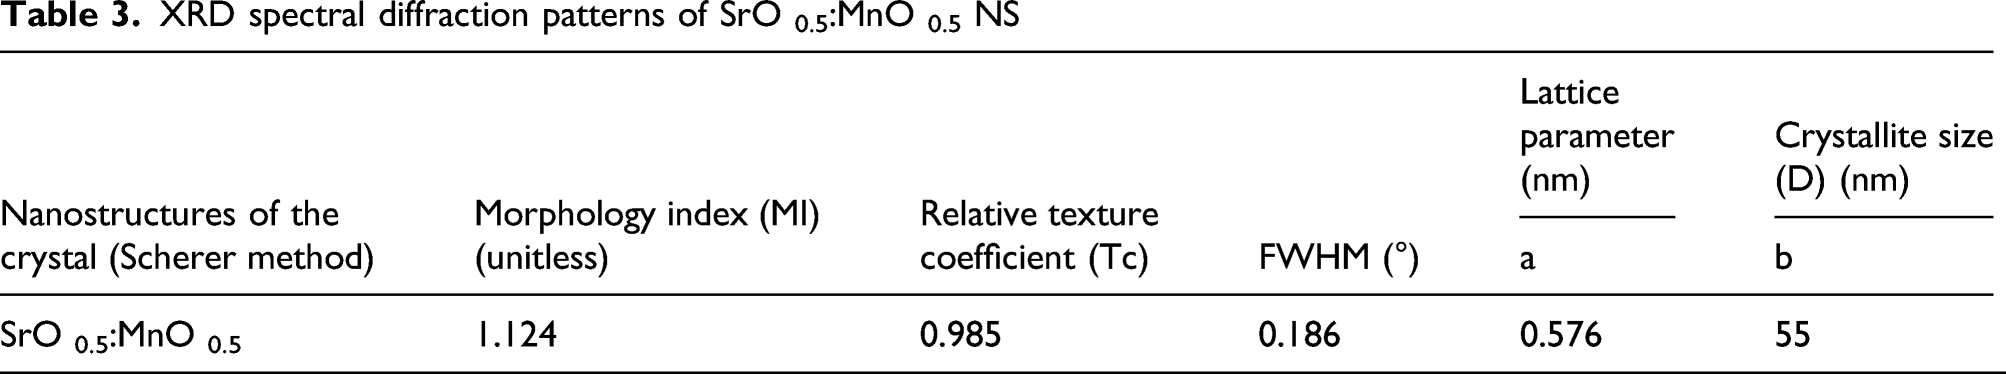
The XRD patterns also indicate the dispersion of SrO into MnO-layered solid successfully with no additional peaks. Unit cell volume, Sr-Mn bond distance, length, bond energy, u parameters, SrO:MnO crystal size (D) were calculated by Debye–Scherer’s formula. D = Kλ/βcosθ, where K is dimensionless shape factor, λ X-ray wavelength, β full width half maximum intensity (FWHM) and θ is Braggs angle. The decrease in the interplanar distance was observed which is due to decrease in the unit cell volume as a result of the introduction of SrO into the MnO nanostrctures.31,32
Morphological characterization
Scanning electron microscopy
Surface morphology of the synthesized SrO 0.5:MnO 0.5 NPs has been investigated by SEM techniques. SEM images of SrO 0.5:MnO 0.5 NS with different magnifications as shown in the Figure 4(a)–(d). The corresponding energy dispersive xrays (EDX) image with selected area and compositional spectrum presented in Figure 5. A vertically grown flake-like morphology of SrO and MnO NPs can be seen with proper orientation and distribution. The high density of NPs of SrO 0.5:MnO 0.5 having size of ∼75 nm, grain diameter of ∼80 nm, distance of ∼95 nm and ∼30 µm in length were observed. Morphology and distribution of the SrMnO3 NPs depend on different preparation approaches such as co-precipitation, hydrothermal and microwave irradiation. In most of the cases, NS does not form recognisable structure with agglomeration. Further, crystal structure of Sr and Mn containing La composites (La0.7Sr0.3Mn0.65Fe0.3 5O3) exhibited rhombohedral structure.33,34 Nanocrystals of La 0.7Sr0.3MnO3 showed homogeneous dispersion of Sr and MnO3 NPs.
35
SEM micrographs and cross-sectional micrographs of Ba 0.5Sr0.5Zn2Si2O7 studied under different conditions of heat treatment which are observed with several backscattered cracks in the crystal structure.
36
SEM images of ultrathin MnO2 coated graphene oxide NS improves electrochemical performance by occupying the porous network and homogeneous dispersion over the graphene oxide (GO) nanosheets.
37
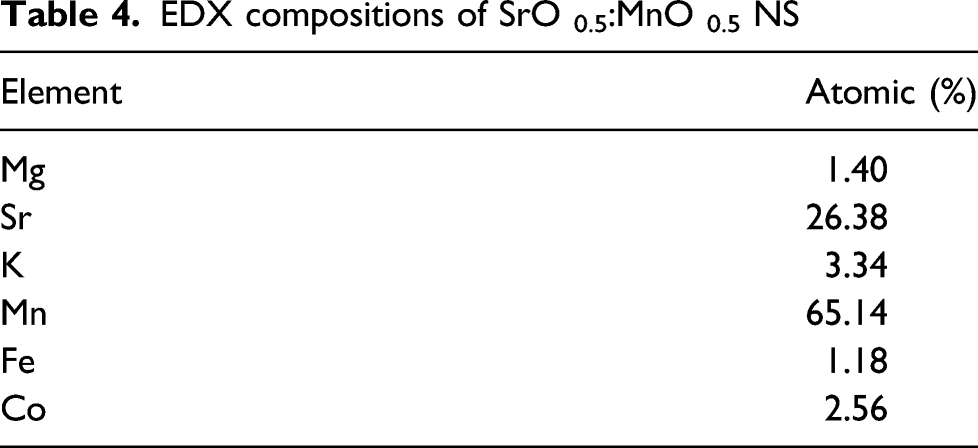
Pure SrO reported in the literature with average grain size of ∼65 nm, grain boundary distance varies from ∼40 nm to ∼80 nm and grain distance of ∼55 nm–∼75 nm whereas, MnO NPs has grain diameter of ∼60 nm, particle size varies in between ∼45 nm to ∼70 nm. Overall, from top view of the SEM images it can be concluded that orthorhombic SrO:MnO structure forms with more agglomeration of the NPs in the nanomatrix. EDX composition (atomic weight ratio and net ratio) of different metal oxides present in the NS is summarized in Table 4. (a) Scanning electron microscopy selected area to analyse the composition of SrO 0.5: MnO 0.5 NPs (b) SEM EDX compositional analysis with Sr 0.5 and Mn 0.5 nanoparticles. EDX compositions of SrO 0.5:MnO 0.5 NS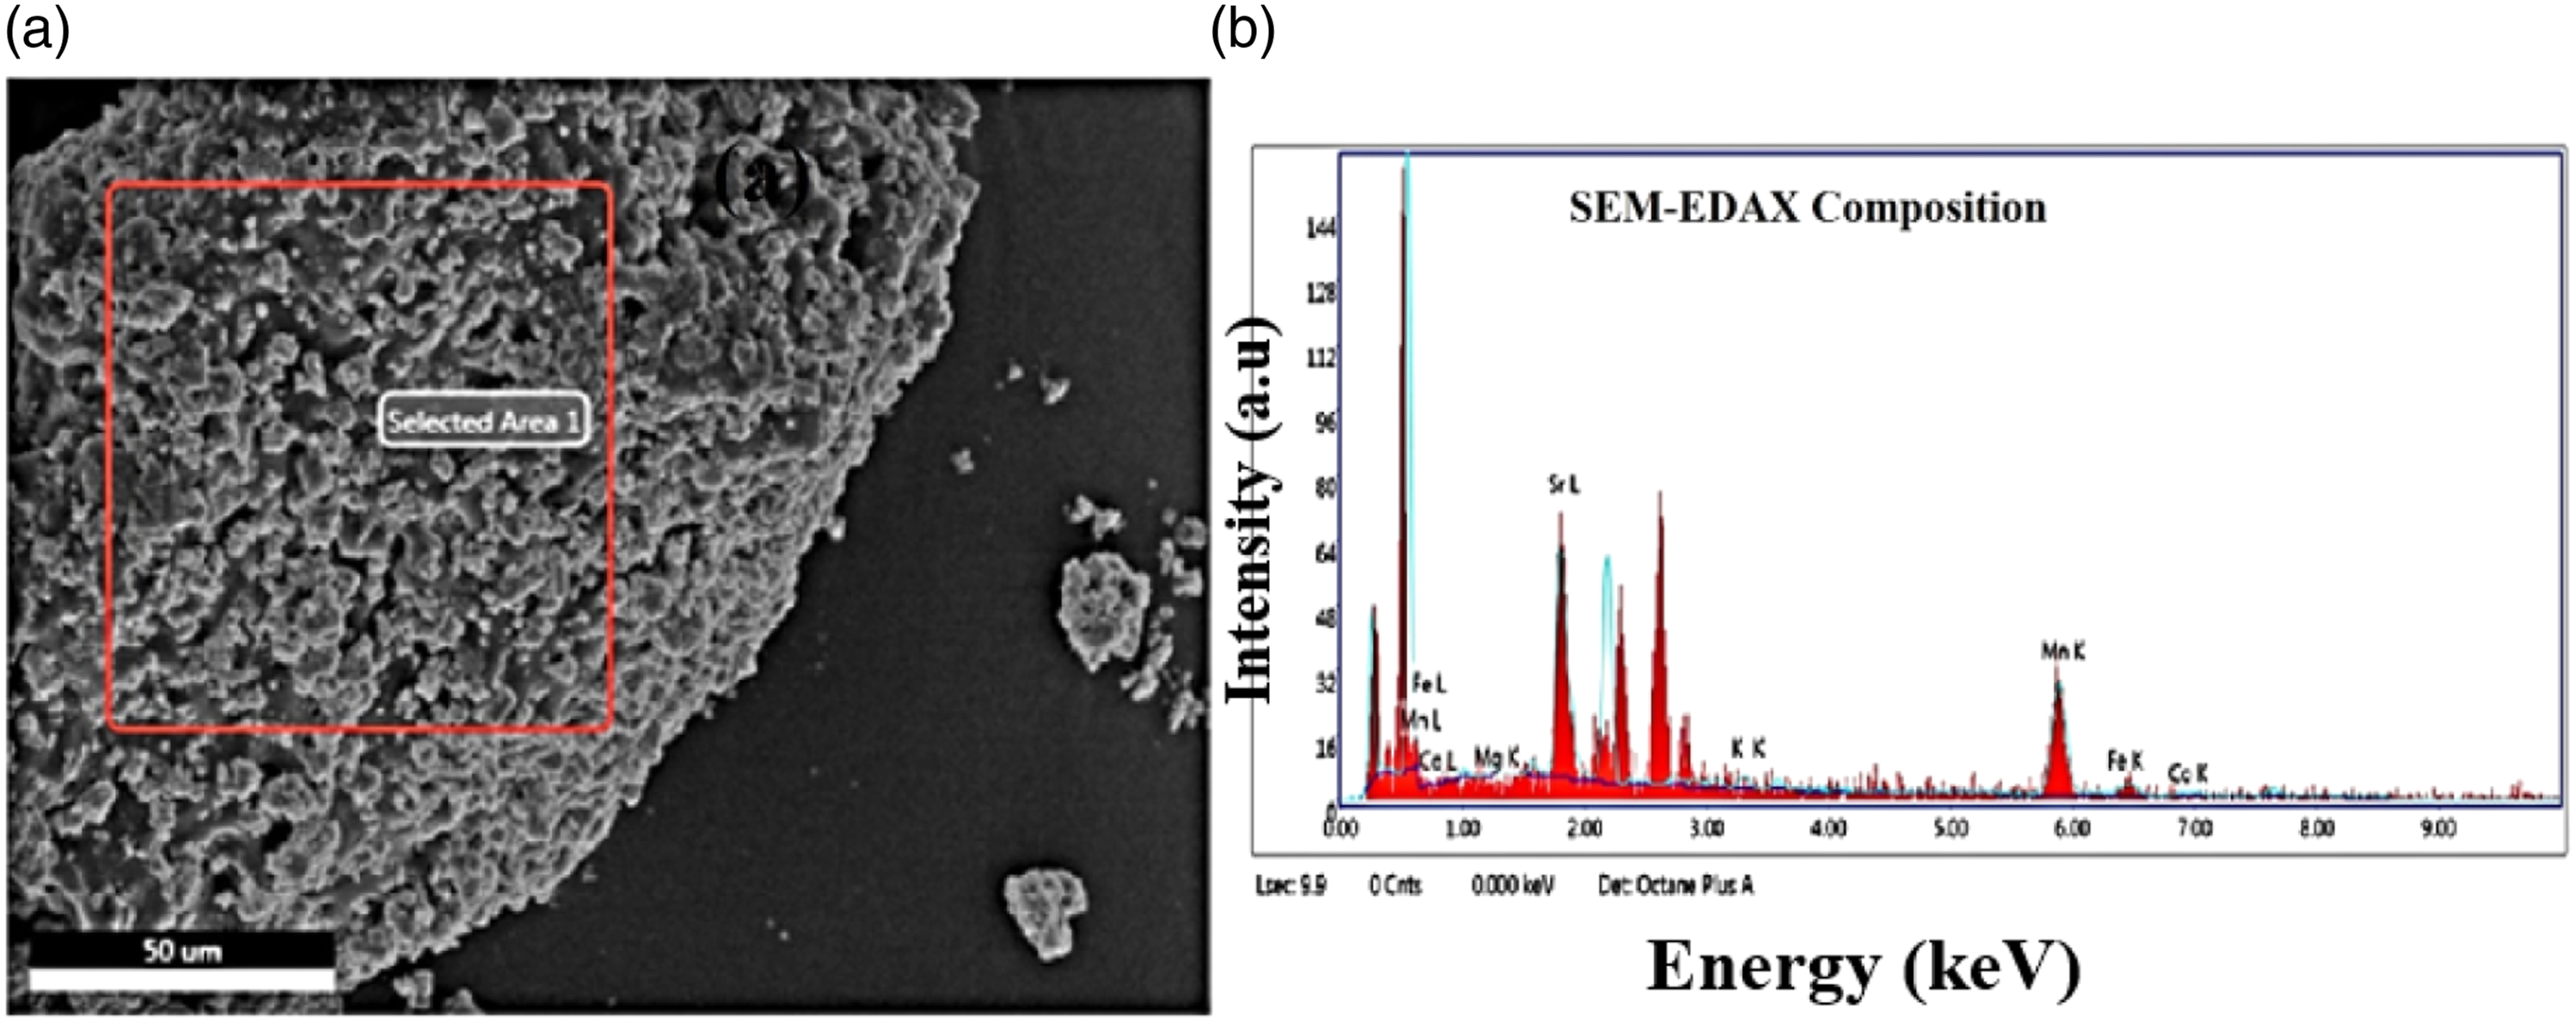
Cross section morphologies of SrO 0.5:MnO 0.5 NPs
Typical SEM backscatter images of samples are shown in Figure 6. Images in Figure 6(a) (20 µm), Figure 6(b) (4 µm), Figure 6(c) (10 µm) and Figure 6(d) (20 µm) clearly show nanoflake-like structures with thickness varying from ∼30 nm to 80 nm. Cross-sectional images also depicted the width and thickness of NPs. The magnified SEM cross-sectional images of SrO 0.5:MnO 0.5 showed particle distribution between ∼30 nm to ∼75 nm as observed in Supplemental Figure S2 and S3, respectively and EDX composition of SrO: MnO NPs is summarized in Supplemental Table S1, S2 and S3 and their spectrum shown in Supplemental Figure S5, S6 and S7, respectively. The magnified images showed highly entangled SrO 0.5:MnO 0.5 NPs as shown in Figure 6. The NPs of SrO 0.5:MnO 0.5 SEM images show nanoflake-like compact deposited on the surface as shown in Figure 6. Each nanoflake connected with each other neighbouring flakes having ∼110 nm in diameter with ∼30–40 nm thickness.
38
High agglomeration of the dispersed NPs observed for hydroxyapatite on surface of SiO2-P2O5-CaO-SrO-ZnO as compared with other apatite and dispersed phase was spherical in nature.
38
The cross-sectional SEM images also exhibited nanoflakes dominantly coated over the particle surface, the compositional table comprising K ratio, Z, A, F values of SrO and MnO NS as depicted in Table 4 also comprises the EDAX compositional analysis of the SrO 0.5:MnO 0.5 nanostructures. The EDAX composition of top view of the SrO 0.5:MnO 0.5 nanostructures analysed with different areas as shown in Figure 5(a) and (b) and Supplemental Figure S3 respectively (supplementary). Studies related to the insertion of MnO NPs inside porous C-nanotubes (CNT) observed under low amplification in which MnO NPs occupied in the void space of CNT networks, separated NPs of MnO having diameter of 15–25 nm and they get expanded during charge and discharge cycles.
39
The assimilation of NPs of SrO 0.5:MnO 0.5 on a coated surface is due to reaction inside the particles and is limited to the small cavity among NS with interplanar distance of 0.251 nm. Cross sectional scanning electron microscopy images of low- and high-resolution flake like SrO 0.5: MnO 0.5 nanostructures recorded at different distances (a) 20 µm (b) 4 µm (c) 10 µm and (d) 20 µm respectively.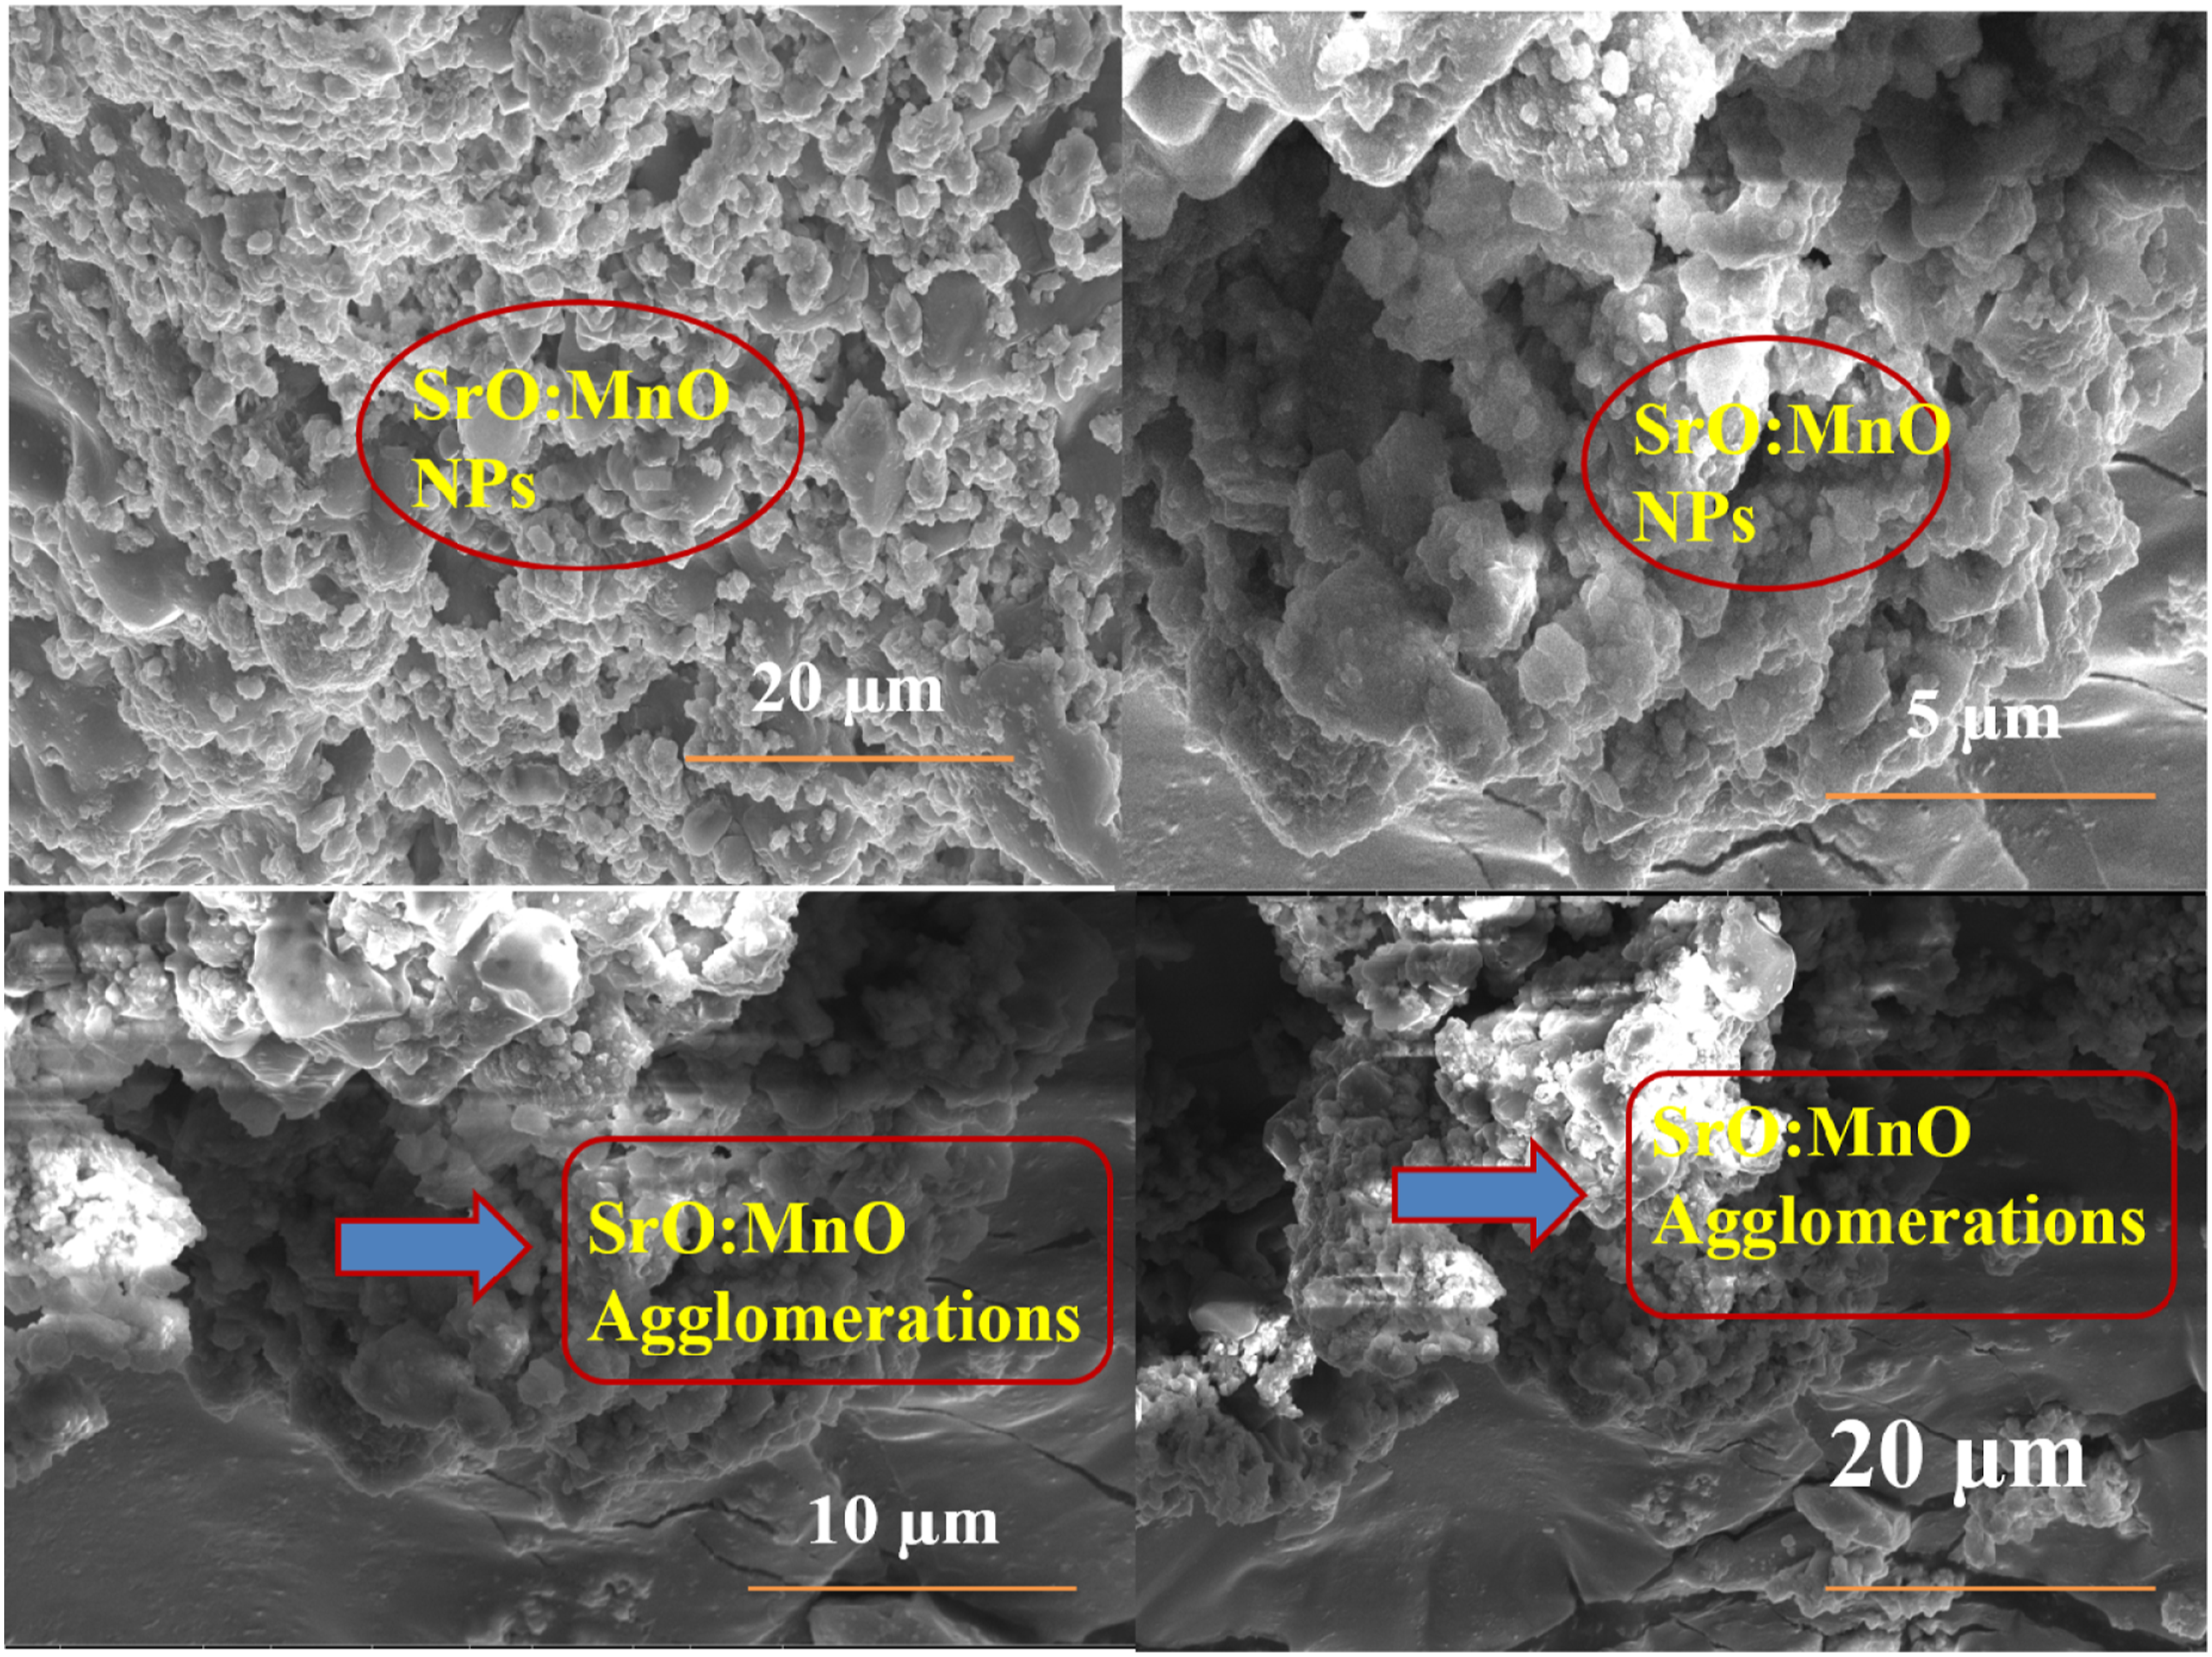
Surface chemistry
The chemical states and elemental composition of synthesized SrO 0.5:MnO 0.5 NCs has been studied using XPS (X-ray photoelectron spectroscopy) analysis. The selected XPS results obtained are depicted in the Figure 7 (see XPS spectra of O1s (a), Mn 2p 3/2 and Mn 2p 1/2 (b), Sr 3d 3/2 and Sr 3d 5/2 (c), and C1s (d) core levels respectively. X-ray photoelectron spectroscopy peaks and binding energy of SrO 0.5:MnO 0.5 NS

Electrochemical analysis of SrO 0.5:MnO 0.5
To investigate the electrochemical performance of the synthesized SrO 0.5:MnO 0.5 electrode, electrochemical analysis like, CV, GCD and EIS were conducted in 6.0 M KOH. CV analysis was carried out in potential range of −1 to 0 V at different scan rates ranging from 10 to 100 mV s−1. Since aqueous KOH electrolyte was used, maximum working potential for the electrode was restricted to 1.0 V (V v/s SCE). Supplemental Figure S8 compares the CV curves at 10 mV/s for Ni foam and synthesized SrO 0.5:MnO 0.5 electrode. From the figure it is clear that, the substrate contribution is insignificantly small towards electrochemical performance of the electrode. CV curves of SrO 0.5:MnO 0.5 NPs electrode at different scan rate is shown in Figure 8(a). The presence of well-defined peaks at all scan rates establishes that the charge storage of the electrode could be from the pseudocapacitive charge storage process indicating presence of faradaic charge transfer. The area under the CV curve represents total charge stored. As the scan rate was increased, the area of the CV curves also increased, indicating higher charge storage capability and good reversibility of the electrode.
48
Anodic peak around −0.48 V and cathodic peak around −0.59 V mainly because of reversible faradaic reactions of active material and electrolyte. Anodic and cathodic peaks show positive and negative shifts respectively, as the scan rate was increased, due to electrode polarization and internal resistance of the electrode. In CV, pseudocapacitive material would be characterized by a broad charge transfer peaks which are mirror images of each other during cathodic and anodic scans.
49
However, as can be seen from Figure 8(a) sweep rate, the peak position/potential changes. The anodic peak potential shifts to right and cathodic peak potential shifts towards left slightly. This makes the distinction between pseudocapacitive and ‘battery type’ process blurred. In nanostructured materials, redox sites remain at interface between electrode and electrolyte. At the interface, the geometry of such sites is expected to be more dispersed than in bulk. This leads to capacitor-like electrochemical response.50,51 Figure 8(b) shows plot of anodic and cathodic peak currents as function of scan rates for the prepared material. For both ipa and i
pc
straight line can be observed, indicating a diffusion controlled kinetics.
48
Furthermore, from CV curves, a mathematical relationship between current response (i) scan rate (ν) can be represented from following equations CV of SrO0.5:MnO0.5 electrode in 6.0 M KOH at different scan rates (a), plot of peak current as function of scan rate (b), log i v/s log ν for determining ‘b’ value (c), variation of specific capacitance from CV at different scan rates (d), galvanostatic charge-discharge plot at different current densities (e) the inset shows GCD plot at higher scan rates (0.5–2.0 A/g), specific capacitance as function of current density from GCD curves (f).


The capacitance plotted as function of scan rate is shown in Figure 8(c). Maximum of 180.3 F/g at 10 mV/s was calculated.
The faradaic charge storage mechanism could be due to different reactions at electrode–electrolyte interface. One could be due to intercalation of alkali metal cations (C+), like K+ during reduction and oxidation in electrode
53

Another possibility could be that cations be adsorbed onto the SrO 0.5:MnO 0.5 electrode surface
Another possibility is from the redox reaction of the active material itself. The following reactions could be the redox reactions responsible for redox peaks in CV plot. (There are no previous reports available on SrO 0.5:MnO 0.5 type bimetallics for supercapacitor applications)

Further electrochemical analysis of the electrode was carried out from GCD tests. Figure 8(d) shows the GCD curves of the electrode at −1.0 to 0 V under differing current densities from 0.15 A g−1 to 2.0 A g−1. The shape is non-linear with plateaus of nearly constant potential at lower current densities before dropping to linear, suggesting pseudocapacitor behaviour with faradaic charge transfer. At higher current densities, shape is still non-linear but also without any plateau of constant potential (The inset in Figure 8(e)). Specific capacitances were calculated from discharge curves for using formula reported in previous literature for materials with pseudocapacitor behaviour9,54,55 The electrode material exhibited a high specific capacitance of 392.8 F g−1 at 0.15 A g−1. The variation of specific capacitance over current density is plotted (Figure 8(f)).
Electrochemical impedance spectroscopy analysis is an effective way to study the fundamental nature of the electrode material. The EIS can be represented by two forms: Nyquist plot and Bode plot. The Nyquist plot obtained from impedance spectroscopy is presented in Figure 9(a). The electrode exhibited a very low equivalent series resistance, RS of 0.48 Ω, which is the combination of ionic resistance, resistance from substrate and contact resistance between the active material and current collector; obtained from the intersection of x-axis of the Nyquist plot. Charge transfer resistance, RCT was found to be 0.63 Ω obtained from the diameter of the semicircle at high frequency region. Presence of charge transfer suggests the presence of Faradaic mechanism of charge storage.
56
The inset in Figure 9(a) depicts the high frequency region. The incomplete not so well formed semicircle and low RCT further confirms the capacitive behaviour of the material. The Bode phase angle plot showing phase angle variation with frequency is shown in Figure 9(b). The phase angle at 0.1 Hz was found to be −77° which is close to ideal capacitor (−90°).
57
Real and imaginary capacitances calculated from equations (4) are plotted against frequency Figure 9(c). Relaxation time constant was calculated from the peak of imaginary capacitances and was found to be very less (0.2 s). It signifies that the material can change very quickly from resistive to capacitive behaviour.
58
Thus, the synergistic effects of highly conductive SrO 0.5:MnO 0.5 NPs, flake like structure of SrO 0.5: MnO 0.5 resulted in high capacitor performance. Specific capacitance 398.2 F/g at 0.25 A/g for SrO 0.5:MnO 0.5 electrode was the highest level compared to the previous results of the various electrode systems of MnO2 NPs and SrO2 NPs which are summarized in the Table 6. The electrodes were also tested for their stability and cyclability by subjecting to 1000 GCD cycles at current density of 2 A g−1 in 3-electrode setup Figure 9(d). 73.4% of the initial capacitance was retained at the end of 1000 GCD cycles which is comparable to some of the previously published metal-oxide composite based electrodes.59–61 As the number of cycles increases, the capacitance decreases and logically it should either keep decreasing or reach certain saturation. However, in most cases we observe fluctuation in capacitance retention percentage over cycles. During constant charge discharge cycles, either due to ion intercalation, exposure and availability of newer electrochemically active surfaces, increase in porosity within matrix (KOH is a general reagent used to activate and increase porosity and surface area in carbon-based materials) result in an increase of capacitance after certain cycles. These could be one of the reasons why after a gradual decrease in capacitance, we see again an increasing trend. Nyquist impedance plot (a), inset shows the high frequency region, Bode phase angle plot as a function of frequency (b) and relative real and imaginary part of capacitances as function of frequency (c). Capacitance retention (%) with cycle number. The inset shows initial and final cycles (d). Electrochemical comparison of different SrO and MnO based composite structures with SrO 0.5:MnO 0.5 NS

Conclusion
Here, we synthesized flake-like bimetallic nanocomposites of SrO 0.5: MnO 0.5 and investigated its electrochemical behaviour for application as high performance supercapacitor. The synthesised SrO 0.5: MnO 0.5 NPs was characterized by UV-visible, XRD, SEM and XPS spectroscopic techniques. The SrO 0.5: MnO 0.5 nanomaterials exhibited optical absorptivity in the UV region (200 nm–325 nm) with optical band gap of 1.74 eV, flake-like structure with orthorhombic crystallinity with average grain size of ∼80 nm and binding energies of Mn2P3 is from 641.3 eV to 653.2 eV and for Sr 3d lie in between 132 eV to 134 eV. The SrO 0.5: MnO 0.5 achieved the highest capacitance of 392.8 F g−1. The long-term cyclic stability of the SrO 0.5:MnO 0.5 NPs determined by charge-discharge cycles. Even after 1000 cycles nanostructure retains 73.4% of the initial capacitance, thereby demonstrating excellent cyclic stability and reversibility of the prepared SrO 0.5:MnO 0.5 NS. Lower impedance values further fulfil the requirement for high-performance super capacitor. Thus, doping is an effective strategy to enhance the energy storage and super capacitive properties of the nanostructures.
Supplemental Material
sj-pdf-1-nax-10.1177_18479804211064028 – Supplemental Material for Facile synthesis of novel SrO 0.5:MnO 0.5 bimetallic oxide nanostructure as a high-performance electrode material for supercapacitors
Supplemental Material, sj-pdf-1-nax-10.1177_18479804211064028 for Facile synthesis of novel SrO 0.5:MnO 0.5 bimetallic oxide nanostructure as a high-performance electrode material for supercapacitors by Vinayak Adimule, Vinay S Bhat, Basappa C Yallur, Adarsha HJ Gowda, P D Padova, Gurumurthy Hegde and Arafat Toghan in Nanomaterials and Nanotechnology
Footnotes
Acknowledgements
Authors are thankful to IIT Kanpur for SEM and XPS analysis, Rani-Chennamma University for XRD and Elemental compositional analysis. One of the author Gurumurthy Hegde acknowledges DST-Nanomission for providing a grant with file No SR/NM/NT-1026/2017. Paola De Padova would like to thank the Mission innovation grant agreement between the Italian Ministry of Ecological Transition and ENEA, Italian National Agency for New Technologies, Energy and Sustainable Economic Development (ref. agreement: 21A03302 GU n.133 del 5-6-2021).
Declaration of conflicting interests
The author(s) declared the following potential conflicts of interest with respect to the research, authorship, and/or publication of this article: All authors declare that they do not have any conflict of Interest.
Funding
The author(s) disclosed receipt of the following financial support for the research, authorship, and/or publication of this article: Dr Gurumurthy Hegde acknowledges DST-Nanomission, Govt. of India for funding the project ‘Biowaste based porous nano materials for efficient low-cost energy storage devices’ with grant No SR/NM/NT-1026/2017.
Supplemental material
Supplemental material for this article is available online.
References
Supplementary Material
Please find the following supplemental material available below.
For Open Access articles published under a Creative Commons License, all supplemental material carries the same license as the article it is associated with.
For non-Open Access articles published, all supplemental material carries a non-exclusive license, and permission requests for re-use of supplemental material or any part of supplemental material shall be sent directly to the copyright owner as specified in the copyright notice associated with the article.