
Abstract
Online loop-closure detection serves as an essential task for Unmanned Aerial Vehicles (UAVs) equipped with laser scanners. Due to the inherent errors in UAVs' pose estimation, a 3-D reconstruction algorithm is adopted to perform 3-D map building, which establishes probabilistic models of the system according to the assumption of errors. To meet the demand of online loop-closure detection using sequential 2-D laser data, a robust ISW-NDT (incremental sliding-window-based NDT) approach is proposed, which compares the appearance similarity between two scans by sliding a window with fixed size. Compared with the conventional 3-D NDT approach, the proposed loop-closure detection algorithm is capable of providing superior performance in large-scale outdoor environments, achieving higher recall rate at 100% precision and ensuring successful online implementation. Experimental results show the validity and robustness of the proposed method.
1. Introduction
Unmanned Aerial Vehicles (UAVs), particularly low-flying small ones, are portable, flexible and potentially cost-effective for robotic applications such as mapping, navigation and exploration. Recently, a variety of approaches have been developed for aerial survey tasks with UAVs in both indoor and outdoor environments [1–4], among which the loop-closure detection problem has aroused great interest for its significance in self-localization and simultaneous localization and mapping (SLAM). Loop-closure detection is presented as the problem of identifying previously visited locations. However, it is still a challenging task for UAVs to detect the loop-closure based on sequential laser scanning in large-scale outdoor environments.
There have been a wealth of studies carried out on loop-closure detection over the past decade for both UAVs and Unmanned Ground Vehicles (UGVs). Among all the loop-closure detection methods, the majority are based on visual sensors. Visual loop-closure detection using Bag-of-Words (BoW) has been extensively studied in robotics research [5,6]. Another method called FAB-MAP is considered an important step in appearance-based loop-closure detection, especially in large-scale environments [7,8]. More recently, direct feature matching [9] and tree structure [10,11] have also received considerable attention in visual loop-closure detection. Although visual sensors are powerful and widely used in loop-closure detection, their problems of sensitivity to various lighting conditions and small fields of view remain to be solved.
Meanwhile, laser range finders (LRFs) provide a wider field of view than most monocular or stereo cameras and are able to provide high-quality data even in dark environments. In recent years, LRFs have been increasingly concerned with loop-closure detection and most laser-based loop-closure algorithms were designed for UGVs [12–16]. A machine learning framework based on AdaBoost was presented in [12], which expressed the problem of loop-closure detection as a classification task. A more detailed version in [13] presented extensions of this work by using various publicly available data sets. The authors showed detection rates of 63% and 53% for 3-D outdoor and indoor environments, respectively. Magnusson et al. proposed an appearance-based loop detection approach, in which the normal distributions transform (NDT) [14] was used as the local appearance descriptor of a 3-D scan [15]. Not only an outdoor data set but also highly similar mine data were used to support the effectiveness of the proposed algorithm. Moreover, the methods in [13] and [15] both used a rotation invariance approach. In a more recent work, Steder et al. [16] presented an approach to transform point clouds into a range image, so that interest points could be obtained to extract features and to score candidate transformations. According to the authors, the performance of rotation invariance would not be affected as long as the robot was moving on flat ground. Their experiment covered both a real campus environment and a freely available data set.
Recently, some groups have been trying to use small UAVs for laser-based loop-closure detection research. The authors in [17] employed a method for loop-closure detection in a pose graph in order to augment the performance of Kalman filter-based navigation, which used the FLIRT feature for the detector and descriptor pair. The FLIRT feature, a multi-scale interest region operator for 2-D range data, was first proposed by Tipaldi and Arras in order to solve the 2-D navigation task in [18]. However, the method is unable to ensure the robustness for 3-D loop-closure detection. In addition, most experiments in the paper are implemented with a freely available data set, where the laser data are obtained in a stop-and-start way. So far, there is no general method readily available for sequential 2-D laser data collected on the fly.
In this paper, a laser-based online sliding-window approach is proposed for 3-D loop-closure detection with small UAVs in large-scale outdoor environments. The description for UAV data collection with LRF (laser range finder) is illustrated in Figure 1., where the scan lines, perpendicular to the UAV's heading direction, are generated by LRF sequentially. The work focuses on two aspects:

3-D point clouds are composed of sequential 2-D laser scan lines acquired by the laser range finder on the UAV
3-D Reconstruction. Compared with UGVs, low-flying small UAVs are much less constrained on account of their navigational capabilities. The vibration of UAVs can bring in pose estimation errors, making it unsatisfactory for detecting loop-closures with distorted point clouds. In order to provide accurate 3-D maps for detecting “loops”, the raw 3-D point clouds must first be aligned. A 3-D reconstruction algorithm is used here based on the work by Thrun et al. in [19]. The algorithm establishes probabilistic models of the system according to the assumption of errors. The reconstruction problem is then converted to an optimization problem of an integrated probabilistic model. The 3-D reconstruction performance and computational efficiency of the proposed method have been demonstrated with experimental results.
Loop-closure Detection. How to detect loop-closures effectively with sequential laser data is another problem stemming from the real applications. This paper presents an online incremental sliding-window-based NDT (ISW-NDT) algorithm to deal with a 3-D loop-closure detection problem. As the UAV flies forward, laser scans are generated by the forward movement of a window with fixed size. Yet the number of scans with this method increases greatly compared with the traditional scan segmentation method. In order to ensure the efficiency of ISW-NDT concurrently, we simply calculate new added data and rotate the NDT grids directly rather than the point clouds. Experimental results show that the ISW-NDT can not only robustly detect loop-closures, but also achieve online efficiency.
The rest of this paper is organized as follows: Section 2 describes the 3-D reconstruction algorithm with sequential 2-D laser scanning data. Section 3 presents the ISW-NDT loop-closure detection approach. The experimental results are introduced in Section 4. Finally, the conclusions and future work are given in Section 5.
2. 3-D Reconstruction Using Sequential Laser Scanning Data
3-D reconstruction with raw laser data is considered an important procedure in UAV loop-closure detection. The location error induced by UAV vibration makes it difficult to build accurate 3-D maps, which has a great impact on the following loop-detection performance. In this section, we introduce an approach using sequential 2-D laser data and the UAV's pose estimation to perform 3-D reconstruction, based on the method proposed by Thrun et al. in [19]. The proposed method converts the 3-D mapping problem into the optimization of a probabilistic model, which can be solved iteratively. The algorithm includes three parts: measurement model establishment, local smoothness model establishment and optimization.
2.1. Measurement model
The micro UAV is equipped with an LRF, a GPS, an Optical flow and an AHRS, which is a common configuration for performing a 3-D reconstruction task. In urban environments, considering the shades of trees or buildings (typical GPS-denied environments), the optical flow is used along all the routes to get the local pose increment for the 3D-reconstruction application. Let xt denote the real pose at time t, composed of three coordinates and three Euler angles (pitch, yaw, roll). Similarly, the measurement pose is presented as

The measurement covariance A is a

Here B is the covariance matrix of differential measurement noise, also obeying Gaussian Distributions. However, the two models above are both established based on the pose of UAVs directly, which is insufficient for accurate mapping.
2.2. Local smoothness model
In order to improve the positioning accuracy based on the preliminary location estimates of an odometer, most SLAM algorithms implement registration of point clouds depending on the overlap between neighbouring scans. However, the neighbouring two scans in our application can hardly overlap since the heading direction of UAV is perpendicular to the scanning plane. Thus, we introduce the local smoothness model, using the scanning results within a short time frame as reference for data alignment at time t.
In structured or semi-structured environments, there are always clumpy planes such as walls, flat roads and road edges, which provide regular distribution of point clouds. This local smoothness property is used to align the scan line at time t. The scanning line at time t needs to be rotated and translated until it coincides with the laser data aligned before time t. Note that there are always discontinuous regions, for example, the edges of a raised or depressed part of the smooth surface, pedestrians or cars appearing unexpectedly, etc. Performance of matching will be affected if these discontinuous point clouds are introduced. The laser points within discontinuous regions are removed by setting the maximum allowable variation ths. If the distance between one point and its nearest neighbour is larger than ths, the pair of laser points will be deleted. The local smoothness model in this subsection is established after filtering jumping laser points at the edges.
Let

We set
Considering that a 2-D laser sensor is used in our 3-D reconstruction system, lacking the measurement information of the third dimension, we omit the dimension where the laser range sensor moves forward while calculating the maximum in (3).
2.3. Optimization
After the assumption of measurement and systematic errors, the resulting probabilistic model is proportional to the following product:

The negative log-likelihood is expressed as follows:

According to the theory of maximum likelihood estimate, the real pose xt can be recovered by minimizing

Note that
3. Sliding-window Approach for Loop-closure Detection
3.1. Loop-closure detection framework
The structure of the framework is illustrated in Figure 2. The input data consist of the newly acquired sequential 2-D laser data R k and current pose data P k of the UAV. In the first step, the raw laser data and pose data are fused and optimized to reconstruct the current 3-D map M k by the method introduced in Section 2. Noting that M k contains all the 3-D laser data the UAV has collected until the k th moment, a 3-D laser scene S k is selected by a sliding-window-based algorithm from the long map M k (i.e., defining the current place the UAV is visiting). For the current scene S k , we extract robust appearance-based features to get descriptor D k . The scene generation step and feature extraction step together constitute the ISW-NDT algorithm, which will be introduced later in Section 3.3. Finally, a matching step is conducted to compare the descriptor D k of the current place with the descriptors D 1 , D…D k-1 of previously visited places. If D k is similar to one of the previous descriptors in the reference database, the current scene S k is considered a loop-closure. When all the steps have been completed, the descriptor Dk will be put into the reference database and used for the next matching steps.

Loop-closure detection framework
As the UAV flies, new places come continuously. The loop-closure detection framework repeatedly runs all the steps above to determine whether a place is a loop-closure or not. Note that the size of the reference database incrementally grows as the UAV flies. However, the framework can be very efficient at computing, for the reason that the database is updated with appearance descriptors rather than storing the raw 3-D points of the scene.
3.2. Appearance descriptor extraction using 3D-NDT
We use a 3D-NDT algorithm to generate appearance descriptor D
k
from current scene S
k
. 3D-NDT is presented by Magnusson et al. for completing 3-D laser-based loop-closure detection. The 3D-NDT algorithm represents a laser scan as Gaussian distribution
In order to make the appearance descriptor invariant to rotation, the 3D-NDT algorithm normalizes the orientation of the 3-D scan to standard orientations calculated from planar classes, making multiple normalized scans. For every normalized scan, shape histograms are generated within various metric intervals to make the appearance descriptor invariant to distance. Histograms from all normalized scans and all metric intervals together form the final appearance descriptor.
3.3. Incremental sliding-window-based NDT algorithm
The 3D-NDT algorithm has solved the problem of extracting feature descriptors from a single 3-D scene. However, for the on-the-fly data from the UAV platform, there is no clear definition of a scene. In order to deal with on-the-fly data, this paper proposes the ISW-NDT algorithm, which combines scene selection mechanism and 3D-NDT computation. The ISW-NDT can not only extract feature descriptors from on-the-fly data, but is also efficient enough to meet the online computing requirement.
For the ISW-NDT in this paper, the sliding window is applied to complete the scene segmentation online. Similarly to the approach in other fields such as image processing, ISW-NDT implements a window with fixed size d to label the boundaries of a scene. The details of how the sliding window works are illustrated in Figure 3. As the UAV moves, the window slides forward with the distance increment λ, the newly generated 3-D laser scan lines La (scan lines to add) are inserted into the area of the sliding-window and the old 3-D scan lines Ld (scan lines to delete) outside the area of the sliding window are deleted. For every step λ, a new scene is generated by all the scan lines in the window.
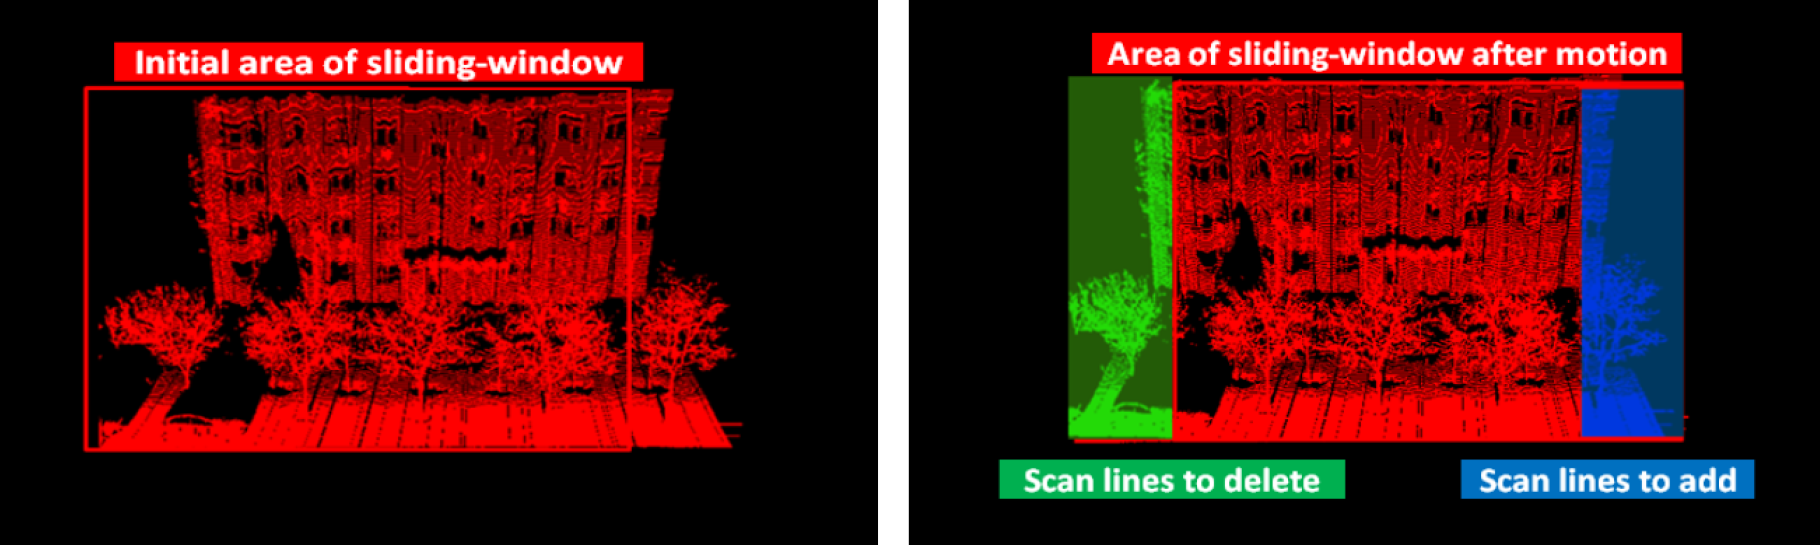
Illustration of the insertion and deletion procedure for the sliding window. Left: starting position within the sliding window, represented in red. Right: the UAV moves forward with distance increment λ and the area of the window (in red) overlaps partially with some areas. The scan lines to delete are shaded in green; the scan lines to add are shaded in blue.
Next we examine how to efficiently compute the appearance descriptor for the scene in the current sliding window. The original 3D-NDT algorithm turns out to be time-consuming when trying to ensure rotation invariance of the appearance descriptor. The 3D-NDT algorithm first calculates the NDT grids G, then rotates the raw 3-D scene for multiple times and calculates the NDT grids G’ for the second time. However, we consider that G and G’ can conserve the properties of the raw point clouds and there is no need to rotate the enormous raw data of the scene. The ISW-NDT algorithm in this paper straightforwardly rotates the NDT grids G to get G’ and removes the step of re-calculation of NDT grids. The algorithm will be proved to be effective and efficient in the experiment in Section 4.
The ISW-NDT algorithm uses an incremental storage technique to further increase efficiency. For the NDT grids G of the “area of sliding-window after UAV motion” (i.e., the current scene), the NDT grids G a of the “scan lines to add” and the NDT grids G d of “scan lines to delete”, the NDT grids of the current k th scene can be calculated as G k = G k-1 - G k d + G k a , where G k-1 represents the NDT grids of k-1 th scene. For every step the sliding window moves, the algorithm only needs to calculate G k a to get G k (G k d is a part of G k-1 and need not be calculated in the current step), causing the sliding window to work in an incremental way. All the details of the whole ISW-NDT algorithm are described in Algorithm I.
3.4. Matching and reference database updating
The matching step compares the current descriptor Dk of S
k
with the previous descriptors
4. Experimental Results
4.1. 3-D laser data set acquisition with UAV platform
In this study, a small UAV with six fixed rotors is used to collect sequential 2-D laser data in a complex urban environment, with a Hokuyo UTM-30LX-EW LRF, PCM-3362 CPU, UBLOX LEA-6h GPS, PX4 optical flow and MAHRS, the configurations of which are listed in TABLE I. The point clouds are obtained from the Hokuyo UTM-30LX-EW 2D laser range finder mounted on the UAV, as illustrated in Figure 4. The laser range finder provides the UAV with sequential 2-D scan lines at a rate of 40Hz with 0.25° resolution, oriented roughly perpendicular to the robot's flight direction with a view of 270°, as shown previously in Figure 1. The UAV is flown under manual control.
Configurations Of The UAV


The HOKUYO UTM-30LX-EW 2D laser scanner mounted on a small UAV. The white parts are used for protecting the laser sensors.
In order to evaluate the performance of the algorithm, we chose two routes on the DUT campus, named DUT-UAV1 and DUT-UAV2 respectively, as denoted in Figure 5. In each figure, the route of the UAV was labelled with red lines, of which the pink dashed lines were hand-labelled ground truth. The DUT-UAV data sets are a typical campus environment, containing common urban structures such as buildings, trees, cars, roads, etc. The details of the DUT-UAV data sets can be found on the following link to the college's website: http://scse.dlut.edu.cn/English/Research/Projects/UAV_laser_Dataset.htm.
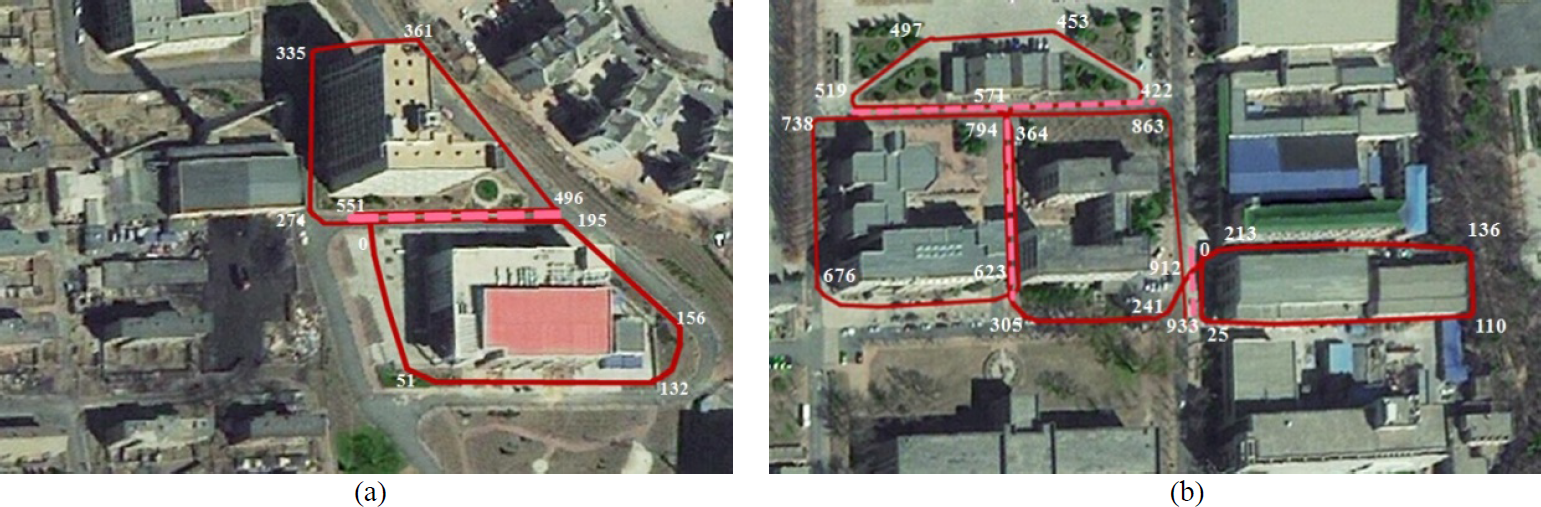
An aerial view of DUT-UAV data set; trajectories of the data set are overlaid on Google Earth. The UAV flew along the red lines in the figure with increasing distance. (a) DUT-UAV1 is about 551 m; (b) DUT-UAV2 is about 933 m. The proportion of loop-closures for DUT-UAV1 and DUT-UAV2 is 10.1% and 19.6%, respectively.
4.2. 3-D reconstruction results
The goal of optimization in Section 2.3 is to minimize the objective function
We tested the performance of the 3-D reconstruction algorithm in a variety of structured or semi-structured environments on the DUT campus. Some typical experimental results are provided in Figure 6., which are randomly selected from the DUT-UAV data set, including the 3-D reconstruction results of a vertical wall scene, a slope scene and a tennis court scene. It should be noted that the following 3-D reconstruction results are obtained while omitting the vibration of roll.

Three groups of 3-D reconstruction results selected from DUT-UAV data set including structured or semi-structured environments. (Top) raw point clouds; (Bottom) the same point clouds after 3-D reconstruction. The execution time for Fig. 6(a), 6(b) and 6(c) is 78.61s, 81.02s and 188.43s, respectively.
4.3. Timing analysis of 3-D reconstruction
As represented above, the Hokuyo LRF works at a rate of 40Hz with 0.25° resolution; in other words, each scan line contains 1,081 points. However, there is no need to use so many points in practical applications, especially for smaller scenes or other LRFs with lower resolution.
We introduce the down-sampling strategy to test the 3-D reconstruction performance. The laser points are down-sampled by one-third and one-fifth, respectively. The respective execution time of scenes in Figure 6. is summarized in TABLE II. The runtime analysis is carried out on a laptop with a Core i5-4200 CPU and 4GB of RAM, running Windows 8. It is clear that there is a remarkable acceleration in processing time by down-sampling and that the average time per line by no down-sampling, one-third and one-fifth is 30.8ms, 11.7ms and 8.3ms, respectively. Meanwhile, a group of 3-D reconstruction results (the same scene in Figure 6. (a)) by several different down-samplings are shown in Figure 7., from which it can be seen that down-sampling has a negligible effect on 3-D reconstruction performance. Considering the online requirement in the experiment, we finally use the reconstruction results by one-third down-sampling for the following loop-closure detection approach, where each scan line contains 361 points.
Execution Time by Different Down-Samplings


A group of down-sampling results of 3-D reconstruction algorithm. (a) raw 3-D point clouds; (b) the 3-D reconstruction result of the same scene without down-sampling; (c) the 3-D reconstruction result of the same scene by one-third down-sampling; (d) the 3-D reconstruction result of the same scene by one-fifth down-sampling.
4.4. Loop-closure detection evaluation
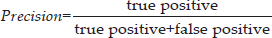
In general, there are two types of evaluation method to judge the discrimination ability of 3D-NDT: Full Evaluation and SLAM Scenario [15]. Considering the practicability in our application, we assess the efficiency of the ISW-NDT algorithm in SLAM application. When a scan S i is labelled as a loop-closure, we require that the distance from S i to the most similar scan S i ’ should be less than the distance threshold t r and, simultaneously, the difference between the two scans should be below the difference threshold t d . The algorithm is evaluated in terms of precision rate (P) and recall rate (R), which are defined as

The true positive and false negative together constitute the ground truth, which is obtained in our work by manually labelling online-generated 3-D laser scans as either “overlapping” or “non-overlapping”. The labelling is done for a series of individual scans instead of all combinations of scan pairs. The reason is that, once the data set contains hundreds of scenes, it is not practical to conduct; some scan pairs are also not easy to judge. The precision-recall rates are important characteristics for any detection problem and, generally, it is difficult to achieve high precision rate and high recall rate simultaneously. For the loop detection problem in the SLAM application, even a single false positive (i.e., the non-overlapping mistakenly being considered overlapping) has a destructive effect on the following global optimization. Thus we argue that the concern in this work is to keep precision at 100%, while maximizing the recall rate.
4.5. Parameters
The parameters of the proposed appearance descriptor are selected for the loop-closure detection experiments, the values of which were chosen empirically:
NDT cell size q = 0.5 m
Sliding window size s w = 300 laser lines
The distance threshold t r = 30 m
The index threshold t
x
=
The difference threshold t d = 0.051
The NDT cell size q is chosen mainly based on the configuration of LRF. If the grid is too small, the scanner noise will affect the appearance descriptor dominantly, especially for sparsely distributed point clouds at farther parts of a scan. On the other hand, if the grid is too large, it is unable to describe the details of point clouds accurately. The experimental result shows that q = 0.5 m works well for ISW-NDT loop-closure detection by our UAV platform equipped with a Hokuyo 2-D LRF. In addition, the sliding-window size s w is also an empirical parameter which is determined by the number of laser lines. Using 300 laser lines per scene produced good results in our experiment. Another choice is to generate scenes by fixed distance, which is less convenient to conduct for the sliding-window approach. Note that our UAV flies under manual control at a fixed speed; the line-based or distance-based scene generation can produce almost the same performance.
As mentioned above, this study considers that the two scans being compared should be below the distance threshold t r . Cummins and Newman [8] use a 40-m threshold for a trajectory of about 100 km, which was too large for our data set here, while the work in [15] uses a 2.6-m threshold for a trajectory of 111 m. Almost all the loop closures in our work can be detected when the distance threshold t r is set to 30 m. For our DUT-UAV data set, 98% of the detected scans are less than 15 m and 88% are within 5 m.
A minimum loop size has also been applied in our practical SLAM experiment based on the fact that the UAV cannot return to the previously visited place within only a few steps. When finding the most similar scan of S
k
, we only compare the scans that are more than t
x
steps away in the scan sequence. The index threshold t
x
is identified as
The slide increment λ, which is not a fixed parameter in our experiment, has a great effect on the performance for ISW-NDT loop-closure detection. It is of vital importance to find a good value for the slide increment λ. Using a too-small value greatly increases the number of scenes as well as the comparisons between scenes; thus the expected time increases with the number of scenes. On the contrary, a too-large value can evidently cause a reduction in recall rate. For example, a place in one scene may be segmented into several scenes which may lose some distinctive features when the same place is revisited as λ increases, making the difference between these scans larger than t d ; in other words, the false negative is introduced. Figure 8. illustrates the influence of slide increment, showing how the precision-recall curves and the elapsed time change for the DUT-UAV2 data set when λ varies, respectively.
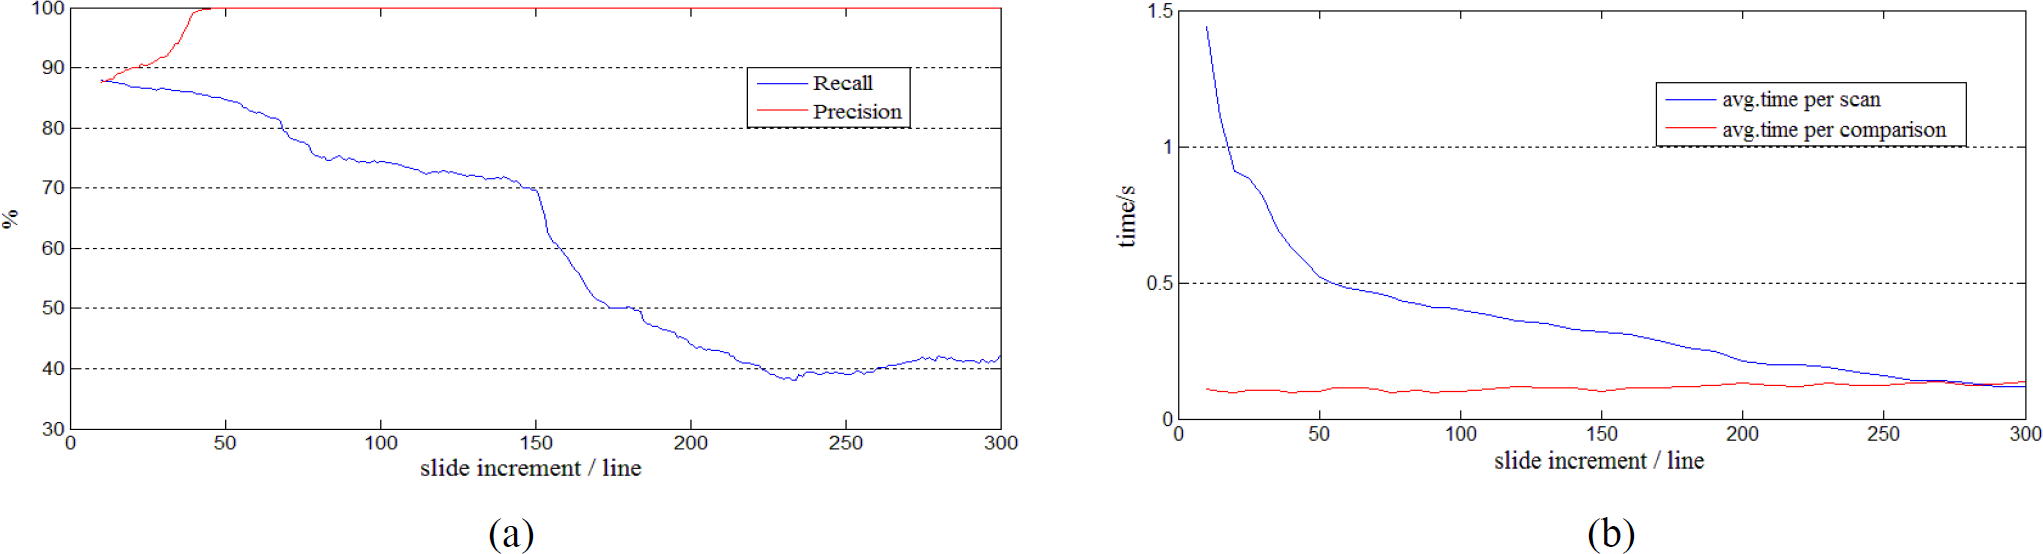
(a) The precision and recall curves as λ varies. (b) The average elapsed time as λ varies.
As shown in Figure 8., the distance threshold t
d
can guarantee the precision at 100% in most conditions during the change of λ. Yet, once λ is less than 50, the available t
d
will produce a false positive, which can result in mistakes for subsequent mapping in SLAM. Meanwhile, the recall keeps increasing with the reduction in λ. During this process, there is an obvious ascent when
4.6. Experimental results of loop-closure detection
The loop-closure performance using

Loop-closure maps for the DUT-UAV2 data set with λ=50. The ground truth is shown in pink, while the green colour denotes the false negatives (loop closures that are not correctly detected). A total of 135 loop closures are detected, with no false positives.
The ISW-NDT algorithm has also been compared with the 3D-NDT algorithm, which is the state-of-the-art loop-closure detection method used for UGVs. More discussion regarding the difference between the 3D-NDT and ISW-NDT algorithm is summarized in TABLE III., running on the DUT-UAV data set (the laser data are collected while the UAV is flying), where an obvious improvement can be seen in both timing and recall rate. Moreover, it can also be confirmed that, if no 3-D reconstruction approach has previously been applied, the recall rate for the DUT-UAV2 data set with
Comparison Between 3D-NDT And ISW-NDT

4.7. Timing of loop-closure detection
The runtime analysis of the loop-closure detection approach was carried out on a laptop with a Core i5-4200 CPU and 4GB of RAM, running Windows 8. For the DUT-UAV2 data set, there are 108,300 laser points in each scene and the whole data set contains 809 scans when setting
Taking the time of the 3-D reconstruction into consideration, if we set
5. Conclusion and Future Works
This paper presented the ISW-NDT algorithm to solve a UAV's loop-closure detection problem using sequential 2-D laser data. Considering the measurement error of UAVs, a 3-D reconstruction approach is first used to build accurate 3-D maps, which convert the mapping problem into the optimization of probabilistic model. On the other hand, in order to solve the loop-closure detection problem with sequential 2-D laser data, the ISW-NDT approach is proposed, which can detect the revisited places effectively by sliding a window with fixed size. Experimental results have shown that the presented approach can achieve high recall rates at 100% precision in large-scale outdoor environments. With the strategy of one-third down-sampling, the total time for 3-D reconstruction and loop-closure detection is about 1.1s for a scene with 108,300 points, which can well ensure the online implementation.
To further improve the performance of this approach, future work should focus on developing better validity of the 3-D reconstruction algorithm, since the reconstruction can at present only be done with a piecewise strategy (if the heading direction of the UAV changes, the reconstruction algorithm needs initialization). In addition, further work should consider dynamic disturbances, such as cars or pedestrians passing by in the scene.
Footnotes
6. Acknowledgements
This work was supported in part by the National Natural Science Foundation of China (Grant No. 61305128, 61375088) and the State Key Laboratory of Robotics (Grant No. 2013-O07).