
Abstract
In this paper, we investigate the contribution that visual perception affords to a robotic manipulation task in which a crumpled garment is flattened by eliminating visually detected wrinkles. In order to explore and validate visually guided clothing manipulation in a repeatable and controlled environment, we have developed a hand-eye interactive virtual robot manipulation system that incorporates a clothing simulator to close the effector-garment-visual sensing interaction loop. We present the technical details and compare the performance of two different methods for detecting, representing and interpreting wrinkles within clothing surfaces captured in high-resolution depth maps. The first method we present relies upon a clustering-based method for localizing and parametrizing wrinkles, while the second method adopts a more advanced geometry-based approach in which shape-topology analysis underpins the identification of the cloth configuration (i.e., maps wrinkles). Having interpreted the state of the cloth configuration by means of either of these methods, a heuristic-based flattening strategy is then executed to infer the appropriate forces, their directions and gripper contact locations that must be applied to the cloth in order to flatten the perceived wrinkles. A greedy approach, which attempts to flatten the largest detected wrinkle for each perception-iteration cycle, has been successfully adopted in this work. We present the results of our heuristic-based flattening methodology which relies upon clustering-based and geometry-based features respectively. Our experiments indicate that geometry-based features have the potential to provide a greater degree of clothing configuration understanding and, as a consequence, improve flattening performance. The results of experiments using a real robot (as opposed to simulated robot) also confirm our proposition that a more effective visual perception system can advance the performance of cloth manipulation.
Keywords
1. Introduction
Interacting with clothing requires dexterous manipulation. The required perceptual and hand-eye coordination capabilities come naturally to humans, but represent a challenge to current autonomous robotic systems. Although recent research has improved robot capabilities [1–3], limitations remain that must be overcome before robots can interact effectively with deformable objects that can be approximated as 2D manifolds in 3D space, such as clothing or textile materials. In this paper, we present a set of novel computer vision algorithms which allow a robot to analyse a deformable clothing, or textile, surface visually and then describe the topology of this surface in order to manipulate it. The surface topology is represented in terms of simple visual primitives which are then parsed into high-level descriptions that in turn initiate a specific action for modifying the current state of a deformable garment or textile material to achieve a desired outcome, i.e., perception-action cycle. Our objective is therefore to produce a high-level representation of the configuration of deformable garment, or textile, objects that is particularly suited for their robotic manipulation.
Deformable objects can be classified according to their elasticity, viscosity, plasticity and resilience. Clothing is the most challenging deformable object for perception and manipulation tasks [4] and accordingly we focus on clothing in this paper. Current research into perception and manipulation for clothing consists of finding a tractable garment state in order to interact and manipulate it [1, 2, 5]. However, these approaches have assumed that, after finding a ‘known’ state, robotic manipulation then follows a rigid strategy that solves the task at hand (e.g., folding, flattening, unfolding, etc.). In other words, the robot does not update the garment's internal representation and it does not visually adjust its manipulation strategy accordingly. Therefore, the question is whether the analysis of an object's topology and surface shape enables a robot to interact and manipulate clothing optimally as a result of improving manipulation through perception and reasoning. The answer depends on the level of representation provided by the feature extraction process.
In this paper, we investigate two methods for extracting features from 2.5D range maps: (a) clustering-based feature extraction, where we compute local and global discontinuity statistics and (b) geometry-based feature extraction, employed to extract a topological representation of the cloth. To demonstrate the performance of these feature extraction techniques, we consider a cloth-flattening, since a key step required to achieve this task is the mechanism employed to describe and represent the cloth's wrinkles. We conduct our experiments within a simulator to allow us to compare the performance of feature extraction techniques with identical starting configurations of the garment. We evaluate the efficiency, quality and stability of the flattening task for each feature extraction technique. As reported in the section Experiment, we find that the geometry-based feature extraction technique outperforms the more coarse clustering-based approach in terms of manipulation and, specifically, flattening wrinkled clothing. The method proposed in this paper advances the state of the art in the analysis of the surface topology of deformable objects. In addition, our physical simulation-based experiments provide a new solution for evaluating the manipulation of deformable objects. The preliminary vision of this paper has been reported in [6] and the feature extraction techniques presented therein have also been reported in [7]. This paper provides a refined flattening strategy and details more comprehensive experiments than those reported in [6]. Accordingly, the novel contribution made by this paper, extending the work reported in [7], is that we now focus on verifying the utility and implementation of appropriate feature extraction methods within a repeatable simulated environment, while [7] provides the evaluation of the performance of various depth sensors and manipulation protocols (single-arm or dual-arm flattening) on flattening real garments.
2. Literature Review
Research on perception and manipulation tasks for robotic laundry systems consists of: isolating and classifying clothes from a laundry heap [8, 5, 9], finding a tractable state of the clothes in order to interact and manipulate them [3] and then folding the cloth [1, 2, 5]. In that regard, Ramisa et al. [8] propose a supervised learning approach for grasping highly wrinkled garments. In Ramisa's grasp point detection method, manually segmented regions are used to train logistic regression and
Maitin-Shepard et al. [5] proposed a ‘lowest point algorithm’ to locate towel corners by tracking the towel's boundaries for a towel-folding task using a dual-arm robot. This method iteratively finds the lowest point of a suspended towel (grasped by the previously found lowest corner and initialized by a random grasp) until the robot is grasping a corner of the towel in each hand. The robot then stretches the garment and verifies that it does not present any wrinkles before the folding procedure starts. However, this method cannot be extended to other types of fabrics and shapes of garment as it relies on a predefined control sequence tailored to manipulating small and specific towels.
Willimon et al. [12] propose an interactive perception-based cloth unfolding strategy that relies upon detecting depth discontinuity corners in depth maps. For each iteration, the highest depth corner of the observed cloth is grasped and pulled away from the centroid of the clothing surface. A limitation of this method is that it is not generic and is difficult to extend to other shapes of clothing. This approach relies on detecting the corner of the cloth's surface boundary and requires a considerable number of rigid pulling iterations, rather than flattening by understanding the cloth's configuration during each manipulation cycle.
Physics-based simulations are widely used in building autonomous robot systems since they can be relatively inexpensive, reliable and realistic, which also applies to cloth simulation. Cloth physics simulation is usually based on a mass-spring model [13,14]. In this paper, cloth simulation is employed to afford a standard initial cloth configuration required to evaluate and compare various cloth-flattening approaches. It is perhaps worth noting that physics-based cloth simulations have also been used in other contexts, such as tracking cloth from videos [15], or RGB-D data [16].
Visual perception is one of the most important components of an autonomous system. Currently the state-of-the-art visual perception features are mainly applied to range data, or RGB-D data. In this paper, we aim to advance the visual perception of garments and explore the effectiveness of visual perception in garments manipulation; therefore, we provide here a survey of 2.5D/3D surface analysis.
Following the great success of the SIFT [10], statistics-based local range map [17, 18, 19] or point cloud features [20, 21] can be used for range map or point cloud registration. By tracking the movement of cloth components by means of registration, it becomes possible to evaluate the height variation of a cloth surface configuration during manipulation. However, it is extremely difficult to define interest points on a smooth non-textured cloth surface and local surface descriptors are unstable since the cloth can take quasi-infinite state configurations.
Willimon et al. [22] proposed a 3D deformable surface estimation approach using energy minimization. They defined four types of energy: the smoothness term, the correspondence term, the depth term and the boundary term. These energies are the constraints that prevent the surface from changing too much from the canonical configuration. Finally, the energy of the current surface configuration is represented and an optimizing approach is employed to minimize these energy terms. Later, [23] they extend their work by removing the SURF [24] feature-based correspondence term and extending the boundary term. This method is capable of generating a mesh representing a deformable surface, but the shape of this surface (canonical image) should be known in advance.
The B-Spline surface [25] is a classic 3D graphic modelling method and can also be used to approximate implicit surfaces from known surface points. In piece-wise surface fitting, as opposed to typical least-square polynomial surface fitting, B-Spline surface fitting [25] can achieve continuity between adjacent patches more easily.
Ridge lines contain the essential topology information of a manifold surface. [26] proposed a ridge valley line detecting approach on a mesh surface following implicit surface fitting. Later, [27] gave the geometrical definition of ridge points – the positive extrema of maximal curvature. Shape index [28] is a classic 2.5D surface shape analysis approach, which can classify nine different shape types in terms of an integer valued index. In [29], it has been extended to analyse a point cloud via a mesh surface. Since shape index is a geometry-based feature, it is sensitive to high-frequency noise and is only capable of measuring shape properties rather than measuring the magnitude of shapes. In this paper, we propose a novel wrinkle detection and representation approach, which can not only analyse surface topology and shape, but can also measure the magnitude of surface topological features.
Overall, from the literature review we can conclude that the current state of the art in cloth manipulation usually focuses on specific tasks rather than serving as the basis for understanding generic cloth configurations. In particular, for cloth flattening, previously reported approaches rely on iterative strategies with elementary visual perception mechanisms (e.g., corner detection, edge detection). In order to advance the state of the art, we propose a novel approach to feature extraction that is better able to understand generic cloth configurations through parsing the shape and topology of 2.5D surface features.
3. Methodology
In this section we first present the details of our virtual cloth manipulation system, introducing physics-based cloth simulation and simulated depth sensing. We then present our two clustering-based and geometry-based approaches to visual perception. Finally, we detail our heuristic-based flattening method.
3.1. Virtual Clothes Manipulation System
In order to explore and validate visually guided clothing manipulation, we have developed a hand-eye interactive learning system that incorporates a clothing simulator to close the effector-garment-visual sensing interaction loop. Our cloth simulator enables us to apply the required actuation forces accurately while avoiding sources of error such as the robot's joints and noise introduced by sensing systems. In this paper, physics-based virtual cloth simulation is employed to evaluate the flattening performance of various feature extraction methods, as this simulation-based approach can reproduce the same initial cloth configurations for each experiment, which of course would be difficult to achieve if real cloth were to be used for this purpose. We must emphasize that the feature extraction approaches we present are not only able to work in virtual simulation but also in real robot practice using real-world RGB-D data (such as Kinect-like camera data or stereo data). We have completed pilot investigations into autonomous grasping and clothing flattening [30], based on the features presented here applied to RGB-D images captured using our actuated binocular robot head.
The overall design of our virtual cloth manipulation system is illustrated in Fig.1. This virtual system follows the perception-action cycle: the processing cycle starts by either initializing cloth with specific wrinkled configurations (presented in Section 4.1), or applying a computed force to deform the cloth. Once the cloth has attained static equilibrium, a point cloud is generated from all the particles that comprise the cloth (perception). A range map is then generated from the point cloud (an example is shown in Section 3.1.2), which is passed to the feature extractors described in Section 3.2 and 3.3. Following analysis of the cloth scene, an action (force) is inferred by our flattening strategy (presented in Section 3.4) and applied to flattening the largest cloth wrinkle. This processing cycle is iteratively applied to generate an animation depicting the cloth surface during the flattening process.

Virtual Cloth Manipulation System Flowchart. The system begins by initializing the cloth in the physical simulation. When the simulated cloth settles into a stable configuration, i.e., stops moving from its initial configuration, a point cloud can be obtained from the cloth's particles; thereafter, a virtual depth camera is positioned to capture a depth map of the scene. Visual features are then extracted by the means of two different methods detailed in this paper and all wrinkles are detected and quantified to thereby understand the cloth configuration. The flattening strategy infers from the parsed cloth surface configuration an appropriate grasping location and applied flattening force magnitude and direction. Prior to applying the flattening force, the status of the cloth is checked to determine whether its ‘flatness’ meets the halting criterion. If it does, the process is terminated; otherwise, another iteration of flattening is applied to the garment and the dynamic interaction between the garment and its surrounding environment is simulated.
3.1.1. Cloth Simulation
Our simulated virtual cloth is composed of particles that are governed by structural, shear and bending constraints [14]. The motion of these particles is modelled in terms of Newton's Laws of Motion and a Mass-Spring model, as described in [13, 14], operating under gravity. For each of the above constraints, the interaction of each particle is further restricted by an offset that limits the range of distances between all connected particles (i.e., to prevent particles from getting too close or far away from each other). We have also incorporated the frictional forces exerted by a virtual table acting on the cloth into our kinematic simulation. For this purpose we adopt Ridson's friction model (as detailed in [31]), which includes both static and sliding frictional forces.
Our simulator is implemented in C++ under Windows and 64-bit. OpenGL [32] is used to render the 3D surface of the cloth. Our simulation can be initialized by loading 3D cloth points and their spring constraints. In this case, we are able to reproduce the same cloth initial configurations required in comparison experiments. The processing time consumed during each cloth flattening simulation iteration is approximately 10 seconds, depending on the magnitude of the forces acting on the cloth.
3.1.2. From Point Cloud to Range Map
A range map comprises a matrix of range values, in which each pixel position stores the distance from the perspective centre of a camera to a location on the surface of the observed scene (range values exhibit the central projection geometry of standard RGB images). Accordingly, a range of standard 2D image processing algorithms can be directly applied to the 2D matrix structure of the range map [33]. Moreover, a range map only needs 1/3 of storage space of a point cloud. Therefore, we prefer to adopt the range map representation over the unstructured point cloud.
In order to generate a surface from the non-uniform point cloud, we employ a cubic convolution interpolation algorithm [34] that allows us to generate a 2.5D depth map. As our goal is to obtain range maps that resemble those obtained from a stereo-vision system [35], or more general RGB-D sensors, surface points that self-occlude from the camera's point of view on the simulated world are deleted by means of a hidden point removal algorithm [36]. This step removes points that can potentially affect the surface construction and interpolation process. In this paper, we have selected the camera's point of view to be perpendicular to the table plane; this approximates the perspective from which a robot might observe a garment lying on a table.
3.2. The Clustering-Based Wrinkle Analysis
3.2.1. Absolute Mean Deviation Feature
A wrinkle is a basic folding configuration exhibited by cloth that we define as a statistical discontinuity in the range values representing the cloth surface. We also define wrinkles to be approximately linear structures with definite start and end points. In order to detect wrinkles, we measure a ‘wrinkledness’ or ‘wrinkle strength’ score by computing the local average absolute deviation of range values in square patches (we adopt three different square sizes; more details are shown in Fig. 2) on the range map. More specifically, for each patch pi, the absolute deviation between the patch range and cloth range is calculated by Eq. 8:
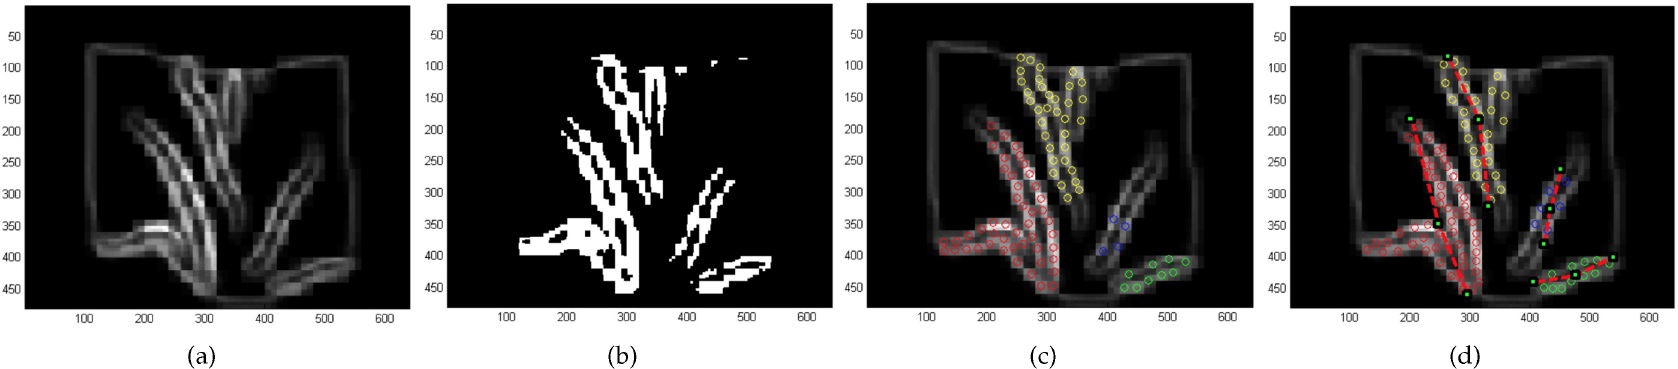
(a) shows the final merged feature map with Gaussian smoothing. We merge the previous three deviation maps (patch sizes are five, 10 and 20) by averaging. In 2(b), the pixel level segmentation using threshold σ1 is shown. In 2(c), the round dots represent the cluster centres of K-means. The clusters are then grouped to different wrinkles through hierarchical clustering, as shown in different colours. The detected wrinkles are shown in 2(d), of which the red one is the largest. In our implementation, the parameter of Gaussian filter σ1 is set as 0.5, the threshold of hierarchical clustering σ2 is set as 35 and N kmeans is set as 100. From empirical investigation, we found that these thresholds work well in practice.

where Nj is the number of pixels in this patch, rj the depth value of jth pixel and rc the mean depth value of the cloth. In our implementation, absolute deviation features computed with different patch sizes are pixel-wise merged together into a single feature strength map. A Gaussian smoothing process is then applied to obtain the final feature map that preserves continuity across pixels.
3.2.2. Clustering-based Wrinkle Description
Having computed the absolute mean deviation feature in the previous section, we apply a K-means clustering algorithm to the x-y coordinates of those pixels labelled as highly wrinkled. Thereafter, we join these clusters using a bottom-up hierarchical clustering algorithm in order to group them into salient wrinkles. The two end points forming a wrinkle, as well as the wrinkle centre, can be computed from the final clustering (as shown in Algorithm 1). The whole process of feature extraction is demonstrated in Fig. 2.
3.3. The Geometry-based Wrinkle Analysis
In the previous section, we presented a clustering-based wrinkle detection approach. This approach has the following limitations: the clustering-based detection method lacks an effective wrinkle segmentation mechanism. When the cloth is highly wrinkled, the patch used to measure local range variance will overlap adjacent wrinkles and therefore tend to merge these together; as a consequence, the clustering-based detection and representation is unable to localize wrinkles spatially and quantify their magnitude with sufficient accuracy to support reliable dexterous cloth manipulation.
In order to advance the state of the art in the analysis of deformable objects (specifically clothing in this paper), we propose a hierarchical geometrical feature extraction approach that parses the cloth surface from low-level curvature features, to middle-level topology features and finally to high-level wrinkle descriptors. This process comprises four steps: 1) B-Spline surface fitting, 2) cloth topology and shape analysis, 3) wrinkle detection and 4) wrinkle quantification.
As geometry-based features such as curvature and shape index [28] are susceptible to high-frequency noise, we first employ a B-Spline surface fitting approach. We then detect surface topographic features (including ridges, wrinkle contours and surface shape types) by computing the shape index of the cloth surface. Thereafter, wrinkle structures are constructed and represented by fitting polynomial curve models. We can then quantify wrinkles through a triplet of values (detailed in the next section) that allow the location, height, width and energy of the wrinkle to be deduced. Finally, based on this quantification, we apply a flattening heuristic to reduce the magnitude of the largest wrinkle detected.
3.3.1. B-Spline Surface Fitting
Piece-wise B-Spline surface fitting is able to suppress the high-frequency noise and obtain a C1 continuous 1 implicit surface. In our approach, the point cloud is first divided into square patches on the x-y plane. An open uniform B-Spline surface is fitted to each patch [25]. Adjacent patches are connected together by blending the control points in order to ensure continuity.
3.3.2. Clothes Topology and Shape Analysis
In order to detect wrinkles on the cloth's surface, we first give a geometric definition of a wrinkle (Definition 1 below). While the predominant surface topology information is encapsulated in the ridges, the wrinkle's contour, defined by the boundary of concave and convex surfaces (Definition 2 below), is also important, especially when parametrizing wrinkles. Since the convex ridge defining the wrinkle is surrounded by a concave valley, we can detect this convex/concave boundary in order to segment the wrinkle 2 .
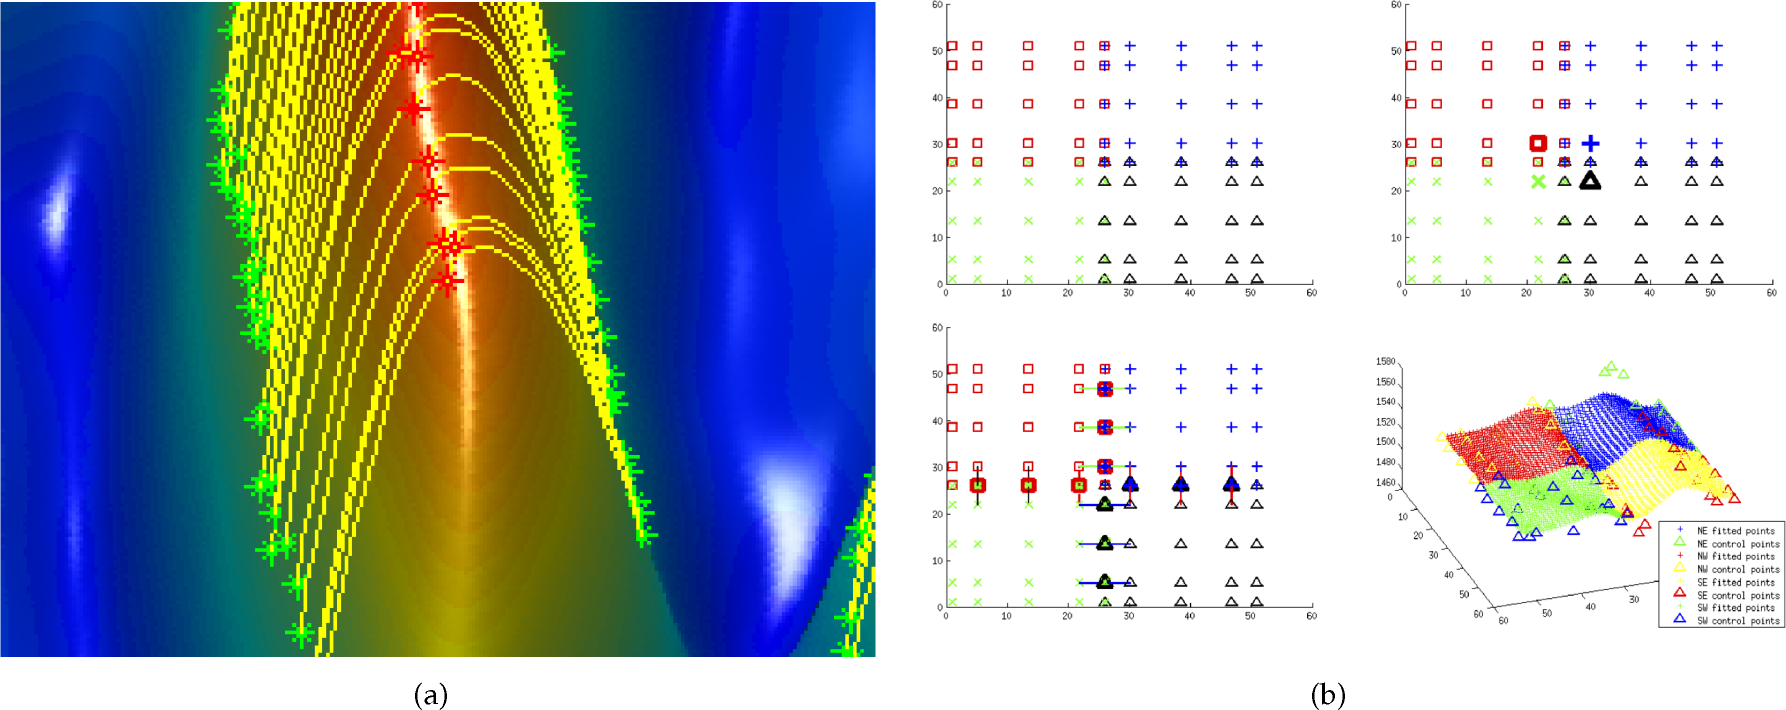
In Fig. 3(a), a close-up example of triplets is shown, in which each ridge point (red) is matched with its two corresponding contour points (green). In Fig. 3(b), the 3D points are represented as stars and the uniform distributed control points are represented as triangles. In the upper-left figure, C0 continuity is achieved by coinciding boundary control points. In the upper-right figure, adjust the four inferior points (in bold face). Then, in the lower-left figure, enforce the control points in the boundary as the midpoint in horizontal and vertical direction. Finally, in the lower-right figure, joining result with C1 continuity is shown.
We detect the positive extrema of maximal curvature (ridges) by thresholding and, in order to detect wrinkles of different magnitudes, the ridges are detected at different scales. More specifically, given a range map I, we construct a Gaussian Pyramid [37] of three layers
where the first derivatives (
We then detect the positive extrema of maximal curvature in each scale

In Equation 5,
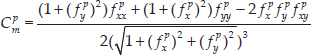
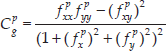
Shape index [28] performs a continuous classification of surface regions into a real-valued index value S in the range [-1,1]. The shape index value is quantized into nine intervals corresponding to nine surface types – cup, trough, rut, saddle rut, saddle, saddle ridge, ridge, dome, cap. Among all the shape types, ‘Ridge’ is critical in the analysis and description of wrinkles. The shape index value

where

(a) Piece-wise B-Spline surface fitting result of the range map of a segmented cloth. The high-frequency noise and coarse surface are removed via B-Spline surface fitting. In our implementation, the size of square patch is 25×25. This result is obtained by overlaying 10 times and, for each overlay, all square patches shift one pixel in both u and w directions. (b) In our implementation, the radius of the majority ranking filter is set to five pixels. The boundary of convex and concave regions is used to detect the wrinkle's contours in the last section, whilst the ‘ridge’ region (shown as yellow) is highly instrumental for the wrinkle grouping and triplet matching. (c) The topology of the clothing surface, where red points refer to ridges and green refer to the wrinkle's contour. (d) The fitted wrinkles are shown.
Nine types of surface topology are labelled, four of which are convex (saddle ridge, ridge, dome, cap) and the others are concave (cup, trough, rut, saddle rut, saddle). Having estimated the shape index of the cloth's surface, the boundary of convex and concave surfaces can then be obtained. Following detection of the wrinkle's contour, a full description of the cloth topology can be obtained, an example of which can be seen in Fig. 4(d).
3.3.3. Wrinkle Detection
The wrinkle detection process consists of two steps: connecting ridge points into continuous segments and grouping segments in order to represent wrinkles. In the first step, neighbouring pixels are iteratively connected in the ridge map until contiguous segments are obtained. Specifically, for each ridge point, we first label it as an active point, then check its eight nearest neighbours to determine whether they are also ridge points. If the latter holds true, we join them together, label the new coming points to active points and remove the old points. This process will be executed iteratively until the segments no longer grow. After this process, the end points of segments are labeled as ‘active’ points. This first step is further described in Algorithm 3. The minimal l2 distance between every two active ridge points is used as the distance measurement between two segments (Eq.7):

where si,
The second step is to group the short segments obtained in the previous step into long wrinkles. This process is achieved by connecting the two closest segments iteratively, in which the distances between every two different segments (wrinkles) are measured by Eq.7. If two closest segments are in the same ‘ridge’ region, then they are grouped into a larger segment. This process is executed iteratively until wrinkles are constructed from ridge segments. More details are shown in Algorithm 4.
After grouping the segments iteratively, several large wrinkles can be represented as a set of ridge points. In order to filter ridge position estimates and interpolate missing ridge values, for each wrinkle a least-square-error polynomial curve is fitted along its ridge points, with the coefficients of this polynomial comprising the final representation of the wrinkle. An example of fitted wrinkles is shown in Fig. 4(d).
3.3.4. Quantification of Wrinkles
Even though wrinkles can be detected by the proposed cloth topology shape analysis and approximated by polynomial curves (as demonstrated in the previous sections), it is not possible to quantify wrinkles since the surface topology classification afforded by the shape index is invariant to the magnitude of the surface variation (e.g., curvature) by definition. In other words, salient and non-salient shapes indicate the same values in the shape index. In this paper, the height and width of a wrinkle are measured in terms of triplets, as defined in Definition 3. In this section, we describe the construction of triplets by matching ridge points with wrinkle contour points.
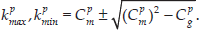
As explained in Definition 1, the maximal curvature direction θ can be calculated by Eq. 5. Given a ridge point pr in a range map I with scale
Under ideal conditions, every wrinkle (ridge) point should be matched with its two corresponding wrinkle contour points. Due to occlusions and noise, some wrinkle points (particularly those which do not have two non-empty wrinkle contour points) fail to find their associated contour points and therefore do not generate a triplet. For the robot cloth-flattening application, in order to determine the optimal flattening force, the height and width of a targeted wrinkle must be measured. In our approach, the three points comprising a triplet are used to measure the height and width; hence, only triplets that contain one ridge point and two non-empty wrinkle contour points are regarded as valid primitives for wrinkle quantification. An example of matched triplets is shown in Fig. 3(a). Now, given a triplet tp containing one ridge point pr and two wrinkle contour points

where a =
After measuring the height of the wrinkle, the length of a wrinkle can be measured by counting the number of its ridge points and a wrinkle score w can then be calculated as follows:

where Nr is the number of fitted ridge points in w, ti is the i th triplet of w and ht refers to the height of the triplet ti. This score is a monotonically increasing function of
3.4. Heuristic-Based Flattening Approach
Our flattening approach follows a single-arm flattening strategy. The goal is to eliminate the largest wrinkle by exerting a force on the border of the cloth. The flattening strategy was first presented in our previous work [6]. In this paper the strategy is more generic and has no constraint on the shape of cloth. More specifically, in each flattening cycle, all wrinkles are detected and ranked by Eq.9. The top-ranked wrinkle is then selected and its centre and endpoints are estimated along its principle direction via Principal Component Analysis. The perpendicular bisector of the wrinkle is then calculated from its centre and two endpoints. A force is applied to the intersection point of the perpendicular bisector and the cloth border (the closer border with respect to the wrinkle's centre) along the direction of the perpendicular bisector in order to flatten the cloth. It should be noted that, instead of applying a force of fixed magnitude, as in [6], the magnitude of the force is now related to the wrinkle's score in this implementation. A simulated flattening video demo is available at: https://youtu.be/Rd7hCUZaTx0. A real-life flattening video demo performed by our CloPeMa robot is available at: https://youtu.be/iOEto5Gy6vg.
4. Experiments
In order to demonstrate the effectiveness of our proposed features for parsing and representing deformable cloth surfaces, we embed them into a physical cloth simulator. The experimental validation consists of performing flattening experiments with eight random cloth configurations (shown in Fig. 5).

The eight flattening experiments, which first appear in [6]. They are generated by randomly grasping and dropping the virtual cloth onto a virtual table between one and five times.
The experiments comprise four parts: in section 4.1, we introduce the benchmark flattening experiments; in section 4.2, the halting criterion is presented, which determines when to terminate the flattening procedure; we then analyse the experimental results and give the conclusion in section 4.3; finally, in section 4.4, the proposed method is evaluated in the real robot testbed which supports the simulation experiment result.
4.1. A Benchmark Cloth-Flattening Challenge
We propose the design of a cloth-flattening benchmark challenge based on these eight crumpled cloth states (as shown in Fig. 5). Any method using the data must conform to the following two constraints:
As a result of the above two constraints, we restrict manipulation strategies to depend on the perceived state of the cloth and explore the relationship between visual perception and manipulation. It is also possible to develop generic perception-action loops capable of resolving more complicated manipulation problems based on these constraints. However, the above constraints ensure that the proposed benchmark challenge focuses on the cloth flattening task and on the representation and description of the cloth's geometry and topology.
4.2. Global and Local ‘Flatness’ Indexes
In order to evaluate the performance of our cloth-flattening approach, we propose two ‘wrinkledness’ (or ‘flatness’, i.e.,
In our experiments we observed a minimal value of ‘global flatness’ with a value of 0.373. Technically, all surface normals should be [0,0,1] in a completely flat case; hence the surface ‘instability’ measurement (entropy) should also be zero. However, as the cloth has non-zero thickness, the ‘instability’ measurement along the cloth edges is larger than zero. The value of 0.373 was then obtained by computing the ‘global flatness’ of a totally flat cloth in simulation. In order to find the maximal value of ‘global flatness’, we used a grasp-and-drop experiment, in which the simulated robot repeatedly grasps and drops the flattest region. The maximal ‘global flatness’ value obtained after 20 drops was 3.0127.
The minimum of the length of ridges for wrinkle fitting is set to 10 units and the minimum wrinkle height that can be detected is 15 units. In this case, the minimal value of ‘local flatness’ is
In order to track the state of the cloth ‘flatness’ during the flattening task, we record both the global and local ‘flatness’ at each iteration, shown in Fig. 6. In this figure, we linearly normalize the values of the two ‘flatness’ indexes to lie in the range from 100% to 0%, depending on their minimum and maximum possible values 4 . Specifically, the lines in Figure 6 with circular markers denote the change in ‘global flatness’ lines, with triangular markers indicating the change in ‘local flatness’, solid lines indicating the ‘flatness’ achieved by our geometry-based feature and the dashed lines indicating the ‘flatness’ achieved by the clustering-based feature.

Feature A refers to the geometry-based surface feature and feature B refers to the clustering-based feature. Red and blue lines show the global flatness of features A and B respectively. Yellow and green lines illustrate the local flatness of features A and B respectively. Feature A illustrates the geometry-based feature, while feature B, the clustering-based feature. In some experiments, the recorded flatness indexes are lower than 30, after no more wrinkles are detected. In the last figure (bottom right), the highest global and local flatness values are shown from the whole flattening process. The red markers show the approach using the geometric-based feature and blue markers, the approach using the clustering-based feature.
Among these eight experiments, we observe that, for both our features, the ‘global flatness’ scores correlate positively with the ‘local flatness’ scores during the flattening process. Even though both flatness scores exhibit different numeric ranges, we would expect to observe such temporal correlation between these scores if flattening was progressing for both scoring methods. The local flatness curves typically fluctuate more than the global flatness curves since the configuration of local wrinkles is not preserved (i.e., does not remain stable) after each iteration, as observed in Figure 6.
By closely inspecting the plots in Figure 6, it is noticeable that the geometry-based approach increases more rapidly than the clustering-based approach (especially in experiments 1, 2, 5, 6, 7 and 8) for the first 15 iterations. For ‘local flatness’, in most of the experiments (1, 3, 5, 6 and 8), the geometry-based approach (yellow curve on the charts) exhibits a rapid increase, while the clustering-based approach (green curve on the charts) usually fluctuates around 40% after approaching its best ‘local flatness’ score.
To explain the behaviour behind these curves, we select representative experiments for close analysis. In experiment 1, both feature extraction methods exhibit similar tendencies, but the geometry-based approach is always higher than the clustering-based approach (the red curve is always higher than the blue curve; the yellow curve is always higher than the green curve). We argue that this is due to an improved description and representation encoded in the geometry-based approach. In experiments 2, 5, 6 and 8, after approaching a relatively high degree of flatness (60% ‘global flatness’ and 50% ‘local flatness’), the clustering-based method demonstrates high variability (in the blue and green curves), which suggests that the clustering-based approach is not effective at measuring and flattening small wrinkles. In experiments 3, 4 and 7, the flatness (both ‘global’ and ‘local’) of the clustering-based methods decreases (the blue and green curves) after reaching maximum values. This suggests that the forces being applied to the cloth are no longer appropriate and are increasing, rather than reducing, the number of wrinkles on the cloth.
4.3. Evaluation and Comparison
We now consider a more objective statistical analysis of the experiments in Figure 6. We consider the efficiency, quality and stability of the cloth-flattening task. We define ‘efficiency’ to be how quickly the flattening strategy, using either feature type, can flatten the cloth to a relatively high degree of flatness. We define ‘quality’ to be the highest flatness value achieved at the end of the experiment and ‘stability’ to be how consistent the flattening approach is (i.e., how reliably the feature extraction approach can perform the flattening task).
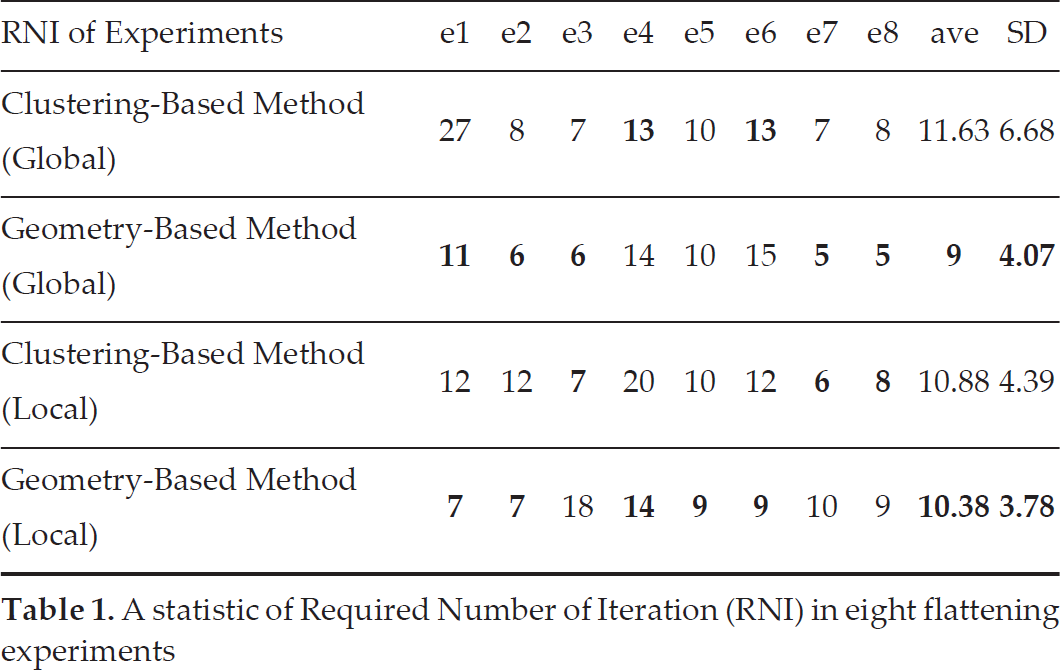
To compare ‘efficiency’, we observe the Required Number of Iterations (RNI) to reach 50% of global and local flatness. As shown in Table 1, the RNI of the clustering-based feature for ‘global flatness’ is equal to, or higher than, the geometry-based approach in six out of eight experiments. The average RNI of the geometry-based approach is 9.0, which is approximately 30% faster than the clustering-based approach (11.625). Likewise, the standard deviation (SD) of the eight experiments using the geometry-based approach (4.071) is also lower than the clustering-based approach (6.675). This indicates that the performance of the former is more stable over the eight experiments. We can therefore infer that the geometry-based approach can perform more efficiently than the clustering-based approach for cloth flattening.
A statistic of Required Number of Iteration (RNI) in eight flattening experiments
In order to describe the ‘quality’ of the task, the bottom right plot in Figure 6 shows the highest flatness score achieved in each experiment. In the figure, the x -axis corresponds to the ‘global flatness’ and the y -axis to the ‘local flatness’. Ideally, points should be in the upper right corner. Close inspection of this figure reveals that we can observe for ‘global flatness’ that the two feature approaches are very similar: the average ‘global flatness’ of the geometry-based approach (64.03%) is slightly higher than for the clustering-based approach (62.72%), as the ‘global flatness’ becomes less distinct when the cloth is relatively flat. Conversely, for ‘local flatness’, the flatness average achieved by the geometry-based approach (94.92%) is much higher than that scored by the clustering-based approach (62.69%)). This is because the geometry-based approach is more effective in flattening small wrinkles due to its accurate spatial location and size quantification. From this analysis, we conclude that the geometry-based approach delivers a greater degree of local flatness than the clustering-based approach.
We then investigate the ‘stability’ of the two flattening methods by computing the standard deviation (SD) of the differences in flatness at each iteration. Due to the instability in the local flatness (as discussed above), we only consider global flatness. The results presented in Table 2 reveal that the flattening process of the geometry-based approach has a lower SD than the clustering-based approach in seven out of eight experiments and the average SD of the geometry-based method (5.23) is 42.5% lower than the clustering-based approach (9.10). Therefore, we conclude that, compared with the clustering-based approach, the geometry-based approach is more stable.
The standard deviation of iteration differences of ‘global flatness’ in eight flattening experiments. The lower SDs are in boldface.

Overall, by comparing the results of the three experiments described above, we conclude that the geometry-based approach outperforms the clustering-based approach in all three measures we have considered.
4.4. Validation in Robot Testbed
Additionally, we integrated the proposed method into a real robot testbed in order to evaluate the real function of our virtual clothes manipulation system. In this part of the experiment, eight single-arm flattening experiments are conducted for each feature representation method and the results are presented in Table 3. To be specific, depth data are acquired by ASUS Xtion Pro and the 50% ‘global flatness’ is used as the halting criterion. The results of the real robot experiments conform with those obtained from the simulated experiments. The average RNI of the geometry-based feature for completing a flattening experiment is 8.8, which advances the performance of the clustering-based feature (average RNI is 12.88). As we mentioned, it is impossible to duplicate the same cloth configurations for comparison, whereas the results of real robot flattening experiments underpin the reality of simulated flattening experiments from the statistical perspective.
The Required Number of Iteration (RNI) of single-arm flattening in the real robot scenario. The halting criterion uses ‘local flatness’.

5. Conclusion
In this paper, we have presented a novel geometry-based feature extraction approach for deformable clothing manipulation that advances the state of the art in autonomous robot visual perception. Our approach is able to parse the geometric shape information presented by the garment's surface in order to detect and extract high-level wrinkle features. Furthermore, our approach is capable of parametrizing and mapping these wrinkle features sufficiently accurately to allow them to be used in robotic grasping and flattening tasks involving the manipulation of garments and flexible materials.
Our validation comparison of geometry-based features with our previous clustering-based features, based on flattening simulated wrinkled cloth using the same flattening strategy for both types of wrinkle features, indicates that the geometry-based visual perception outperforms our clustering-based features in a robot flattening task. Based on the evaluation of flattening ‘efficiency’, ‘quality’ and ‘stability’, the comparison results indicate that improved cloth flattening performance can be achieved by means of improved visual perception of the key wrinkle structures in terms of their detection, localization, parametrization and mapping. In turn, improved cloth configuration interpretation facilitates the estimation of the flattening actions (force localization, magnitude and direction), which thereby improves the performance of the flattening strategy.
In our ongoing and future research work we plan to investigate more complex manipulation skills based on using the features presented in this paper. In particular, we plan to investigate the feasibility of estimating the physical parameters of clothing items through visual perception in order to duplicate realistic simulation for a specific targeted garment. We then propose to investigate learning clothing manipulation skills from physics-based simulation and to verify the learnt skills using a real robot and real clothing.
Footnotes
6. Acknowledgements
1
The changing of first order derivative is continuous.
2
In this paper, the definition of a ridge is the same as that given by Ohtake [27]. The surface shape categories are classified into nine types of surfaces using shape index[![]() ].
].
3
In our implementation, σ is 0.8 and the template size is 7×7.
4
As we mentioned in the definition, the ‘flatness’ is inversely related to the wrinkledness values. Hence the minimal value corresponds to 100% flatness and vice versa.