
Abstract
Building a map of the environment is a prerequisite for mobile robot navigation. In this paper, we present a semantic map building method for indoor navigation of a robot using only the image sequence acquired by a monocular camera installed on the robot. First, a topological map of the environment is created, where each key frame forms a node of the map represented as visual words (VWs). The edges between two adjacent nodes are built from relative poses obtained by performing a novel pose estimation approach, called one-point RANSAC camera pose estimation (ORPE). Then, taking advantage of an improved deformable part model (iDPM) for object detection, the topological map is extended by assigning semantic attributes to the nodes. Extensive experimental evaluations demonstrate the effectiveness of the proposed monocular SLAM method.
1. Introduction
Map building of the environment is a prerequisite for mobile robot navigation. In order to accurately plan a path in an environment, a mobile robot needs to know where it is and how to get to a specified destination from an initial location. The process of simultaneously tracking the position of a mobile robot and building a map of the environment is known as simultaneous localization and mapping (SLAM). SLAM is one of the most important topics in the robotics community. There are two major aspects that need to be considered when employing a SLAM system. One is pose estimation based on sensor data and the other is reconstruction of the surrounding environment, such as objects, or other featured landmarks. In recent years, numerous SLAM algorithms have been performed. Davison et al. [1] proposed a real-time algorithm, called monocular SLAM, which can recover the 3D trajectory of a monocular camera. In the system, they utilized an extended Kalman filter (EKF) to update the estimation of the robot poses as well as the map of the landmarks in the environments recursively, achieving real time but drift-free performance. Clemente et al. [2] used a hierarchical map technology to create a SLAM system for wide-range environments and the approach was tested at the Oxford University campus. In the work carried out in [3], a GPU-based method was employed for feature detection, description, and matching procedures in order to attain a higher processing speed. Firstly, an 8-point algorithm was adopted to initialize the coordinate system. Then, the 3D coordinates of the feature points were calculated based on triangulation and the poses of the camera were estimated by the RANSAC method [4]. Finally, the poses and the 3D coordinates were optimized by bundle adjustment [5]. In [6], a vanishing points- and vanishing lines-based SLAM system was proposed. The method can effectively eliminate attitude drift in indoor environments and obtain real-time performance. In addition, a multiple sensor fusion-based SLAM approach has been widely studied. Shkurti et al. [7] used the measured values of an inertial measurement unit (IMU) on a robot to estimate the robot's poses based on an EKF framework, where the IMU measurements provide initial estimates of vehicle dynamics. By integrating camera data, these drifting IMU estimates can be weakened. Mingyang et al. [8] proposed a method that fused IMU with a vision sensor. The SLAM system has been tested in an outdoor environment and was proven to be robust for navigation lasting more than 2,000 metres.
Most of the works mentioned above focus on how to estimate robot poses. However, the representation of the environments derived in these works lacks semantic attributes, since the landmarks of the SLAM systems are generally 3D feature points. Although these systems can obtain satisfactory pose estimation results, the information gathered is not adequate for the implementation of intelligent tasks such as finding objects in an environment. Some studies tried to give the SLAM systems semantic information. In [9], a positioning scheme combining IMU observations with QR code recognition, which provides the robot with semantic information, was proposed to improve the location accuracy in an indoor environment. However, in the real scenario, QR code does not exist in many scenarios and we hope the robots can be competent enough to recognize real locations or objects, such as human beings. Galindo et al. [10] presented a multi-hierarchical approach to enable a mobile robot to acquire semantic information from its sensors for navigation. In this approach, the environment is represented from two perspectives: a spatial perspective that provides metric information for navigation and a semantic perspective that provides human-like knowledge of the environment. However, semantic landmarks, such as sofas and stoves, are simplified as coloured boxes in their experiments, which means the system is not competent for complex tasks in real environments.
In order to more comprehensively reconstruct the surrounding environment, object detection has been introduced to SLAM systems in recent studies. Zender et al. [11] proposed a semantic map for indoor SLAM. In this system, a laser range finder was used to create a metric navigation map and a vision sensor was utilized to recognize the objects or obstacles. It has been applied to a tour guide robot in a museum in the USA. Araki [12] proposed an online machine learning system that allows a robot to obtain semantic information by learning the fusion of visual and auditory features. Salas-Moreno [13] presented a real-time SLAM system. The system integrates a 3D object detection algorithm into the SLAM framework, which benefits from a depth camera and GPU operation. However, the systems described above often require expensive equipment and complicated data fusion algorithms.
In this paper, we present a semantic map building method for indoor navigation. Our approach is inspired by the work in [14]. Instead of using expensive and complicated sensors, the only sensor needed in our system is a monocular camera. The schematic diagram of the proposed semantic map is shown in Figure 1. While the robot is roaming in the environment, it captures a sequence of images in its path to build a semantic map for indoor navigation. During the semantic map building, we sample one image as the key frame from every 10 continuous images to represent one place and reduce computational burden at the same time. First, the SIFT features of the images representing a specific place are extracted and quantified into visual words (VWs)[15]. Then, a robust pose estimation algorithm, called one-point RANSAC camera pose estimation (ORPE), is proposed to recover the poses between adjacent key frames. Next, a topological map is generated using the VWs and poses. In the map, each place is represented as a node and each pose between two key frames forms an edge in the topology structure. Finally, semantic information is added to the nodes of the topological map using a novel object detection method. The proposed object detection method is an improved deformable part model (iDPM), introducing a kind of colour feature to the DPM [16], a state-of-the-art object detection approach that enables robots to have a better understanding of complex environments. Extensive experimental evaluations demonstrate the effectiveness of the proposed method. Taking advantage of the constructed semantic map, the robot can localize itself and successfully go to the desired places where specific objects are located. The main contributions of this paper are as follows:

In the proposed semantic map, each node represents a place of the robot trajectory, which corresponds to a captured image, and each edge is a pose matrix between two key frames
The proposed system does not require a motion model or other hardware instruments such as an IMU or GPS;
The proposed pose estimation method is more robust and accurate than previous approaches;
The monocular SLAM system with semantic information enables the robot to localize more effectively.
The rest of the paper is organized as follows: we introduce a topological map building method with a monocular camera in Section 2. In Section 3, the topological map is converted to a semantic map using the proposed object detection method based on the iDPM model. Section 4 describes the experiments and results. The paper is concluded in Section 5.
2. Topological Map
In this section, we describe the procedure of building a topological map using only a sequence of images. In the map, each node corresponds to a place in the environment and edges indicate undirected constraints between places. The nodes of the topological map are represented by visual features and the edges between the adjacent nodes are created using a frame-to-frame pose estimation method.
2.1 Node Representation
In this paper, we use visual words to represent the nodes of the topological map. First, the corner points of each image are detected by the Shi-Tomasi detector [17] and described by a SIFT descriptor [18]. Then, the SIFT features are quantified into a vocabulary tree, which is built by hierarchical k-means clustering. In the vocabulary tree, each cluster of the features is referred to as a visual word of a node. Each visual word is related to an inverted file. It maintains a list of image indices where the visual words occurred. Finally, the localization of the robot can be solved by image retrieval. Again, the SIFT descriptors of the query images are quantified into visual words and the similarities between the query images are calculated using the TF-IDF model [15].
2.2 Edge Generation
We propose a novel pose estimation algorithm, called one-point RANSAC camera pose estimation (ORPE) [19], to create the edges among the nodes of the topological map. A monocular image sequence captured by a calibrated camera is the only input to our SLAM system.
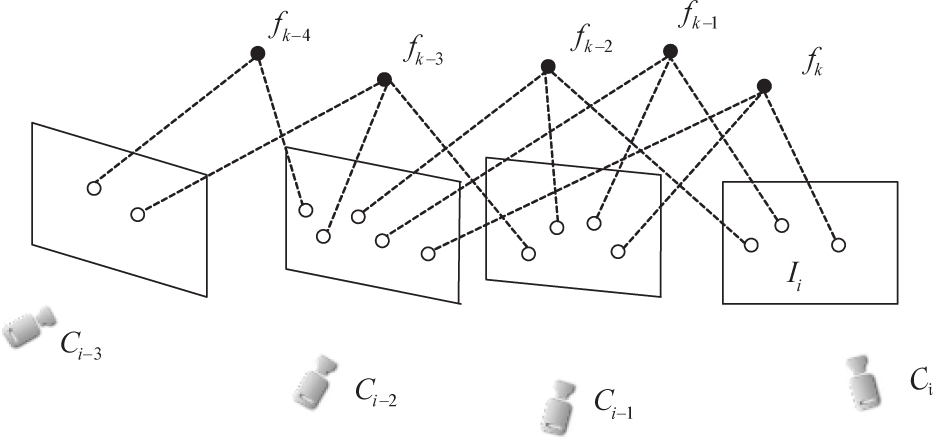
In Figure 2, frame Ii is taken at camera Ci in the world coordinate system, with a set of projected 3D points (denoted as f). The measurement of projections is in the form of (ui,vi,1), which represents the feature position in frame Ii plane, as shown in Figure 2. In the camera C i coordinate system, the origin is located at the focal centre Oi; the Z axis is the optical axis pointing towards the front; the X axis is parallel to the image u direction; and the Y axis is parallel to the image v direction. The world coordinate system W is aligned with the first camera coordinate system. The point feature's 3D coordinate is Xf= [xf, yf, zf] T in the world coordinate system. The relative pose from key frame Ii-1 to key frame Ii is the perspective projection matrix Pii−1, as denoted below:

where the rotation matrix is denoted as Rii−1 and the translation vector is denoted as Tii−1. Hence, poses between different camera coordinate systems can be transformed easily.
The sequence of images acquired with a camera
Our purpose for the monocular SLAM system is to estimate the camera poses P01 P02 … P0 i , as well as the 3D coordinates of the features viewed along the scene in the world coordinate system. The poses are saved in our semantic map to represent the map edges.
When estimating poses, the Shi-Tomasi [17] corner detector and SIFT descriptors [18] are used to meet the requirements of accuracy and stability, as well as efficiency in image matching. The SIFT descriptor is normalized by L2 distance. For every feature point in the last key frame, a region of interest (the neighbourhood of search region is set as 0.08×max (image width, image height) in our experiments) in the current frame is searched to get the nearest corner feature. Two constraints are employed to eliminate false matches: 1) the difference between the corresponding normalized descriptors is less than a threshold (0.4 in our experiments); and 2) one feature point can only have one correspondence. In addition, in order to extract more robust feature points, Gaussian blurring [20] was applied to each image, which has been illustrated to be effective in [21]. Figure 3 shows an example of a frame with and without this filter.
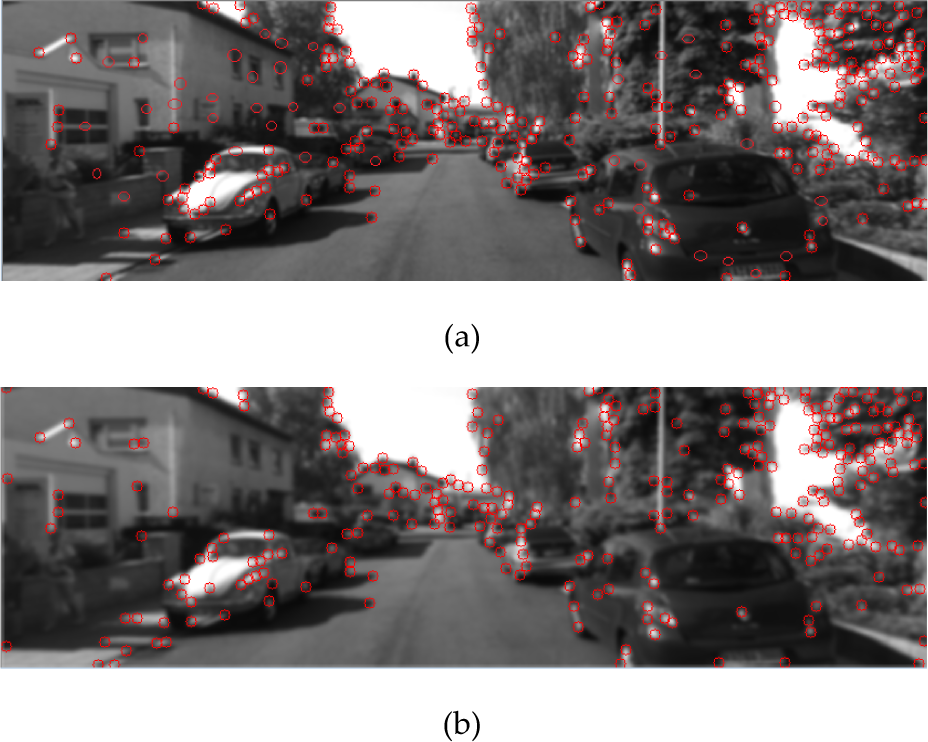
An example of (a) an original image in the KITTI data set and (b) its blurred image
The frames at a relative distance from each other with enough common points during the collection are selected as key frames. If the ratio between the number of matched points and that of the detected points is below a threshold limit (0.2 in our experiments), the current frame is discarded.
During initialization, the first two key frames and the distance between them are used to set up the world coordinate system. The C0 camera coordinate system is defined as the world coordinate system. The feature points from frame I0 are matched with the feature points from frame I1 to compute the fundamental matrix F using epipolar geometry [22]. The RANSAC algorithm is performed to find the best fundamental matrix and a rank-2 constraint is enforced because the determinant of a real fundamental matrix is zero.
Rotation matrix R and translation vector t (unit vector) can be recovered by singular value decomposition (SVD) of the essential matrix derived from the fundamental matrix [23]. There are four possible solutions of the rotation matrix and translation direction. We design a voting mechanism to choose the correct one, which uses the constraint that the reconstructed 3D points should lie in front of the cameras. The feature points are triangulated according to the first solution of the four candidate solutions. Each reconstructed feature point votes for a solution using the method in [23] and the one with the highest score is selected as the correct solution. Thus, the rotation R10 and translation direction t01 (unit vector) are determined. The translation distance (denoted as s), which determines the subsequent key frames' translation scale, cannot be recovered by monocular vision without additional information. In our research, the distance between the first two cameras is known. Then with T01=st01, the pose P01 is determined according to equation (1).
Once the pose P01 from C0 to C1 is estimated, the corresponding points' 3D coordinates in the C1 coordinate system are computed by triangulation. Then, the Levenberg-Marquardt (LM) algorithm is used to optimize the rotation matrix and the translation vector by minimizing the projection error of points in the current key frame I1.
Suppose the poses of cameras C0 to Ci-1 are previously estimated. Currently, frame Ii and the last key frame Ii-1 are matched to determine a set of corresponding points. The points whose 3D coordinates are known in Ci-1 (denoted as Mk) are used to estimate the relative pose between Ii and Ii-1 in a RANSAC framework.
As illustrated in Figure 4, Xf is one of the selected eight points whose 3D coordinates are known in the Ci−1 coordinate system; (u, v) is the projection of Xf in frame (u0, V0) is the principle point of frame Ii, Oi is the focal point of frame Ii and f is the focal length.

The collinear constraints of three points
According to the projection constraint (u – u0, v–v0, f), Oi and Xf are collinear and the constraint equation is shown as:

where [x, y, z] T is the coordinate of Xf, [x0, y0, z0] T is the coordinate of Oi and c is a coefficient. According to the coordinate transformation equation, we get:

where s is the translation distance. Substituting equation (3) into (2), we get two solutions for s:

and

where Rij is the i-th row and the j-th column element in the rotation matrix Rij and [tii–1] k denotes the k – th element in unit translation vector tii−1. Either (4) or (5) is sufficient to recover s. Thus, from eight matched points of two frames, there are 16 possible distance solutions. We find the best solution according to the following strategy. At first, the projection of the corresponding points in the Ii frame plane can be calculated according to:

After that, we define the corresponding points as inliers, while the projection error is
Among all the matches in Mk, the points whose reprojection errors are less than a threshold (2.0 in our experiments) are classified as inliers. If the number of inliers is more than the previous iteration, the inliers Rii−1 and Tii−1 are stored. After one RANSAC iteration, the Levenberg-Marquardt (LM) algorithm is performed to optimize the six parameters (three for orientation and three for translation) by minimizing the reprojection errors in the Ii frame plane. The new corresponding points (i.e., those whose 3D coordinates are not known) are reconstructed using a standard triangulation method.
Considering computational efficiency, it is unnecessary to try every possible sample in RANSAC. The RANSAC procedure is repeated until a satisfying solution is obtained. This can be defined as a probability in excess of 99% that a good subsample was selected, as defined as:

where p is the probability of this iteration, w is the fraction of inliers, k is the number of sampled features and m is the number of trials.
In [24], Wu et al. proposed an approach to camera pose estimation with structure from motion (SfM) and projection transformation. Their method is similar to ours except for the fact that they use two RANSAC cycles to estimate the pose. In Wu's method, one RANSAC is used to find the best fundamental matrix and the other to recover the distance; we call it TRPE (two RANSAC camera pose estimation) in the following for convenience. The TRPE suffers from a geometry degeneration issue. The common cases for geometry degeneration are small translation distance between cameras or all points lying on a single plane. The experiments in Section 4 will show that our ORPE method can avoid the problem. TRPE uses two RANSAC schemes to find the best fundamental matrix, but the best fundamental matrix does not always fit the projection transformation. When the rotation matrix and translation direction recovered from the best fundamental matrix are ambiguous, the translation distance estimation will fail. In contrast to the TRPE method, ORPE uses one RANSAC cycle to find the best rotation matrix and translation vector by minimizing projection error, so the geometry degeneration in the fundamental matrix can be avoided.
While the pose estimation algorithm is proceeding, we add a local N (N is the number of key frames to perform local bundle adjustment) length bundle adjustment [25] to optimize our pose estimation results. When a new key frame is added to the system, the local bundle adjustment operates to refine the estimation results by minimizing the cost function (the sum of selected 3D point projection errors in Ci–n+1 to Ci):
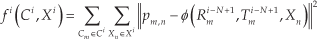
where the 3D points are in the Ci–N+1 coordinate system; pm,n is the n-th 3D point of the Xi projection in the m – th frame plane and ϕ is the function of estimated projections of points Xn through Rmi-−N+1 and Tmi−N+1.
We employed bundle adjustment on pose estimation rather than relying on a filtering approach. The 3D points are pulled back to the right position and the rotation matrix and translation vector are optimized by minimizing the projection errors.
In summary, the pose estimation algorithm is implemented as follows:
Given the first two key frames and a global scale, use the 8-point algorithm and a RANSAC framework to set up the world coordinate system and the corresponding points' 3D coordinates.
Retrieve a new frame by detecting the corner points and match them with those of the last key frame. If the number of matched corresponding points is less than a threshold (0.2 in our experiments), repeat from Step 2).
Use the matched corresponding points whose 3D coordinates have been recovered to estimate the pose between the last key frame and the current frame in one RANSAC framework.
Randomly sample eight corresponding points to calculate the essential matrix K by 8-point algorithm and camera intrinsic matrix. Recover rotation matrix and translation direction from essential matrix.
Calculate the 16 translation distances, locate the best one and then recover the translation vector.
Calculate the inliers of corresponding points according to the recovered rotation matrix and translation vector. If the confidence is larger than a fixed threshold (0.99 in our experiments), save the rotation matrix and translation vector and go to Step 4). Otherwise, if the number of inliers is larger than that of the previous iteration, save the rotation matrix and translation vector and repeat from Step a) until a certain number of iterations have elapsed.
Calculate the median inter-distance from the recovered rotation matrix and translation direction. If the median is greater than a fixed level (100 in our experiments), repeat from Step 2).
Apply the LM algorithm to refine the rotation matrix and translation vector by minimizing reprojection errors using the inliers (the points whose reprojection errors are less than 2.0 are classified as inliers).
Use the standard triangulation method to reconstruct the corresponding points whose 3D coordinates are unknown. Remove the reconstructed 3D points whose depth value is extremely large or negative.
Add this key frame (the inlier corresponding 3D points, reconstructed corresponding 3D points, rotation matrix and translation vector) to the bundle adjustment to optimize the estimated pose and the reconstructed 3D points.
Go to Step 2) until all frames are calculated.
The estimated poses among nodes are used to create the semantic map, which will be illustrated in Section 3.4. Figure 5 demonstrates the above procedure of pose estimation from two frames. Partial occlusions may affect the performance of the algorithm. In order to improve its robustness, when the occlusion occurs only in a few frames, our algorithm will simply flag these frames as non-keyframes and continue to find the next key frames to match. The proposed algorithm is robust to partial occlusion; however, if the occlusion occurs for a long time, which rarely happens in practice, our algorithm might fail, since the correspondences between the two key-frames would be difficult to establish.

An illustration of the pose estimation procedure for two frames
3. Object Detection Based Semantic Map
Object detection is one of the great challenges of computer vision and consequently has received extensive attention. The sliding-widow based object detection is one of the most common modern approaches that scan the image for candidate objects and score each one. In [26], Felzenszwalb et al. presented a DPM model for the object detection field. This algorithm has been proven to be an efficient method in the sliding-window framework, which makes it popular for object detection. However, most approaches to object detection and image patch classification rely on intensity-based features without colour information in the image [16, 27–30]. In this paper, we present an improved deformable part model (iDPM) for object detection by combining the histogram of oriented gradients (HOG) feature with colour attributes. The detection results are assigned to the nodes of the topological map as the object attributes to generate the final semantic map.
3.1 Deformable Part Model
The deformable part model uses a sliding-window method for object detection. The model employs a rectangular bounding box, which contains image feature vectors, called filters, to represent a specific class of objects. To cope with the variety in non-rigid deformation of the objects in natural images, the DPM utilizes part models and deformable features to represent the type of objects, inspired by the spring structure of a man's face [31]. As shown in Figure 6, the position of organs on a face can move in a small range. Moreover, since the appearance of an object might have a big difference due to the change of the camera to the shooting angle, the DPM model uses a mixture model to discriminate and match objects in several angles.

A spring-like face model proposed by Fischler and Elschlager [31]. In this model, the organs in the human's face are not rigid. They can vary in an acceptable distance range. The deformable part model uses this idea to represent similar types of objects.
There are three sub-models in the DPM: a root filter describes the whole shape feature of a specific object (the left column in Figure 7), the n part filters describe the detailed part shape feature of the object (the middle column in Figure 7) and the relative position of the root filter and the part filters (the right column in Figure 7). In Figure 7, each row is a component, which means an independent model for one angle. The whole model is a mixture model, which fuses three sub-models. When detecting, the model slides in the detection image feature space from left to right, top to bottom. It decides whether there is an object or not according to the matched score of a position. The matched score is given by a dot product:
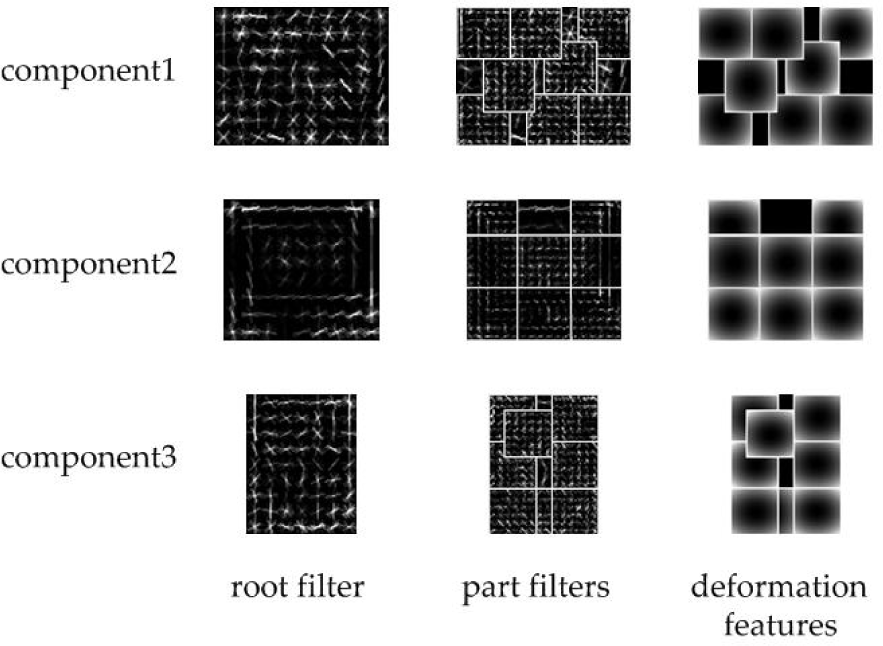
The visual examples of a trained deformable part model for a TV monitor. Each row is a component of the model. The columns from left to right are root filters, part filters and deformation features respectively. In this model, we can see that the outlines of the TV monitors in the root filters for the three components are rectangles. Each component has several part filters and each part filter is shown in a rectangle with a white edge. In the right column, the centre of each rectangle with a white edge is the ‘anchor’ position for the centre of the corresponding part filter.

where

is a vector of model parameters and

is a feature vector of the input image. Fi' denotes the HOG features of the root and the parts models and di is a four-dimensional vector specifying coefficients of a quadratic function defining a deformation cost for each possible placement of the part relative to the ‘anchor’ position. The bias term b is a label of a component of the mixture model. ϕ(H, pi) are HOG features of input images at different positions, and pi and ϕ d (dx, dy) = (dx, dy, dx2, dy2) are deformation features.
Note that if di = (0, 0, 1, 1), the deformation cost for the i – th part is the squared distance between its actual position and its ‘anchor’ position relative to the root. The way to train the model β is in a L-SVM approach, which is raised and specified in [16] and [26].
3.2 Feature Representation
In this section, we describe the HOG feature for facility of understanding. A HOG feature is originally a 36-dimensional vector, as introduced in [27]. We use an alternative 31-dimensional HOG feature for the DPM model, which captures the essential information of images. HOG features are based on small spatial regions located in the images. Each 8 × 8 pixel region, which is called a cell, accumulates a local histogram of gradient directions over the pixels. Each 2 × 2 cell region, which is called a block, accumulates a measure of local histogram energy over larger spatial regions and uses the results to normalize all of the cells in the block.
Firstly, each pixel calculates a weighted vote for an orientation histogram channel based on the orientation of the gradient element centred on it and the votes are accumulated into orientation bins over cells (i.e., local spatial regions). The orientation bins are evenly spaced over 0°–180° to generate nine contrast-insensitive orientations and 0°–360° to generate 18 contrast-sensitive orientations. To reduce aliasing, votes are interpolated bilinearly between the neighbouring bin centres in both orientation and position. Then, we compute four normalization factors for a cell in a measure of its local histogram energy. We can write these factors as:
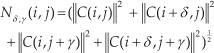
where C(m, n) (m ɛe{ i, i+δ}, n ɛ {j, j + γ}) is the feature vector of the cell in the position of (m,n), δ, γ ɛ {-1, +1}, 0≤i≤[(w - 1)/k], 0≤ j ≤ [(h - 1)/k] and w and h are the width and height of an image. Let k >0 be a parameter specifying the side length of a cell. In this paper, we set k =8.
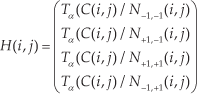
Suppose that Tα (v) denotes the component-wise truncation of a vector v by α. Each cell has a four-dimensional feature obtained by normalizing Nδ, γ(i, j) with respect to each factor followed by truncation. In this paper, α = 0.2.
Finally, the total dimensions of a cell feature are 9+18+4=31, with 27 dimensions corresponding to different orientation channels (nine contrast insensitive and 18 contrast sensitive) and four dimensions capturing the overall gradient energy in blocks around the cell. In order to detect objects in different scales, the HOG features are represented in a feature pyramid and the part features are computed at twice the resolution relative to the root features.
3.3 Improved Deformable Part Model
Most approaches based on the DPM model rely on intensity features, which ignores the colour information of the images [16, 27–29]. In this section, we describe a novel detection method to improve the DPM's performance by combining HOG features with colour attributes. Berlin and Kay [32] presented a linguistic study and concluded that there are 11 basic colours, called colour names (CN), i.e., black, blue, brown, grey, green, orange, pink, purple, red, white and yellow. In digital images, CN is an 11-dimensional descriptor that denotes the probability colour for a pixel or a patch of an image. It can be defined as:

where

where P is the number of pixels in an image region, cni is the i – th name of colour and f(x) is the RGB value of a pixel x. Weijer et al. [32] obtained the relationship of the RGB values and 11-dimensional colour name vectors by the PLSA approach based on the Google dataset and saved the relation matrix in a document. In this paper, we query this document to get the colour name feature of each pixel of an image and expand the HOG features by connecting the 11-dimensional vector to the 31-dimensional HOG vector for the image cells.
Therefore, the proposed model for object detection is integrated by two sub-models: a shape model and a colour model.
The shape model is the same as the original DPM model, while the colour model indicates what is the most probable colour of the blocks. A TV monitor colour model is shown in Figure 8. The left column is three root filters with different length-width ratios for the TV monitor and the right column is the corresponding part filters, respectively.

The colour model of a TV monitor. Similar to a shape model, each row is a component of the model and each component includes a root filter and part filters.
The main steps of our object detection method based on the DPM model are illustrated as follows:
Step 1: Extract the CN-HOG features of the images in the training dataset and train the parameters of the colour model.
Step 2: Integrate the shape model and the colour model into a new model.
Step 3: Detect objects by the shape model.
Step 4: Calculate the CN histogram in the bounding boxes in Step 3.
Step 5: Eliminate the detection results that cannot match the colour model according to the cosine distances between their CN histogram and the colour model.
3.4 Semantic Map Building
After the object detection and the pose estimation, a semantic map can be created by fusing the information of object categories and poses into the topological map. In our system, the information of the semantic map is saved in a matrix, as illustrated in Table 1.
The matrix elements of the semantic map
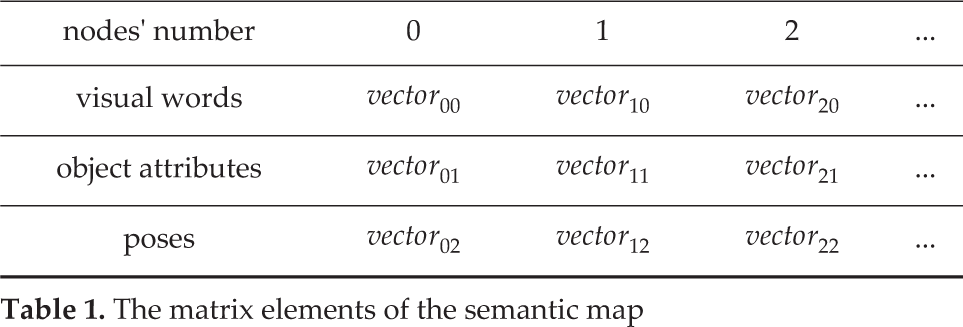
The matrix contains the number of the nodes and their corresponding visual words, object attributes and poses. Utilizing this semantic map, a robot can locate itself and reach the places of the specified objects.
4. Experimental Results
In this section, we illustrate our experiments and results in self-localization, pose estimation, object detection and navigation. The P3-DX robot platform used in our experiments is shown in Figure 9. In order to better illustrate the navigation results, we utilize the laser range finder to depict the outline of the environment in our lab.

The P3-DX robot used in our experiments
4.1 Self-localization
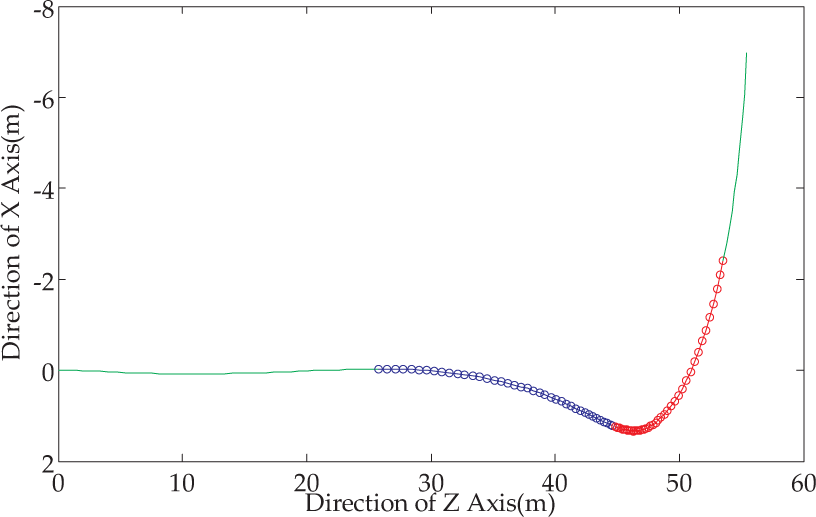
In order to test the capability of the vocabulary tree for robot localization, we performed an experiment over two groups of datasets. One is the 2011_09_26_drive_0035_sync dataset from the KITTI vision suite [33], which includes two image sequences captured by stereo cameras from a car at the same time; the other dataset was acquired by running the P3-DX robot in our laboratory environment in a similar closed loop twice. Each loop includes more than 5,500 images. An illustration of route curves is shown in Figure 10. We compared our method with the SeqSLAM proposed by Milford et al. [34], which achieves promising performance over the Nurburgring and Alderley datasets.

The route curves of the two loops in a laboratory environment. The red one represents the loop for creating the image dataset. The blue one represents the loop for querying images.
In the experiment on the Lab dataset, a vocabulary tree is created using the images sampled from every 10 images of the first sequence. To demonstrate the effectiveness of the vocabulary tree in robot self-localization, the images in the second sequence are used for matching with those from the first sequence. In this paper, when constructing the vocabulary tree, we set the number of branches k in the hierarchical k-means clustering algorithm as 10. As demonstrated in [15], when k increases from 10 to 1,000, the precision only improves a small amount. In addition, for the k-means algorithm, the computational cost will increase with the increase of k. In our experiments, when k = 10, the size of the dictionary is 136MB, which yields satisfactory results with less computational time.
Figure 11 shows the localization results of the two methods over the KITTI and Lab datasets. As shown in the figure, each image of the second sequence that is matched with the image corresponding to the same place in the first sequence is marked by a dot. The results of the proposed method are marked by red dots, while the results of the SeqSLAM are marked by blue dots. It can be seen that the SeqSLAM performs slightly better than the proposed method on the KITTI dataset, while our method performs much better than the SeqSLAM on the Lab dataset. Since the Lab dataset was acquired by using a single monocular camera at different times, there are more changes of viewpoint compared with the KITTI dataset, which leads to matching difficulties. The proposed method is more suitable for indoor navigation tasks.

Comparison of self-localization results on the KITTI and the Lab datasets. (a) and (b) are the results on the KITTI dataset; and (c) and (d) are the results on the Lab dataset.
4.2 Pose Estimation
The experiments were conducted on a Lenovo laptop with an Intel Pentium CPU T4400 @2.20GHz and 1.99GB random access memory. The IDE used is Microsoft Visual Studio 2010 VC++ with OpenCV 2.4.4. Our experiments were performed over the 2011_09_26_drive_ 0035_sync dataset from the KITTI vision suite [33]. The dataset is interesting because of a 90 degree turn on the left, people riding bikes and moving cars. The sequence is about 59 metres long. The benchmark data provide poses of camera 0 by GPS and IMU. The grey scale images of the camera 0 are used for our monocular vision pose estimation system.
4.2.1 Accuracy evaluations
Without local bundle adjustment, we choose frames 40–120 to estimate camera poses. In frames 40–79 the car is moving forward and in frames 80–120 the car is turning around an almost 90 degree left corner, as illustrated in Figure 12. The whole set of connected N (N =3, 5, 7, 9, 11, 13) frames are used to compute the orientation error and translation error [31].
The trajectories of the moving car according to the benchmark data. (The blue segment with square markers stands for moving forward and the red segment with circle markers stands for turning a left corner.)
For a specific N (e.g., N =3), all the N connected frames in frames 40–120 pose estimation errors are averaged. The error curves of the orientation and translation for all three approaches compared with ground truth are shown in Figure 13 and Figure 14. As illustrated in the experiments, ORPE and Grunert's method [35] perform better than the TRPE [24] in terms of accuracy. In the results of the three connected key frames, TRPE performs better than ORPE and Grunert, but the following results show that ORPE and Grunert outperform TRPE. ORPE and Grunert have better error accumulation suppression ability. Compared with Grunert, ORPE yields better accuracy in the estimation of both orientation and translation.
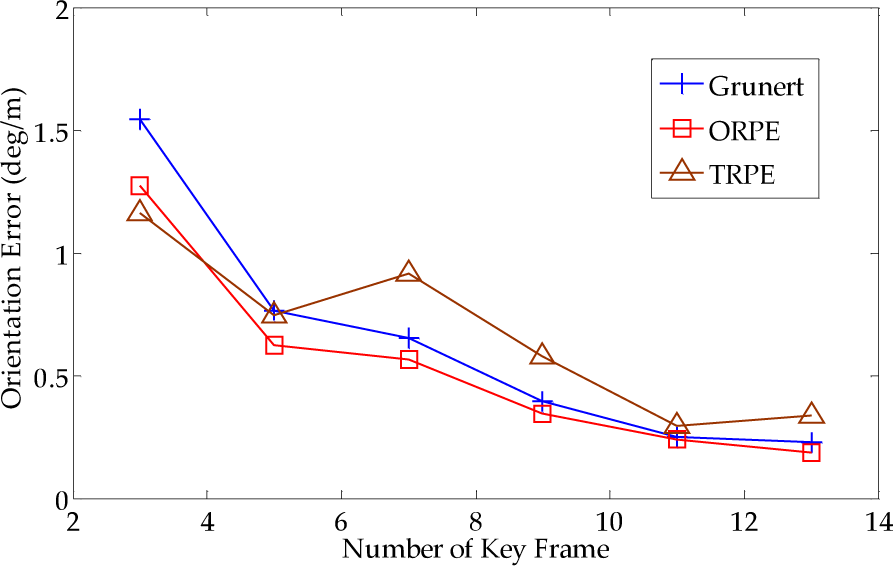
Orientation error of the dataset. The subset is from frame 40 to frame 120. The horizontal axis indicates the number of connected key frames and the vertical axis indicates the estimation error of orientation compared with ground truth. The distance between two consecutive frames is about 0.15–0.6m.

Translation error of the dataset. (The subset is from frame 40 to frame 120. The horizontal axis indicates the number of connected key frames and the vertical axis indicates the estimation error of translation compared with ground truth. The distance between two consecutive frames is about 0.15–0.6m.)
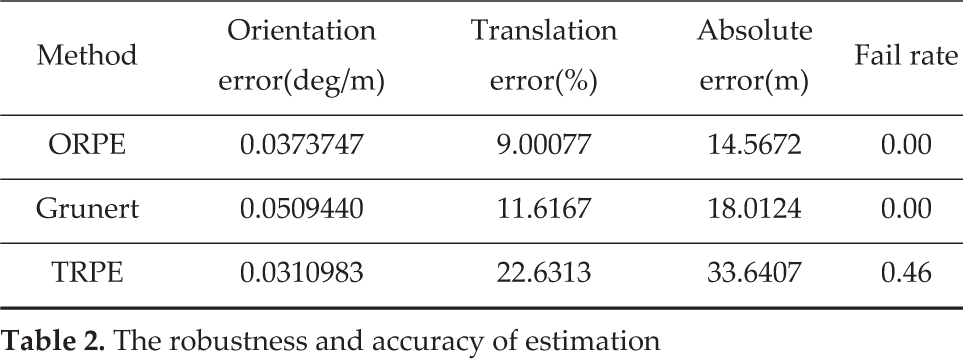
We tested the monocular SLAM system without local bundle adjustment [25] over the dataset. ORPE, Grunert and TRPE are used as the pose estimation method. If five connected frames fail in estimating their poses, the monocular SLAM fails. For each method, we performed 100 independent tests and counted the failure times. The results are in Table 2, where the absolute error is the distance between the last benchmark translation vector and the last estimated translation vector in the world coordinate system. As shown in Table 2, ORPE and Grunert can avoid problems with geometry degeneration, while TRPE experiences serious geometry degeneration.
The robustness and accuracy of estimation
4.2.2 Monocular SLAM with Bundle Adjustment Experiments
Our system has been compared with LibViso2-M [34] and Grunert's method (using our monocular SLAM system with Grunert's pose estimation method). For our system, six key frames were used for bundle adjustment and only the last two key frames' poses are optimized. Computational time includes feature detection and description time, matching time and pose estimation time. For key frames, processing time is longer because of incremental bundle adjustment. The estimated poses have been compared with the data given by GPS and IMU. As described in [34], the pose error consists of the orientation error and translation error.
Figure 15 illustrates the rotation estimation errors along the path length. During the 50–60 metres, the car is turning at the 90 degree left corner, as illustrated in Figure 12. LibViso2-M has the worst estimation result.

The rotation estimation error. The blue line is LivViso2-M; the green line is Grunert's method; the red line is our monocular SLAM system.
Because Grunert and ORPE use the same monocular slam system, the orientation errors are almost the same. In Figure 16, it is obvious that our monocular system with ORPE achieves the best result. Figure 17 illustrates the estimated trajectory on the plane, where the black line is the benchmark calculated by the GPS data, the blue line is the estimated trajectory of LibViso2-M, the green line is the estimated trajectory of our monocular SLAM system with Grunert and the red line is the estimated trajectory of our monocular SLAM system with our ORPE. Figure 18 illustrates the estimated height.

The translation estimation error. The blue line is LivViso2-M; the green line is Grunert's method; the red line is our SLAM system.

The trajectory. The black line is the benchmark data calculated by GPS; the blue line is LivViso2-M; the green line is Grunert's method; the red line is our monocular SLAM system.
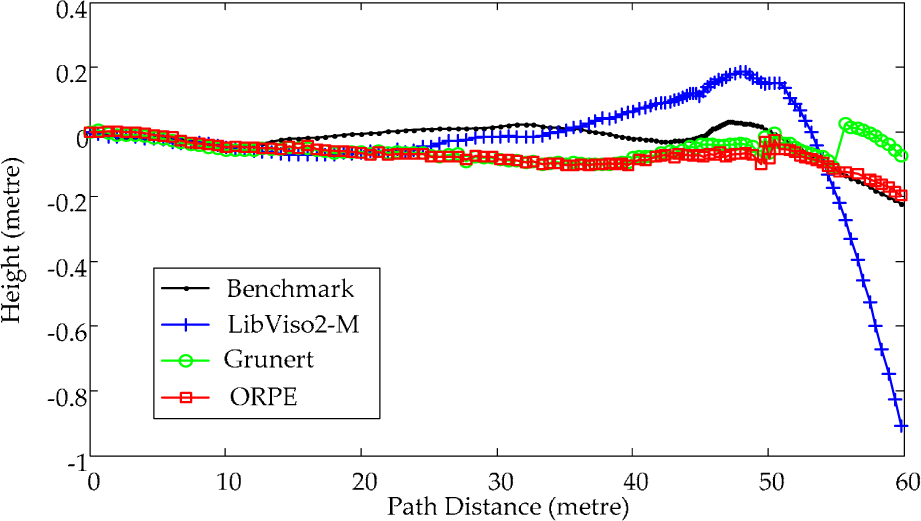
The estimated height of the camera. The black line is the benchmark data calculated by GPS; the blue line is LivViso2-M; the green line is Grunert's method; the red line is our monocular SLAM system.
Table 3 shows the absolute error and computing time for each frame. ORPE outperforms Grunert both in absolute error and relative translation error.
Absolute error and computing speed

4.3 Object Detection
In our experiments, we use two image datasets for training and testing: PASCAL VOC 2012 dataset [36] and indoor-scene-object dataset [37]. PASCAL VOC is a benchmark for recognition, classification and detection of visual objects. The indoor-scene-object dataset contains 1,045 images displaying bedroom, living room and dining room environments. In this paper, the number of components for each model is set at three and the side length of a cell is set as eight pixels.
Figure 19(a) shows the detection results of the TV monitor in the indoor-scene-object dataset. The left column is the results of DPM and the right one is the results of our method. As shown in Figure 8, since TV monitors are generally dark objects, our method can remove some light colour detection regions from the primitive results thanks to colour attributes. As we know, the colour of a TV monitor is black as a whole. But the DPM method only considers the shape features, so that some white or yellow regions are identified as TV monitors. Our method can effectively eliminate these areas. The similar detection results of the sofa are shown in Figure 19(b).

Some detection results of (a) TV monitor and (b) sofa. The left columns in (a) and (b) show the results of the deformable part model method and the right columns show the results of our method.
In addition, to evaluate our approach quantitatively, we use the standard metrics in [36] to get the precision-recall curve and average precision of the detection. The precision is the fraction of the reported bounding boxes that are correct detections, while recall is the fraction of the objects found. The proposed algorithm was tested utilizing a subset of the PASCAL VOC dataset. Figures 20(a) to 20(c) respectively reveal the detection P-R curves of the TV monitor, bottle and potted plant. The blue curves are the results of the traditional deformable part model and the red curves are the results of our method. Table 4 shows the average precision of the two methods for 20 categories of objects.
Average precision of different detection methods for 20 classes of objects. In most of these classes, our method performs better than the deformable part model.

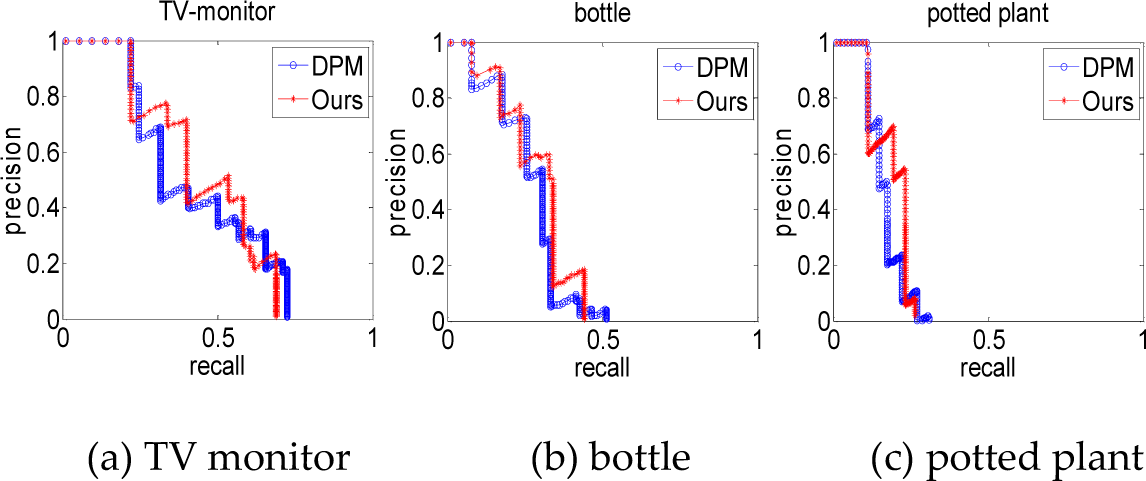
The detection P-R curves of three classes of objects
In Figure 20, it can be found that the precision of our method is better than that of the DPM method. Our method performs worse than the DPM method in terms of recall, while the precision is at a low rate (about 10% to 20%). This is because our method discards some candidate areas based on shape models, which may contain the correct detection areas. In practice, however, when the precision is low, the high recall of detection is totally insignificant. We pay more attention to the results with high precision as well as an acceptable recall.
4.4 Navigation
In Section 2, we proposed a monocular vision pose estimation algorithm and created a topological map for robot indoor navigation. In order to improve the intelligence and efficiency of robot navigation, we assigned each node of the topological map object attributes to create a semantic map using an improved deformable part model. The object detection algorithm is applied for every collected image and gives each node of the topological map a property, such as chair, table, or void. In this study, the models learned from PASCAL VOC were integrated in all applications. This is because PASCAL is a widely used benchmark, which includes a large number of samples. Thus, the models learned from it have good generalization ability. After completing the semantic map, the robot can navigate to the specific location with corresponding property via the help of the pose estimation algorithm. In practice, we refine the detection results by discarding the small bounding-boxes, since they stand for the target objects that are not close enough to the robot.
Figure 21 shows the detection results of the chair found in the key frames in our lab, based on the improved deformable part model. We can see that the property of the second key frame and the last three key frames is ‘chair’. In order to intuitively demonstrate our method for indoor navigation, we make the robot navigate from its original location to a destination, which corresponds to the detected key frame with the ‘chair’ property. As shown in Figure 21, the key frame with a yellow box is the original location; the key frame with a blue box is the destination. Figure 22 shows some false positive results. Some sample images including chairs in the PASCAL training set are shown in Figure 22(a), which are very close to those appearing in our lab. In the false positive regions discovered in Figure 22(b), the shape and colour of these regions are actually close to the chairs, which leads to the false recognitions.
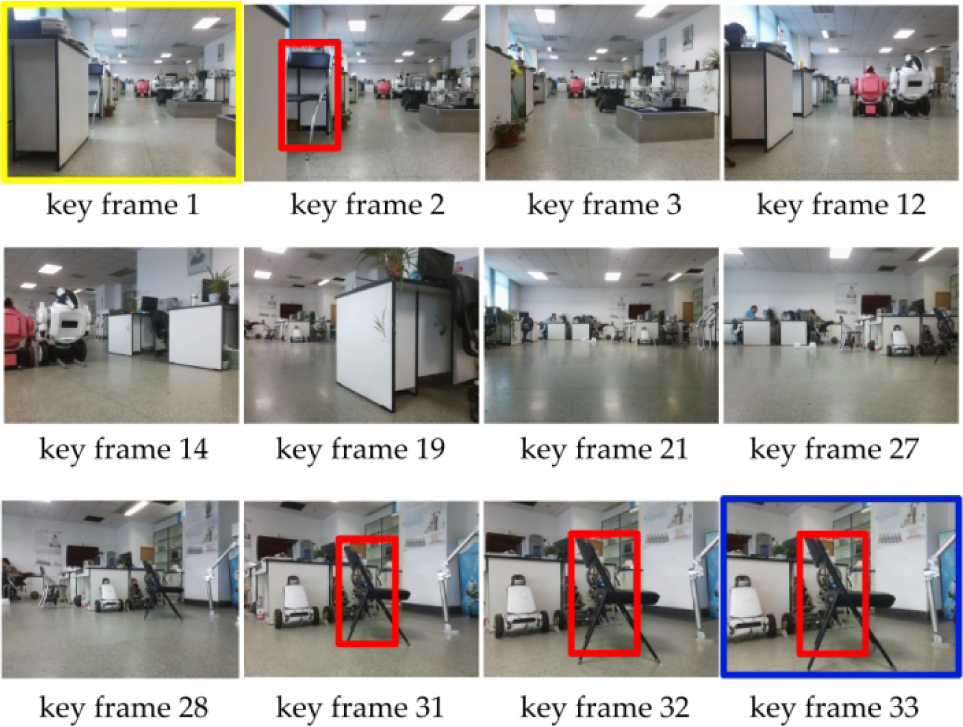
The detection results of the chair of the key frames in our lab based on the improved deformable part model. We eliminated some small detected bounding boxes in practice because they stand for the target objects that are far away from the robot. The key frame with a yellow box is the original location, while the key frame with a blue box is the destination.
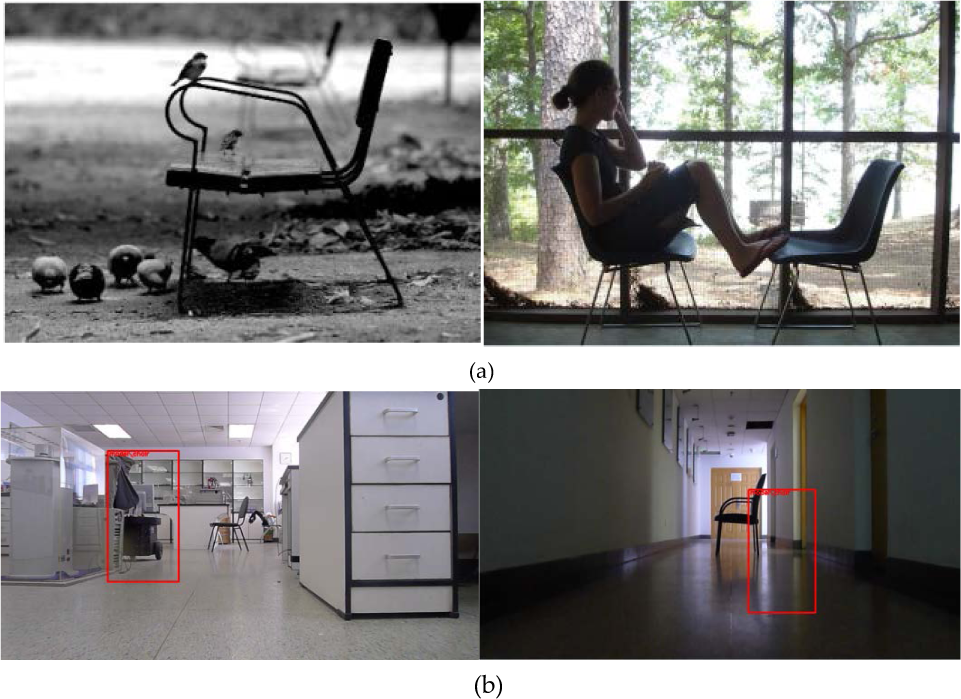
False positive regions discovered in our environment
Figure 23 shows the navigation results of the P3-DX robot using the image sequence captured in our lab as shown in Figure 21. The robot started at the place found in the first frame at the beginning and successfully moved to the last frame, which has a ‘chair’ property by conducting the monocular SLAM system. The metric map is obtained by the laser rangefinder equipped on the P3-DX robot.
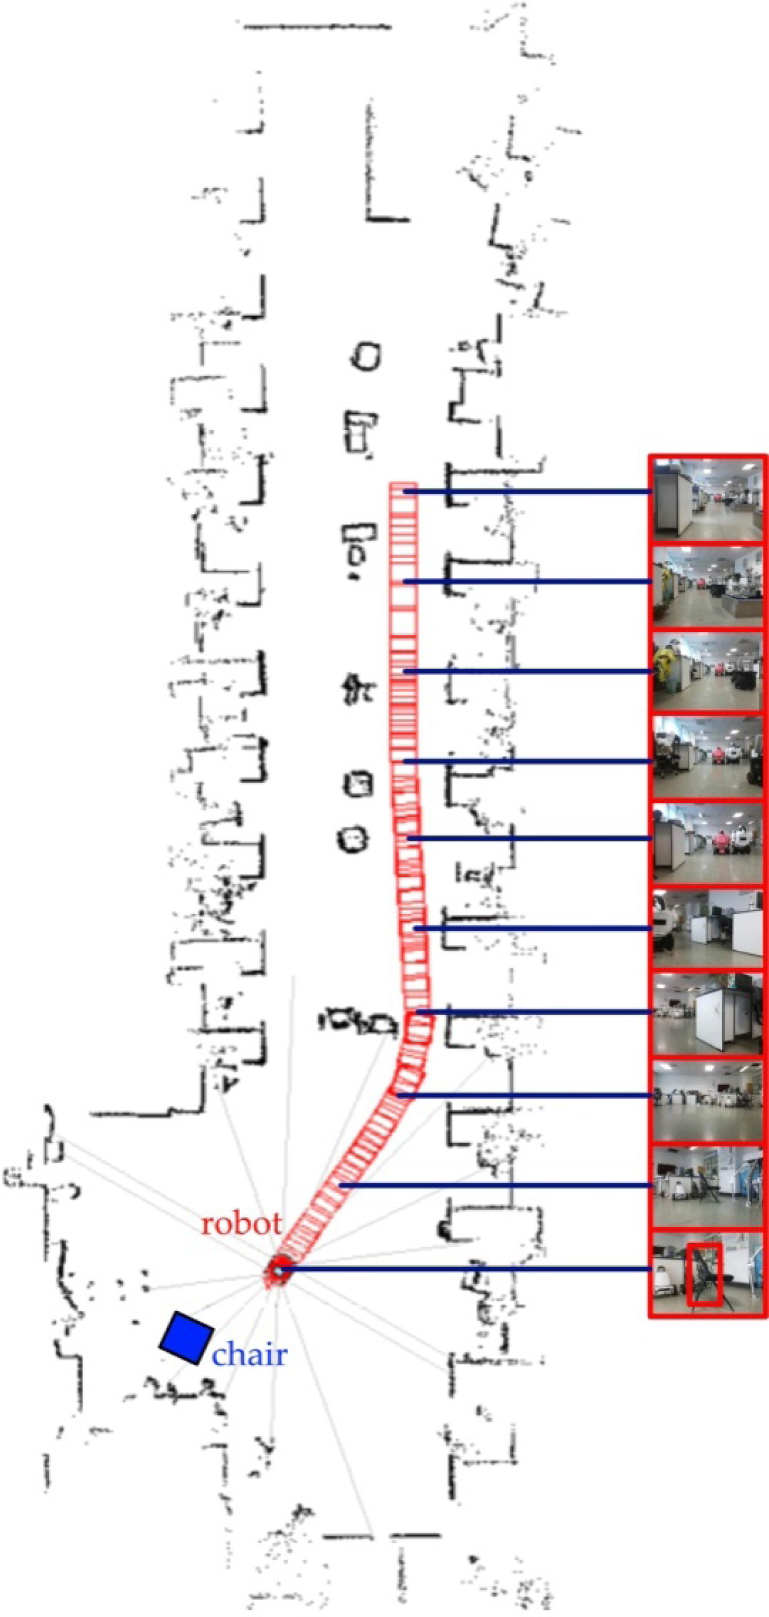
The navigation results in our lab environment. The red blocks indicate the trajectory of the P3-DX robot and the blue block is the ground truth location of the chair. The metric map is obtained by the laser rangefinder installed on the P3-DX robot.
5. Discussion
Map building of the environment is a key step for mobile robot navigation. We have introduced a semantic map building method based on object detection for indoor navigation. A vocabulary tree based method is presented for self-localization. The experimental results on the KITTI and the Lab datasets show that the proposed method can achieve promising performance in terms of localization precision. In particular, our approach performs better than the SeqSLAM method on the Lab dataset acquired by a single monocular camera in our laboratory environment. Compared with the KITTI dataset, the Lab dataset has large changes of viewpoint. Therefore, it can be concluded that the proposed method is more suitable for indoor localization. Moreover, a pose estimation algorithm using only one 3D point, called ORPE, is proposed to recover the poses between adjacent key frames when building the map. Experiments on the KITTI dataset demonstrate that the proposed method performs better than other counterparts. The common cases for geometry degeneration are small translations between cameras or all points lying on a single plane. Compared with the TRPE, our method can effectively avoid geometry degeneration issues owing to eliminating feature points and non-key-frames according to space and parameter constraints. In addition, an object detection method, named iDPM, is also proposed to add semantic information to the built topological map. Different from previous methods, the iDPM combines colour features with the DPM model, which enhances the performance of object detection. Taking advantage of the constructed semantic map, the robot can localize itself and successfully navigate to the desired places where the specific objects are located. Although promising results have been achieved, further research is needed to find a more efficient approach to build the semantic map, which is crucial in practical applications.
6. Conclusions
In this paper, we have presented a semantic map building system for indoor robot navigation. The image sequence captured by our monocular camera is the only input to the system. The semantic map is a topological structure whose nodes are represented as visual words derived from SIFT features and the edges between two adjacent nodes are represented with relative poses obtained by performing a novel pose estimation algorithm. In addition, we have proposed an improved deformable part model for object detection and assigned the nodes of the topological map's semantic properties. Extensive experimental evaluations demonstrate that the proposed pose estimation and object detection methods can achieve better performance than previous methods in terms of accuracy and robustness; with the monocular SLAM system based on the semantic map yielding promising results for indoor environments.
Footnotes
7. Acknowledgements
This work is supported by the National Natural Science Foundation of China under grant nos. 61201362, 61573351 and 61273282, the Beijing Natural Science Foundation under grant no. 7132021 and the Scientific Research Project of Beijing Educational Committee under grant no. KM201410005005.