
Abstract
This paper proposes a novel method of manipulating both thermal change rate and thermal intensity to convey colour information by using a thermal tactile display. The colour-space transformation from {red, green, blue} to {hue, saturation, intensity} is introduced, and the mapping between colour and temperature is established based on warm and cold colours. Considering the lower resolution of the tactile channel, six limited stimulation levels are generated to represent colours. Based on the semi-infinite body model, the thermal response within the skin for each stimulation form is investigated. The Peltier element of the display is designed to convey different thermal stimuli to the human finger. Two experiments are performed to evaluate the performance of the display: colour identification and discrimination. Experimental results indicate that there is a response bias among the perceived colours for the traditional method of only employing thermal intensity, but there is no response bias for the proposed method; subjects’ mean recognition accuracy with the proposed method is significantly higher than that gained using the traditional method. Furthermore, colour information of the captured images can be reliably discriminated by using this devised thermal tactile display.
Introduction
Colour plays a vitally important role in the modern world, and it encodes an overwhelming amount of information. The significance of this information has ranged from critical safety measures (hazard warnings) to the aesthetics of our social life. However, the visually impaired are blocked from perceiving this information. It is evidenced that even those who are blind from birth would like to add this extra sense to their faculties [1]. Colours are often described as being ‘warm and cold', as they tend to evoke different moods or feelings. As a rich and emotive perceptual channel, thermal stimulation has similar emotional effects when generating warm and cold sensations. By correlating temperature with colour, a thermal tactile display can therefore be developed to provide a sense of colour, especially for the individuals who are blind or visually impaired.
Many thermal tactile displays have been developed to evaluate the importance of thermal cues in object identification and discrimination [2–4]. These displays mainly consist of a Peltier device, temperature sensors and a temperature-control system that monitors and controls the surface temperature of the device [5]. However, the focus of these research groups has been on simulating the thermal properties of materials rather than displaying temperature directly. Thermal displays can also be integrated with controls like joysticks or mice, allowing for a close relationship between perception and action. Yang et al. [6] proposed a tactile display mouse providing both pin-array-type tactile feedback and thermal feedback. With the thermal feedback device, users can discriminate between different materials by considering the perceived temperature variation. Kim et al. [7] proposed a racing game prototype with haptic and graphic feedback. The vibrotactile and thermal sensation can be conveyed to players through their interaction with the graphic environment. With thermal feedback, the game environment can be sensed by users. Baba et al. [8] designed a video-game interaction system incorporating temperature sensation. Their game controller could offer temperature sensation to users dynamically according to game situations. Similar to Earcons and Tactons, structured thermal cues can be designed to convey information. Wilson et al. [9] designed and tested identification of two-dimensional ‘thermal icons’ for mobile interaction. They used two thermal parameters: direction of change and subjective intensity of change in order to create four icons conveying these two pieces of information. Users in their study were able to uniquely identify the information with an accuracy rate of 82.8% when sitting indoors. While participants sat and walked outdoors, the overall identification rate for thermal icons reported by Wilson et al. [10] was 64.6%, but identification of each individual thermal parameter was promising, particularly the direction of thermal change.
However, there are only a few studies on the association of temperature with colour. Skinner invented a tactile display to represent contours of objects in a graphic image or picture when touched [11]. The display comprised an array of pins that may be raised in height relative to one another. Cool or warm colours in the original image could be represented with individual pins that were heated or cooled to relative temperatures using a thermal electric cooler. Sato et al. [12] proposed a vision-based thermal sensor using thermo-sensitive paint and a CCD camera for telexistence, which can simulate the physical interaction between a human fingertip and an object. The thermo-sensitive paint was employed to measure surface-thermal information on the basis of its colour, which changed according to its temperature. The hue of the captured image was used to convert colour to temperature. They confirmed experimentally that this sensor could measure surface-thermal information. Hribar et al. [13] constructed a haptic display that enabled low-vision individuals to explore virtual paintings, using the sensing of location within the painting to change tactile and thermal feedback in order to create contrasts. They developed an algorithm to display the colour temperature along the warm-cool spectrum based on the amount of red and blue in the local screen area and the brightness of the colour. The thermal display consists of a Peltier thermoelectric module, a temperature sensor, a power supply and an analogue input with digital input/output USB board. However, their mapping algorithm that negotiates colour and temperature is unclear, and the performance of their tactile-thermal display was not evaluated.
In this paper, we focus on evaluating the performance of the thermal tactile display for colour rendering based on two stimulation methods, and the proposed method is further utilized to discriminate between the colour information of the captured images. However, our research has nothing to do with direct colour perception by touch [14]. The remainder of this paper is organized as follows: Section 2 describes the theoretical background of mapping between colour, temperature and thermal responses within the skin, caused by different stimulation forms. The system construction of the thermal tactile display is illustrated in Section 3. Section 4 describes two psychophysical experiments to evaluate the performance of the display for colour identification and discrimination. Section 5 draws conclusions and addresses future work.
Theoretical background
Mapping between colour and temperature
By using common colour cameras, the digital information red (R), green (G) and blue (B) values of colour images can be obtained. We are thus able to construct a colour vector Q (R, G, B) in the psychophysical colour space. Previous research [11–13] suggested that the colour change might correspond to the thermal change. Here, we first perform a transformation from {R, G, B} to the psychological colour space {hue, saturation, intensity} or {H, S, I}. This conversion is implemented by the following formulas [15]:
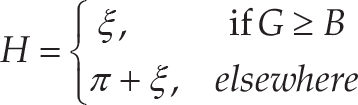


where ξ is expressed as
Differing from visual and auditory channels, tactile perception has a limited spatial and temporal resolution, meaning that humans cannot identify all colours in the form of temperature. In general environmental conditions, the temperature of human skin rests at a narrow ‘neutral’ zone, ranging from ∼28°C up to ∼40°C [16]. However, pain as a result of heat or cold will arise at specific temperatures with individual differences, which have been identified at around 11–15°C for cold and 45°C for heat [17]. In everyday usage scenarios, thermal feedback that is painful to receive is unlikely to be accepted by users. Therefore, thermal feedback needs to avoid stimuli that would cause pain, and so it is important to use temperatures that do not approach the pain thresholds, instead falling within the range of approximately 20–40°C [18].
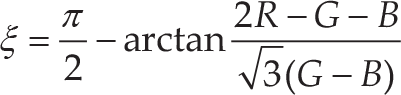
When H changes from 0° to 360°, the hue will become red, orange, yellow, green, cyan, blue and purple in sequence. Each colour has a specific angle range, but the area of its H component is uneven (see Table 1) [19]. When the intensity I is 0 or 1, the colour will correspond to black or white. However, due to the lower resolution of the tactile channel, we have to compress these colour types with a particular algorithm, with white, red, yellow, green, blue and black. The logic flowchart of the colour compression algorithm is illustrated in Figure 1. These six colours are also used to code infrared images [20]. By taking warm and cold colours into consideration, we correlate these colours with six different stimulation levels. Table 2 shows the mappings between colour and temperature for the traditional and proposed methods. As mentioned above, thermal intensity (or absolute temperature) is always employed to represent cool or warm colours. In this paper, we adopt this traditional method, as well. In the proposed method, two temperature parameters, i.e., thermal change rate and thermal intensity, are both manipulated to represent colours.
Relationship between each colour and its hue-angle range
To make the produced thermal stimuli comfortable, we chose a temperature range between 21°C and 39°C to represent colours, with the initial skin temperature adapted to 30°C, a neutral temperature also used in [21]. Three different stimuli intensities were used: 3°C, 6°C and 9°C. Wettach et al. [22] and Tee et al. [23] reported that users were able to differentiate varying degrees of intensity. In a less controlled desktop situation, 3°C was perceivable [24], and two stronger intensities were introduced to examine user responses. Three different change rates were used: 1°C/s, 2°C/s and 3°C/s. In ideal conditions, 1°C/s was sufficient to produce detectable sensations [25]. However, this value may not always be large enough, therefore higher rates were also included [9, 10, 24].

Logic flowchart of the colour-compression algorithm
Mappings between colour and temperature for the traditional and proposed methods

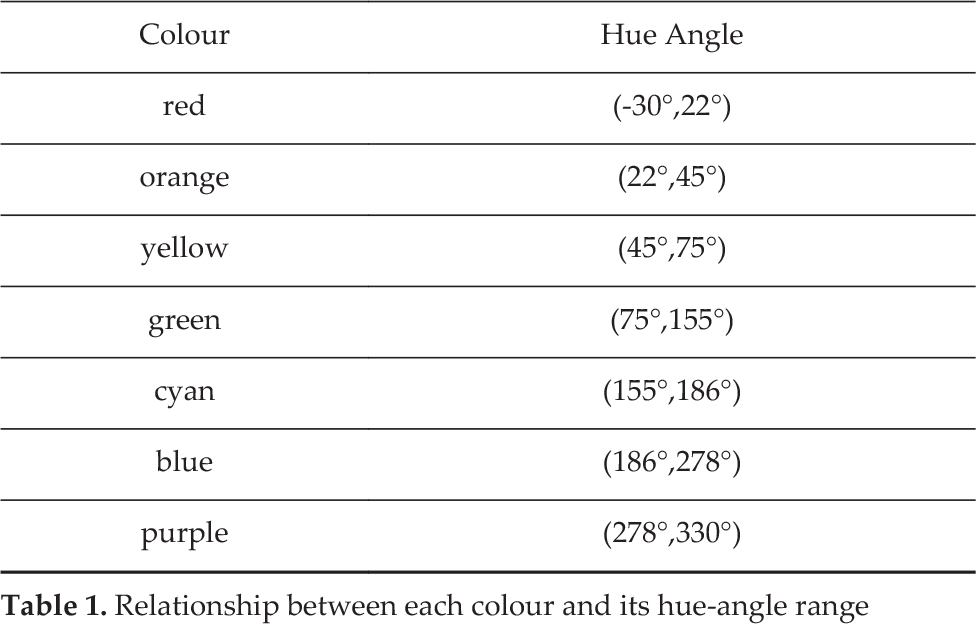
The ‘two semi-infinite bodies in contact’ model was a reasonable initial choice to model the contact between the finger and an object, and the developed thermal display based on this model was proved to be effective for simulating different materials [2]. To provide the relevant stimulation level for each colour, the traditional method will make the thermal display serve as a constant temperature source, maintaining the interface temperature. Based on the semi-infinite body model, the temperature profiles within the skin (for x > 0) can be calculated from Eq. (5):
where T P is the constant interface temperature, T S,0 is the initial skin temperature and α S is the thermal diffusivity of the skin. The heat flux q S conducted out of the skin during contact can be solved using the following equation:
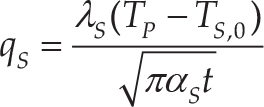
where Λ S is the thermal conductivity of the skin and t is time [26].
However, the detection of thermal changes is more dependent on the stimulus-change rate than on the actual extent of the change itself [17]. Manipulating both thermal-change rate and thermal intensity can therefore create perceptually distinct stimuli. We propose that the display can vary linearly from the initial skin temperature T S,0 , and that the interface temperature T C will be:

where k is a constant rate of thermal change. When the interface temperature reaches the specific temperature T P , the display will maintain this temperature for the remaining time. Under this condition, the temperature profiles within the skin and the heat flux conducted out of the skin are solved as:


where t P is the time for temperature change from T S,0 to T P and i is defined via the multiple integral of error function. From Eqs. (6) and (9), we can describe heat fluxes conducted out of the skin during contact (for T P > T S,0 ) in Figure 2. Note that the derived heat-flux changes are different from each other, resulting in different thermal sensations in the human central nervous system. This significant difference might favour the identification of and discrimination between various colours.

Heat fluxes conducted out of the skin during contact, based on semi-infinite body model
The schematic diagram of the entire system is presented in Figure 3. It mainly consists of an image acquisition module, an image-processing module and the thermal tactile display. A USB camera served as the imaging sensor to capture the original image in real time. As the image-processing unit, the host PC could display the captured image on the screen, and translate colours into different thermal stimulation levels based on the mapping algorithm. Colour information of the captured image is acquired through the position of the computer mouse when clicking its left button. With the aid of the host PC, the selected colour information is transferred to the microcontroller to control the thermal tactile display. The display consists of a serial communication and program-download circuit, an MCU control circuit, a Peltier driving circuit and its driving signal-selection circuit, as well as a temperature measuring circuit. The Peltier module is 30×30 × 6.9 mm3, with a maximum heat load (Qmax) of 12.7 W and a maximum electrical input power of 34.4 W. In addition, the PT100 thermistor was chosen as the temperature-measuring device, which was glued onto the Peltier device's surface. The temperature-measuring unit measured the Peltier device's surface temperature, and a digital PID control loop was implemented to modulate the temperature in real time. Due to technical limitations, the temperature change rate was approximately 1°C/s, 2°C/s or 3°C/s, and was controlled by the amplitude variation of the current flowing through the Peltier device.
Performance evaluation
First experiment: colour identification
The first experiment would investigate whether subjects could identify six different colours simulated using the thermal tactile display, by adopting the traditional and the proposed methods in turn.
4.1.1 Experimental method
Subjects. Ten normal, healthy adults (five men and five women) participated in this experiment. These subjects were all students of Southeast University and were aged between 23 and 28 years (mean = 25.1), all reporting that they were right-handed.
Procedure. In this experiment, six monochromatic colours (i.e., black, blue, green, yellow, red and white) were selected as the test colours. Subjects needed to wash their hands with sanitizer before the experiment. Then, subjects were trained to recognize these different colours. The traditional method was adopted first in order to present simulated colours to the subjects, and was followed by the proposed method. The mapping between colour and temperature intensity was explained, and these subjects were instructed to place their left hands on a hot-water bottle [27] when holding the computer mouse. The experiment began with the adaptation of the subject's index finger to 30°C, by resting it on the bottle for one minute. Subjects first completed a training session lasting 10 minutes, when they could feel each colour several times. During this time, six colours were shown on the PC screen corresponding to each of the six stimulation intensities. When pressing the left mouse button, the corresponding thermal feedback would be produced in several seconds, and subjects had to associate the sensation with the colour. In each trial, the Peltier device kept the relevant temperature constant until the subject gave a judgement within 10 s.
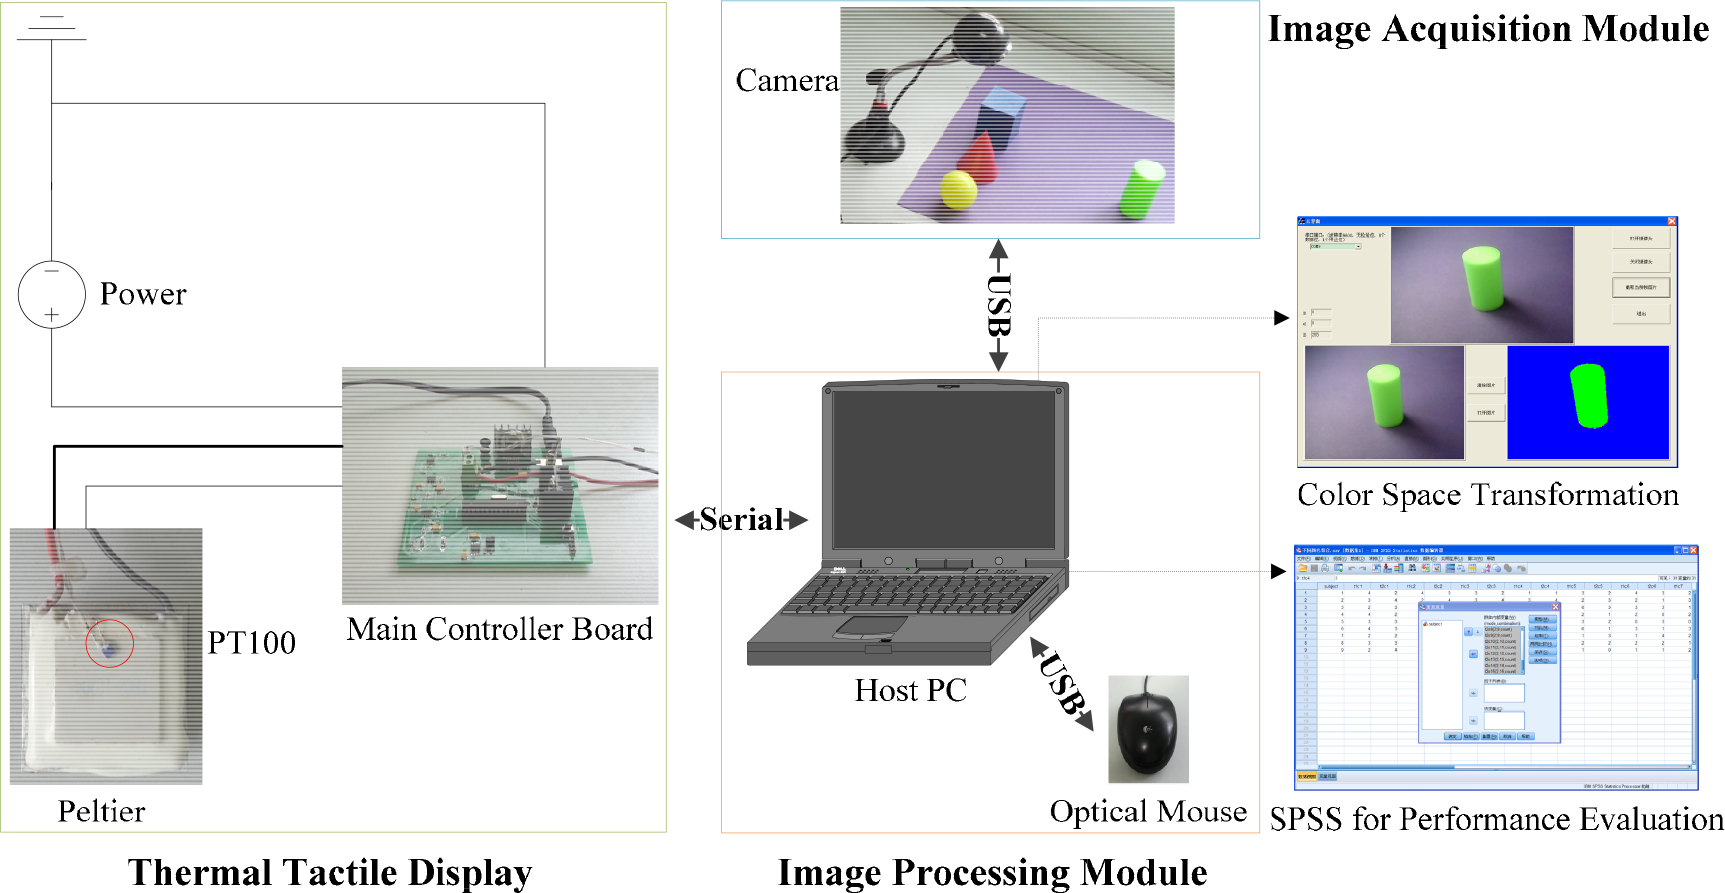
Schematic diagram of the thermal tactile-display system. The image acquisition module is framed in blue, the image-processing module in red and the thermal tactile display in green.
All six colours were repeated six times in a random order, giving each subject 36 trials. Subjects were blindfolded to shield them from any image information. While the colour was being presented, subjects had to name the simulated colour according to its perceived thermal intensity. Once they reported the colour they thought they had perceived, they returned their left hand to the hot-water bottle for 30 s, after which the next random colour was presented. Subjects’ judgements were submitted into a Visual C++ program. No remarks were made on the participants’ performance during the experiment process.
After using the traditional method for colour identification, the proposed method was adopted to present simulated colours to subjects. The experiment procedure was almost the same as that of the traditional method. Differences include the fact that after the mapping between colour and temperature change-rates was explained, the subjects were instructed to place their left index fingers on the Peltier device when holding the computer mouse. In each trial, the Peltier device changed to the relevant temperature and remained at that state until the subject gave their judgement within 10 s. Once subjects reported the colour they thought they had perceived, the Peltier device was returned to 30°C for 30 s, after which the next random colour was presented.
The confusion matrices of subjects’ responses when identifying six simulated colours by adopting the traditional and proposed methods are shown in Table 3. It can be deduced that presented colours corresponding to low temperatures, i.e., black, blue and green, were identified more accurately than those corresponding to high temperatures, i.e., yellow, red and white. That is, cold colours were a little easier to identify than warm colours, which is consistent with the fact that cold receptors are much more than warm receptors in human skin, with a ratio of 30:1 [16]. Because of thermal difference between each colour pair, the recognition rates for blue and red were lower than those for their neighbouring colours. From the confusion matrixes, the information transfer (IT) values are calculated to be 1.47 and 1.81 bits for the traditional and the proposed methods, respectively, corresponding to 2.78 and 3.51 discriminable colour categories [28].
To evaluate whether there was any response bias for each simulated colour, a repeated-measures ANOVA method was adopted to analyse the resulting data by using SPSS, with the perceived colour as the within-subject factor and correct response counting as the dependent variable. The results indicated that there was a response bias for the traditional method (F(5,45) = 14.83, p < 0.001), but no response bias for the proposed method (F(5,45) = 2.06, p = 0.088). Taking red as a reference for the traditional method, it was found that there was a significant difference between subjects’ response counts for black, blue, green, yellow and those for red (black: F(1,9) = 54.15, p < 0.001; blue: F(1,9) = 28.17, p < 0.001; green: F(1,9) = 12.64, p < 0.01; yellow: F(1,9) = 27.16, p < 0.01). This suggests that it was much easier to perceive the presented colour as black, blue, green or yellow than red.
Confusion matrixes for the traditional and proposed methods; the correct responses are highlighted

Confusion matrixes for the traditional and proposed methods; the correct responses are highlighted
Figure 4 shows the correct-response proportions for colour identification. The average recognition rate was 66% for the traditional method, and 83% for the proposed method. Given that the chance level was 0.17 in this experiment, a 0.29 level of correct responses could ensure that subjects had identified the presented colour reliably (p < 0.01). As can be seen from that figure, there were no colours whose correct-response proportion was below 0.29. In addition, the two-factor ANOVA for a strip-plot design indicated that the presentation method (traditional and proposed) had a significant effect on the correct-response proportion (F(1,9) = 122.95, p < 0.001), and that the average recognition rate for the proposed method was significantly higher than that of the traditional method. The perceived colour also had a significant effect on the response proportion (F(5,45) = 8.61, p < 0.001). In addition, there was a significant interaction between presentation method and perceived colour (F(5,45) = 22.80, p < 0.001).
In this experiment, thermal cues were conveyed to a subject through their left index finger placed on the Peltier device, and the derived theory predicted that the local thermal transients during contact could be leveraged to identify their corresponding colours. The results indicated that subjects were able to reliably identify all colours simulated by the display, by adopting the traditional and the proposed methods, with the performance of both being higher than the threshold level. This is also consistent with earlier research on stimulus temperature discrimination [23, 24]. Differing from the traditional method, an ANOVA indicated that there was no response bias among the perceived colours by adopting the proposed method. Namely, there was no trend in which one colour was taken for another. Furthermore, the comparison found that subjects’ performance during use of the proposed method was significantly better than for the traditional method.

Correct-response proportions for each colour when using the traditional method (white bars) and the proposed method (black bars)
The first experimental results indicated that subjects could identify the six colours more reliably with the proposed method, with a higher accuracy rate than for the traditional method. The second experiment, therefore, investigated the ability of subjects to discriminate colour information of the captured images by using this new method.
Experimental method
Subjects. There were nine normal and healthy adults (six men and three women) participating in this experiment. They were all students of Southeast University and were aged between 24 and 33 years (mean = 26.7). None of these subjects had participated in the first experiment. They all reported that they were right-handed.
Procedure. In this experiment, all pictures were captured using a common USB camera, with one object in the background (see Figure 3). The six selected objects were a black pyramid, a blue cuboid, a green cylinder, a yellow sphere, a red cone and a white prism. After being processed in a colour space, there were two different colours in each image: the background and the object colours. Each of the six colours was matched with each of the other five colours, giving a total of 30 different pairs. These pairs were presented to subjects in a random order with four repetitions, generating a total of 120 trials. There was a one-minute break between each block of 30 trials, during which subjects placed their left index fingers on the Peltier device to recover the skin temperature.
Subjects needed to wash their hands with sanitizer before the experiment began, then they were trained to recognize these colour pairs. During the training, 30 images were displayed on the PC screen corresponding to each of the 30 pairs. When pressing the left mouse button and sliding the mouse slowly along one direction, a subject would encounter two thermal change rates in their finger. Once perceiving a thermal change, subjects were instructed to stop in order to associate the feedback with the specified colour. In each trial, subjects could not move the mouse until they judged the presented colour within 10 s. During one completed sliding process, the thermal profiles within the skin could be simplified as:

where k 1 and k 2 are the encountered change rates, t 1 and t 2 the corresponding time for thermal change from T S,0 to the target temperatures.
Subjects were blindfolded to shield their vision from any image information. While the image was being presented, subjects had to name the simulated colours according to their perceived thermal sensation. Once the subjects reported the background and object colours that they thought they had percived, the Peltier device was returned to 30°C for 30 s, after which the next random image was presented. Subjects’ judgements were submitted to a Visual C++ program. No remarks were made on the subjects’ performances during the experiment process.
In order to correctly identify colour information in each image, the correct responses for each colour pair were counted for every subject. Due to the existence of 30 alternative colour pairs, the chance level for each trial was only 3.3%. Therefore, a threshold level of 11% was chosen to ensure subjects’ reliable discrimination of the colour pairs. Figure 5 shows the correct-response proportions for various colour pairs. In this figure, the colour presentation-mode of the trials was divided into B/O > 1 and B/O < 1. B/O > 1 denotes that the relevant temperature of the background colour was higher than that of the object colour, and B/O < 1 means that the relevant temperature of the background colour was lower than that of the object colour. Note that there were no colour pairs whose proportions were below the threshold level. A two-factor repeated-measures ANOVA indicated that the presentation mode had no significant effect on the correct-response proportion (F(1,8) = 0.88, p = 0.377), but that the colour combination did have an effect (F(14,112) = 5.94, p < 0.001). However, there was no significant interaction between presentation mode and colour combination (F(14,112) = 0.24, p = 0.998). Compared with the mean values, subjects’ performances in discriminating between black and blue (F(1,8) = 36.19, p < 0.001), black and green (F(1,8) = 39.84, p < 0.001) and white and red (F(1,8) = 43.39, p < 0.001) were significantly better, but they were significantly worse for blue and white (F(1,8) = 7.61, p < 0.05), green and yellow (F(1,8) = 9.22, p < 0.05) and green and white (F(1,8) = 5.58, p < 0.05). Furthermore, with the object shape as the controlled factor and the correct-response proportion as the dependent variable, another repeated-measures ANOVA found no significant difference among the six different shapes (F(5,40) = 2.17, p = 0.077). Figure 6 presents the correct-response proportions for the object shape.

Correct-response proportions for each colour combination with the presentation mode B/O > 1 (white bars) and B/O < 1 (black bars)

Correct-response proportions for object shape
This experiment aimed at evaluating the performance of the display in simulating colour information of the captured images. It was predicted that changes to skin temperature caused by a thermal change-rate could be used to discriminate between different colours. Based on the relevant temperatures of the background and object colours, trials could be divided into two presentation modes. However, the presentation mode had no significant effect on the correct-response proportion. This suggests that subjects’ performances were not influenced by whether the relevant temperature of the background colour was higher or lower than that of the object colour. Based on different shapes of the target objects, trials could also be divided into six shape modes. There was no significant difference among these shape modes, indicating that subjects’ performances were not affected by the object's actual shape. Based on different thermal change rates, subjects’ performances in identifying the background and object colours were well above the threshold level. This indicates that subjects were able to reliably discriminate colour information of the captured images by using their perceived thermal cues. Therefore, it is feasible to identify and discriminate the colours of multiple objects against backgrounds of the same colour.
In this paper, the mapping relationship between colour and temperature is established, based on ‘warm’ and ‘cold’ features of colours, similar to thermal stimulation. Due to the lower spatial-temporal resolution of the tactile channel, six limited stimulation levels were generated by the thermal tactile display in two ways in order to represent colours. The thermal responses within the skin for the traditional and the proposed methods were investigated based on the semi-infinite body model. To evaluate the performance of the display, two experiments were carried out: the first experiment examined the ability of subjects to identify various colours simulated by the display, by adopting the two methods; the second experiment investigated subjects’ performances in discriminating colour information of the captured images via their perceived thermal cues. The results indicate that subjects were able to reliably identify and discriminate between the presented colours using the proposed method. Therefore, it is feasible to convey the colour information by using the devised thermal tactile display.
In the design of a tactile vision-substitution system, colour rendering would be an important enhancement. By conveying more meta data, such as text, shapes, positions and colours, the visually impaired will gain the potential to explore graphics in a new way. The colour of the graphic image was also conveyed by vibrating the pins at relative frequencies in [11], and pins associated with warm colours in the graphic image may vibrate at higher frequencies than those of cooler colours. However, compared with the form of temperature, colour is not typically associated with movement or vibrations. Therefore, the convention is more difficult to interpret and recall. Since a vibrotactile vest designed by Wu et al. can convey the contour information of the captured image to the visually impaired [29, 30], it is desirable, meanwhile, to provide the colour information with a thermal tactile display. However, it still remains to be further investigated whether confusion will be produced when these tactile stimuli are presented simultaneously. In addition, it is cumbersome to occupy both hands in perceiving the colour information presented by a separate thermal display. In future, integrating the display into a computer mouse will be considered. With its high degree of sensitivity, the fingertip is often used for the thermal display. However, other body parts may be more suitable due to spatial summation [4], such as the thenar eminence or the palm of the hand. Sometimes, the heat sink cannot dissipate the accumulated heat efficiently, which would mislead a participant's judgement when the Peltier device had actually presented a cold stimulus. Therefore, a water-cooling jacket or a cooler fan would be better choices in future work.
Footnotes
6.
The authors would like to acknowledge the support of the Research Fund for the Doctoral Programme of Higher Education of China under Grant 20130092110060, and the Natural Science Foundation of Jiangsu Province under Grant BK2012560.