
Abstract
As the use of robotic-assisted surgery systems continue to increase, highly accurate and timely efficient automatic vasculature detection techniques for large and thin vessels in the retinal images are needed. Vascular segmentation has however been challenging due to uneven illumination in retinal images. The use of efficient pre-processing techniques as well as good segmentation techniques are highly needed to produce good vessel segmentation results. This paper presents an investigatory study on the combination of phase congruence with fuzzy c-means and the combination of phase congruence with gray level co-occurrence (GLCM) matrix sum entropy for the segmentation of retinal vessels. Fuzzy C-Means combined with phase congruence yields a higher accuracy rate but a longer running time while compared to GLCM sum entropy combined with phase congruence. While compared with the widely previously used techniques on DRIVE and STARE databases, the techniques investigated yield high average accuracy rates.
Introduction
Computer vision has found application in ophthalmology [15] and robotic eye surgery [2, 3, 11, 26]. With the help of detected and localized vessels, precise knowledge of the relative and absolute position values between the micro-robot and the blood vessel are utilized in the process of vessel cannulation. Retinal images are however often characterized by uneven illumination resulting in poor vessel detection. As robotic-assisted eye surgery continues to penetrate the health care system, highly accurate and fast automatic vasculature detection techniques for large and thin vessels in the retinal images are needed for efficient and reliable robotic-assisted vessel cannulation [2, 3]. In order to address the aforementioned necessities for efficient and reliable robotic-assisted vessel cannulation, this paper presents an investigatory study on the combination of phase congruence and fuzzy c-means (FCM) clustering for the detection of vessel network in retinal images. The detection of vessel network in retinal images utilizing phase congruence and Gray level co-occurrence matrix (GLCM)-based sum entropy information is also considered in this paper. Furthermore, the performance of FCM combined with phase congruence and GLCM-sum entropy combined with phase congruence for retinal vessel segmentation are assessed and compared.
The rest of this paper is organized as follows. Section two describes several works previously done on the detection of retinal vessels. Section three describes the methods and techniques used for the detection of vessels in this paper. Section four explains the experimental set-up, results and discussion, while section five draws the conclusion.
Related Works
Several retinal vessel segmentation techniques have been published in the literature. The vessel segmentation techniques are divided into two major categories namely supervised and unsupervised methods.
Supervised methods on the other hand requires some prior labelling information for the segmentation of retinal vessels. Although several contributions have shown the superior performance of the supervised methods over the unsupervised methods, the availability of reliable labelled training samples by experts for the supervised segmentation methods could sometimes be extremely difficult, expensive or unavailable. The classification of pixels as vessel or background using supervised learning has also been time-consuming. Niemeijer et al. [25] implemented a supervised pixel classification for the vascular segmentation. Each pixel of the green plane of the retinal image was used to construct a feature vector. Consequently, these feature vectors were trained using a kNN-classifier. Staal et al. [31] implemented a supervised vessel segmentation method through the extraction of image ridges. Primitives in the form of line elements were further constructed from the ridges. Feature vectors were further computed for every pixel and classified as either vessel or background using a sequential forward feature selection and K-nearest neigh-bour classifier. Soares et al. [30] constructed feature vectors composed of pixel intensities and different scales of responses from two-dimensional Gabor wavelet transform on each pixel. Bayesian classifier and Gaussian mixtures were further used to classify the resulting feature vector as either a vessel or background pixel. Fraz et al. [8, 9] implemented a supervised segmentation technique based on ensemble classifier of bootstrapped decision trees for the segmentation of the retinal vessel network. Lupascu and Tegolo [19] implemented a supervised segmentation technique for detecting vessels using an Ada-Boost classifier. Ricci and Perfetti [28] proposed two different automated vessel segmentation based on line operators. The best of the two segmentation methods constructed feature vector for supervised classification using a support vector machine. Cemal [4] implemented an hybrid segmentation method that combines Circular and Naive Bayes classifier to extract vessel network in retinal fundus images. Circular method is applied to sample pixels along the enlarging circles centered of the current pixel, and Naive Bayes classifier classifies the current pixel as vessel or background.
Unsupervised segmentation methods search and use underlying patterns to classify each pixel in the retinal image as either vessel or background. Although several previously proposed unsupervised segmentation methods have been computationally fast, they have however been faced with the inability to detect the thin vessels and the limitation of unconnected vessel network structures. Chaudhuri et al. [5] implemented a matched filter by initially approximating the intensity of gray-level profiles of the cross-sections of retinal vessels using a Gaussian shaped curve. However, the detection of the vessels were very low. Hoover [11] segmented retinal vessels by applying a threshold probing technique combining local vessel attributes with region-based attributes on matched filter response (MFR) image. Martinez-Perez et al. [22] used scale space analysis and region growing for vasculature segmentation. The technique proposed in [22] was however unable to segment the thinner vessels. Zana and Klein [41] implemented mathematical morphology for vascular segmentation. Although the result achieved in [41] was good, the vascular structures were not always connected to one another. Jiang and Mojon [11] proposed an adaptive local thresholding model using a verification-based multithreshold probing scheme. The proposed technique in [13] was however faced with the limitations of some unconnected vascular structures and the inability to detect the thinner vessels. The gradient based approach and level set technique proposed in [33] was unable to detect the thinner vessels. Vlachos and Dermatas [37] combined a multi-scale line-tracking procedure and morphological post-processing for retinal vascular segmentation. However, the technique did not detect the thinner vessels. Wang et al. [38] combined multi-wavelet kernels and multi-scale hierarchical decomposition for the segmentation of retinal vessels. Although the technique achieved a high accuracy rate, there is a need for an improved computational running time. Mendonca and Campilho [23] combined differential filters for center-line extraction with morphological operators for the detection of retinal vessel network. The computational running time however needs further improvement. Xiao et al. [39] implemented a Bayesian method with spatial constraint with level set for the segmentation of retinal vessels.
Tolias and Panas [35] implemented a fuzzy C-means algorithm to segment vessels in retinal angiogram images. The technique however did not segment thinner vessels due to their low contrast against background. Kande et al. [14] combined matched filtering and a spatially weighted fuzzy C-means for vessel segmentation in retinal images. Intensity information from red and green channels of the same retinal image were used to correct uneven illumination in color retinal images. An hybrid approach comprising fuzzy clustering and mathematical morphology was proposed by Yang et al. [40]. A morphological top-hat operation was used for retinal image smoothing and background information removal. The vessels were then extracted through fuzzy clustering. The algorithm was tested through visual comparisons. Sun et al. [32] implemented morphological multi-scale enhancement in combination with fuzzy filter and watershed transformation for vascular segmentation. Lupascu and Tegolo [18, 20] trained a self-organizing map (SOM) on retinal images. The map was further divided into two classes using k-means clustering [18] and modified fuzzy c-means [20] techniques. Saffarzadeh et al. [29] implemented a preprocessing phase based on k-means followed by the use of multi-scale line operators for the detection of retinal vessel network. Although the technique achieved a fast computational running time, there is a need to improve the accuracy rate of the detected vessels. Mapayi et al. [21] implemented an adaptive thresholding technique utilizing different types of local homogeneity information for retinal vessel segmentation.
A combination of different log-Gabor filters using Fourier phase information was proposed by Kovesi [16, 17] to measure phase congruency. The phase congruence model uses Fourier phase information and has been very promising in the detection of object boundary in the presence of noise. It has also been invariant to uneven illumination and contrast variation. Amin and Yan [1] implemented the detection of retinal blood vessels using phase congruency at a high speed. Although the technique performed well in terms of speed, there is a need for a higher accuracy rate and a dynamically computed thresholding approach. Tagore et al. [34] used phase congruency to improve the contrast of vessel segments against the retinal background. An hierarchical clustering based histogram thresholding was further used to segment the contrast enhanced vessels. In related development, Zhu [42] used phase congruency to represent and characterize the cross-sectional profiles of retinal vessels in the fourier domain. The performance of the proposed technique in [42] was only described using visual results. Dai et al [6] implemented a multi-scale line filter combined with phase congruency for retinal vasculature segmentation. The multi-scale line filter was used to reduce the influence of step edges while phase congruency was used for the post processing.
Methods
This section describes the different methods used in the investigation. Due to the problem of noise caused by uneven illumination and contrast variation, there is a need for an efficient pre-processing technique. This paper utilizes phase congruence for the preprocessing phase of the retinal vessel segmentation due to its good capability in the detection of object boundary in the presence of noise, and its invariance to uneven illumination and contrast variation [16], [17]. The green channel of the RGB colored retinal image is used in the pre-processing phase since it provides the best vessel-background contrast among the three channels of the RGB color space [13], [29], [31]. Phase congruence is used for the pre-processing of the green channel, thus handling the noise due to uneven illumination and contrast in the retinal image. Vessels are detected from the resulting output image from phase congruency using two different techniques namely fuzzy c-means (FCM) and Gray level co-occurrence matrix (GLCM)-based sum entropy. A morphological post-processing technique is further used to handle the remaining misclassifications. This section gives a detailed description of phase congruence, fuzzy c-means and the GLCM sum entropy based thresholding. The post-processing technique used is also described in this section.
Preprocessing Using Phase Congruence
Phase is congruent when the phases of all the Fourier components at the positions are aligned [42]. Figure 1(a) shows a square wave made up of Fourier terms and Figure 1(b) shows the same for a triangular wave. The terms of the Fourier series as shown in both Figures 1(a) and 1(b) are plotted using broken lines while the sum of the terms is described with the unbroken line.
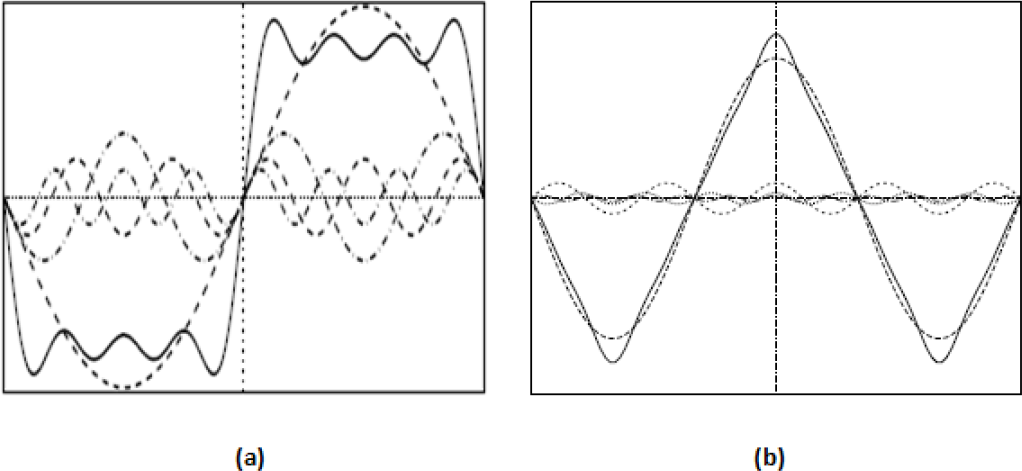
Fourier Decomposition for Square and Triangular Waves [16]

Noise Calculation Problem in Phase Congruency [16]
Morrone and Owens [24] defined phase congruency function in relation to the Fourier decomposition of a signal at some position x to be:

where the amplitude A
k
is the k
th
Fourier component, and ϕ
k
(x) is the local phase at k. The amplitude weighted mean local phase angle of all the Fourier terms at the position under consideration yields the value

Colored Retinal & Phase Congruence Pre-Processed Images From DRIVE Database
Venkatesh and Owens [36], as an alternative to [24], computed points of maximum phase congruency through the search for the local energy function peaks. The local energy function E(x) of a luminance profile I (x) is defined as:

Such that F(x) is the signal I(x) after the removal of its DC component while H(x) is the Hilbert transform of F(x).
Given that I is the signal and M e k and M0 k are the even-symmetric (cosine) and odd-symmetric (sine) wavelets respectively at scale k, the amplitude of the transform is computed as:

as the phase is computed as:

The energy E(x) was further computed in terms of phase congruency PC(x) and Fourier amplitudes A k in [36] as:

Given phase offset ϕ
k
(x) and weighted mean phase angle of

Hence, the phase congruency is computed as:

However, one of the problems encountered by phase congruency is the possibility of turning poorly conditioned when all the Fourier amplitudes are very small. This was however handled by Kovesi [16, 17] through the addition of a small positive constant ε, to the denominator of the phase congruency expression as:

where the value of ε is determined by the precision of the performance of the different operations on the signal.

(a) Gold Standard of Image 01 on DRIVE database (b) Pre-Processed Image of Image 01 on DRIVE database Using Phase Congruence (c) Segmented Vessels of Image 01 on DRIVE database Using GLCM Sum-Entropy Threshold Combined with Phase Congruence (d) Segmented Vessels of Image 01 on DRIVE database Using Fuzzy C-Means Combined with Phase Congruence
Another problem previously encountered by Phase congruence was its inability to efficiently handle noise. Figure 2 shows that all significance is lost by phase congruence when the value of E(x) falls within the noise circle.
Kovesi [16, 17] further estimated the level of noise in the calculation of the local energy on the premises that signal noise is additive, the noise power spectrum is constant, and that the features like edges occur only at disjointed locations. Hence, the phase congruency that includes the removal of the estimated signal noise is computed as:
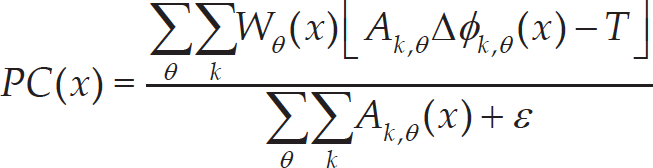
In order to compute an overall measure of phase congruency in 2-D images, a computationally efficient phase congruence model on 2-D images was proposed by Kovesi [16, 17]. Hence, equation (9) above for 1-D signals is rewritten for 2-D images as:

where (x,y) is the position of the pixel in the green channel of the retinal image, while k and θ represent scale and orientation respectively. Wθ is the weighing factor for the distributed frequency, while Tθ estimates the image noise. The energy is computed using Ak,θ Δϕk,θ (x, y), while ε is added to the denominator such that the divisor will be nonzero. Figure 3 shows the colored retinal fundus images and the output of pre-processed images using phase congruence.
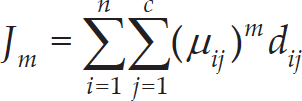
FCM is a soft computing-based clustering method introduced by Dunn [7]. FCM algorithm requires no hand-labeled ground truth images for training, but examines and utilizes underlying patterns to classify image pixels into appropriate groups. The FCM algorithm is applied on the output image obtained from the phase congruence. The n sample of the image input data points is expressed as X = {x1, x2, …., x n } while the corresponding cluster centres of the image data points is expressed as V = {v1v2,…., v c }, where c is the number of clusters. μ ij is the membership degree of the image data point x i to the cluster centre v j Fuzzy clustering computes the optimum partition based on the minimization of the objective function given that μ ij satisfies

The cluster centre (i.e centroid) v j is computed as:

where m is the fuzziness index parameter and m ∊ [1, ∞).
Given that:

The dissimilarity between the centroids v j and the data points x i is computed as:
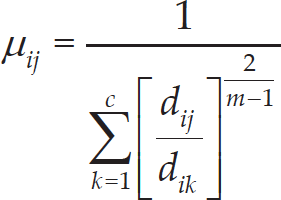
Such that d ij is the Euclidean distance between the i th data point and the j th centroid while μ ij ∊ [0,1] and the fuzziness index parameter m ∊ [1,∊)
The new membership value is further computed as:
This is iteratively computed until

where k is the iteration step and λ ∊ [0,1] is the criterion for terminating the iteration.
Image signal statistics, particularly first- and second-order statistics, are good texture feature descriptors used for image segmentation techniques. First-order statistics are concerned with individual image pixel properties while second-order statistics such as gray level co-occurrence matrix (GLCM) are concerned with individual pixel properties as well as the spatial inter-dependency of two pixels at particular relative positions. Gray level co-occurrence matrix (GLCM) is popularly known for its usage for texture image segmentation [10]. Haarlick texture features [10] computed from GLCM have been used for both supervised and unsupervised segmentation. A gray-level threshold value based on GLCM sum entropy feature information is computed for the segmentation of the retinal vasculature from the background using the image output from phase congruence technique. The GLCM for the retinal fundus image is computed in the relative distance d between the pixel pair and their relative orientation ϕ across four directions (horizontal: 0°, diagonal: 45°, vertical: 90° and anti-diagonal: 135°) as:
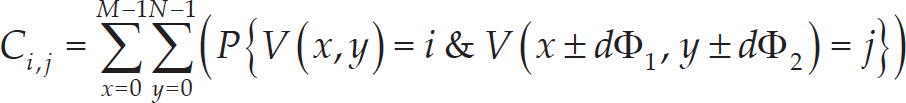
where V(x, y) = i, means i is the gray level of the pixel (x, y), and P is defined as

The sum entropy feature across the varying distances d and relative orientation ϕ is defined as:

where
A multi-scale feature measurement of the sum entropy across the varying distance d and relative orientation ϕ is used in the computation of a feature matrix as:

where

Such that ϕ1 = 0°, ϕ2 = 45°, ϕ3 = 90° and ϕ4 = 135°, with distances (d i )i=1,…,4>. The threshold value used for the segmentation of the vessels using the output image from the phase congruence and a mean filter is computed as

Hence, the segmented image is given as

where F(x,y) is the output image of phase congruence.
A combination of median filter and morphological opening were used for the post-processing phase. Median filter is used to restore the connectivity of several vessel lines by revealing some hidden pixels that belong to vessel lines. It is also used to get rid of the remaining noisy pixels. This paper applies a 2 × 2 median filter based on its good performance. This is followed by the use of morphological opening for the removal of the remaining noisy pixels.
Experimental Set-up, Results and Discussion
This experiment was implemented using DRIVE [27] and STARE [11] databases. DRIVE database is made up of 40 images. Each image in DRIVE database is captured using 8 bits per color plane at 768 × 584 pixels. The forty images were divided into two. The first group of the DRIVE images is a training set made up of twenty images. The second group is the testing set. Twenty ground truth gold standard images of segmented vessels are provided for the comparative performance evaluation of different vessel segmentation algorithms. STARE database on the other hand consists of retinal images captured with the use of TopCon TRV-50 fundus camera with 8 bits per colour channel and spatial resolution of 700 × 605 pixels. The database provides 20 coloured retinal images. Two observers manually segmented all the images. For the purpose of comparative performance evaluation of different vessel segmentation algorithms, the 20 hand-labeled images of the first observer is usually used in the literature as the ground truth. The performance of the manually segmented vessels by second human observer is also compared with other results. MATLAB 2010a on an Intel Core i5 2410M CPU, 2.30 GHz, 4GB of RAM was used for the implementation of this technique. The average time taken for the combination of phase congruence and FCM is 27.1 seconds and the combination of phase congruence and GLCM sum entropy is 10.3 seconds for each image on DRIVE database.

(a) Gold Standard of Image 19 on DRIVE database (b) Segmented Vessels of Image 19 on DRIVE database Using GLCM Sum-Entropy Threshold Combined with Phase Congruence (c) Segmented Vessels of Image 19 on DRIVE database Using Fuzzy C-Means Combined with Phase Congruence
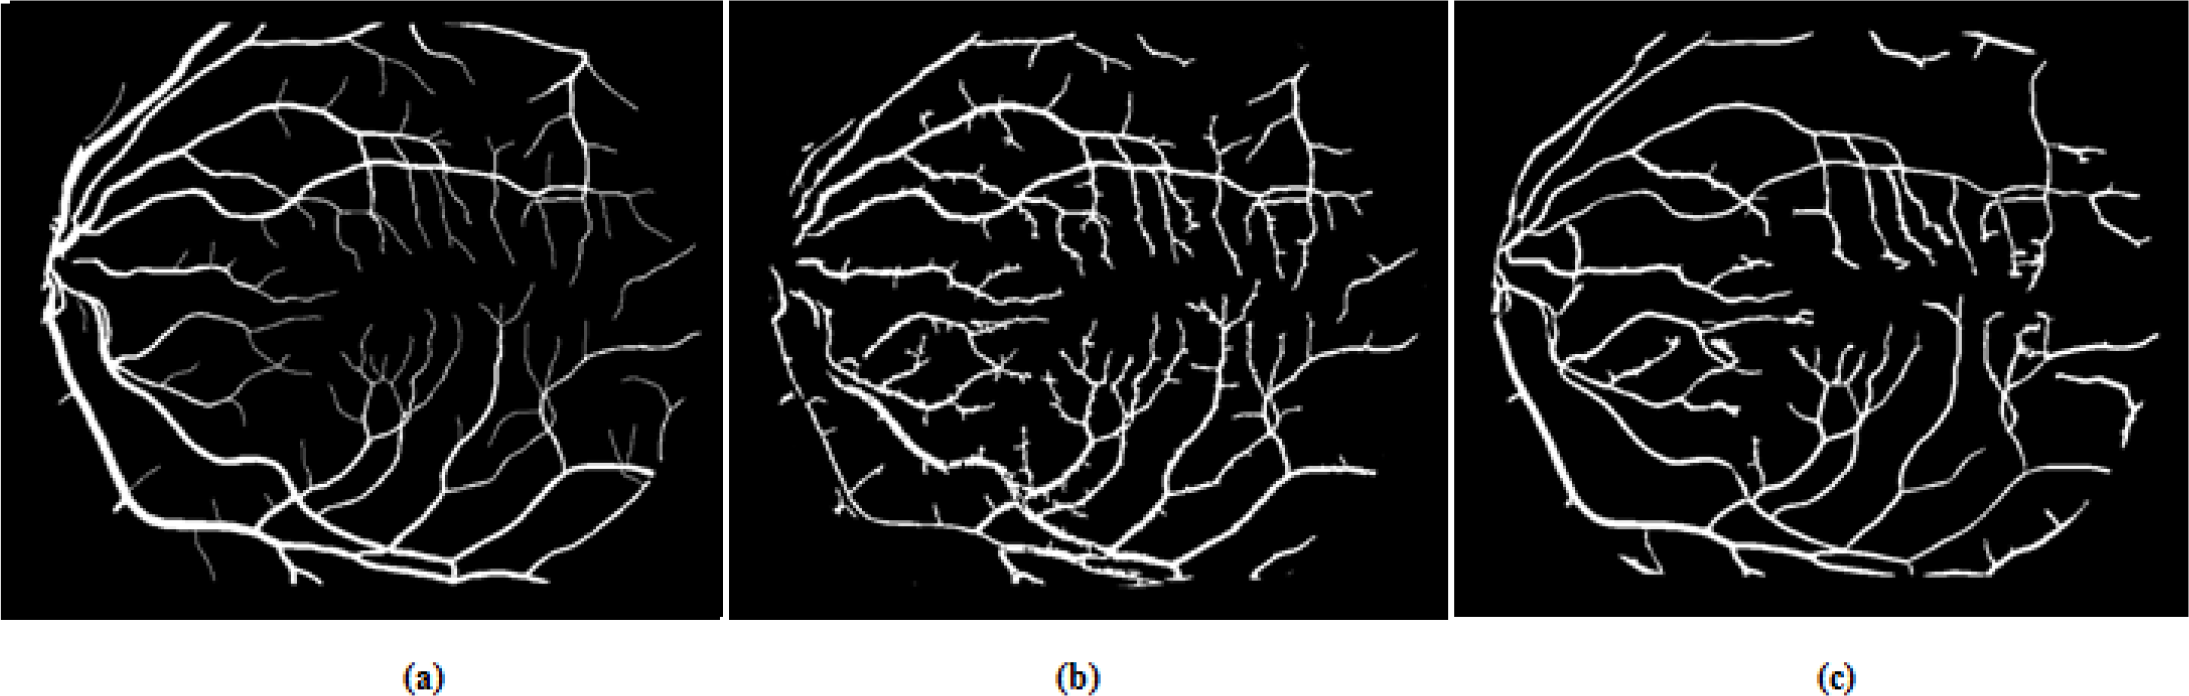
(a) Ground Truth of Image 7 on STARE Database (b) Segmented Vessels of Image 7 Using GLCM Sum-Entropy Threshold Combined with Phase Congruence (c) Segmented Vessels Image 7 Presented by Hoover et al. [11]
Figure 4(a)–4(d) shows the comparison of the ground truth of segmented vessels on DRIVE database, the output of pre-processed image using phase congruence and the segmented results obtained from the proposed techniques. Figure 5(a) – 5(c) shows the segmented results with the gold standard on DRIVE database. Figure 6(a)–6(c) shows the comparison of the ground truth of segmented vessels on STARE database, the segmented results obtained from GLCM sum-entropy threshold combined with phase congruence and the segmented vessels presented by Hoover et al. [11]. Figure 7(a) – 7(c) shows the comparison of the ground truth of segmented vessels on STARE database, the segmented results obtained from fuzzy c-means combined with phase congruence and the segmented vessels presented by Hoover et al. [11]. Figure 8 shows the visual result obtained for segmented vessel network with traced boundaries. The results are evaluated using the vessel accuracy rates as the performance measure. The accuracy measure is described below as:

TP = True Positive, TN = True Negative, FP = False Positive, FN = False Negative.
An event is said to be TP if a pixel is rightly segmented as a vessel and TN when a pixel is rightly segmented as background. An event is said to be FN if a vessel-pixel is segmented to be background, and a FP when a background pixel is segmented as a pixel in the vessel. Accuracy however indicates the degree of conformity of the segmented retinal image to the ground truth.
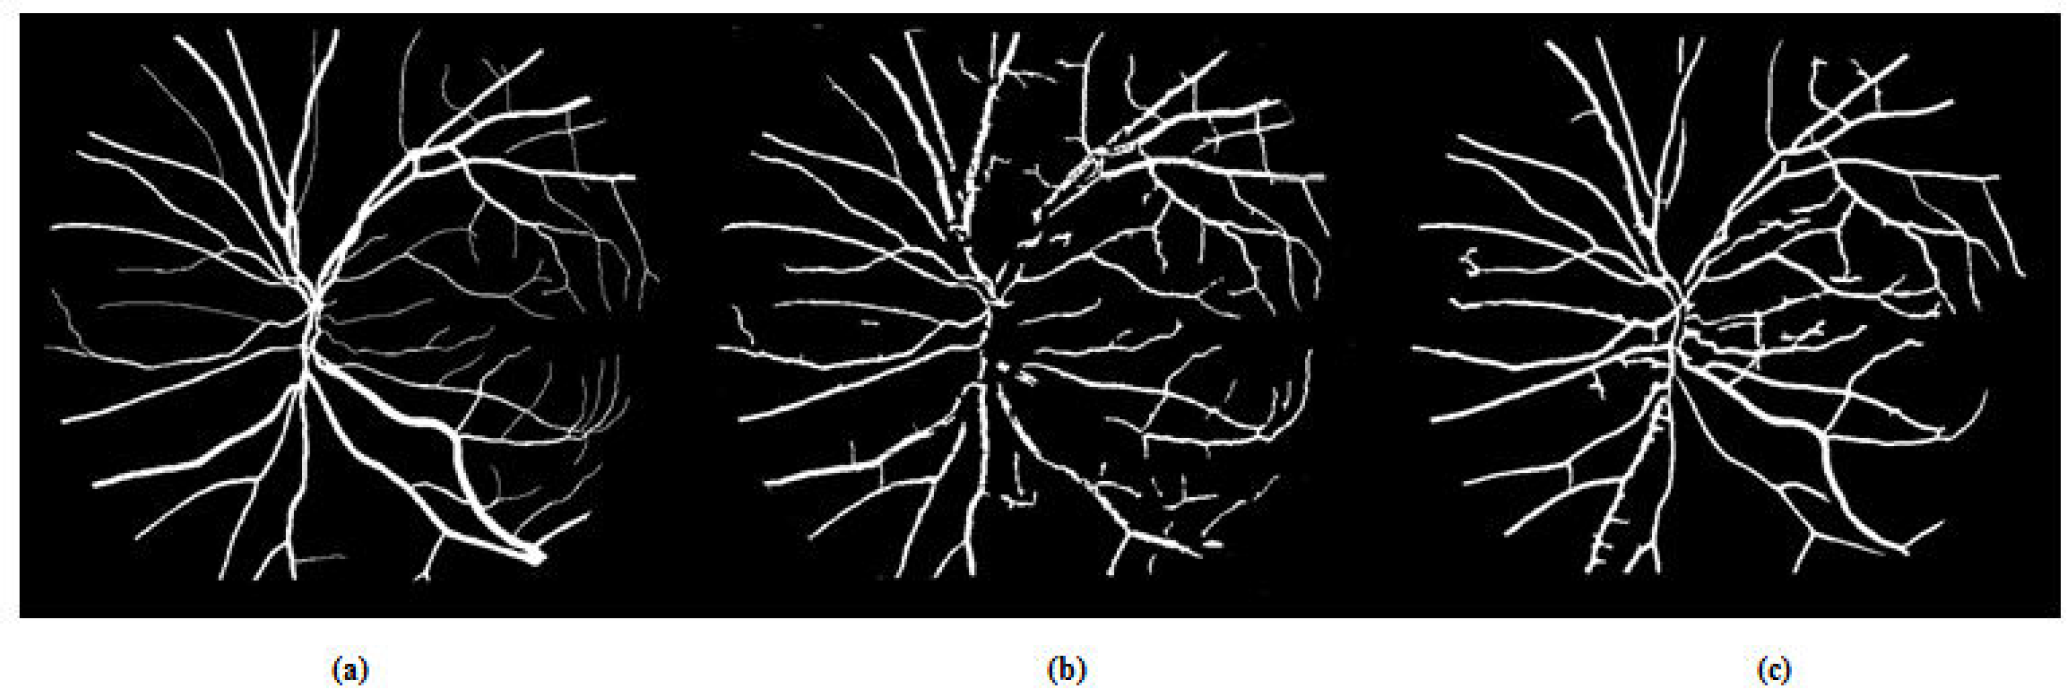
(a) Ground Truth of Image 12 on STARE Database (b) Segmented Vessels of Image 12 Using Fuzzy C-Means Combined with Phase Congruence (c) Segmented Vessels of Image 12 Presented by Hoover et al. [11]
Performance of different Segmentation methods on DRIVE & STARE Databases
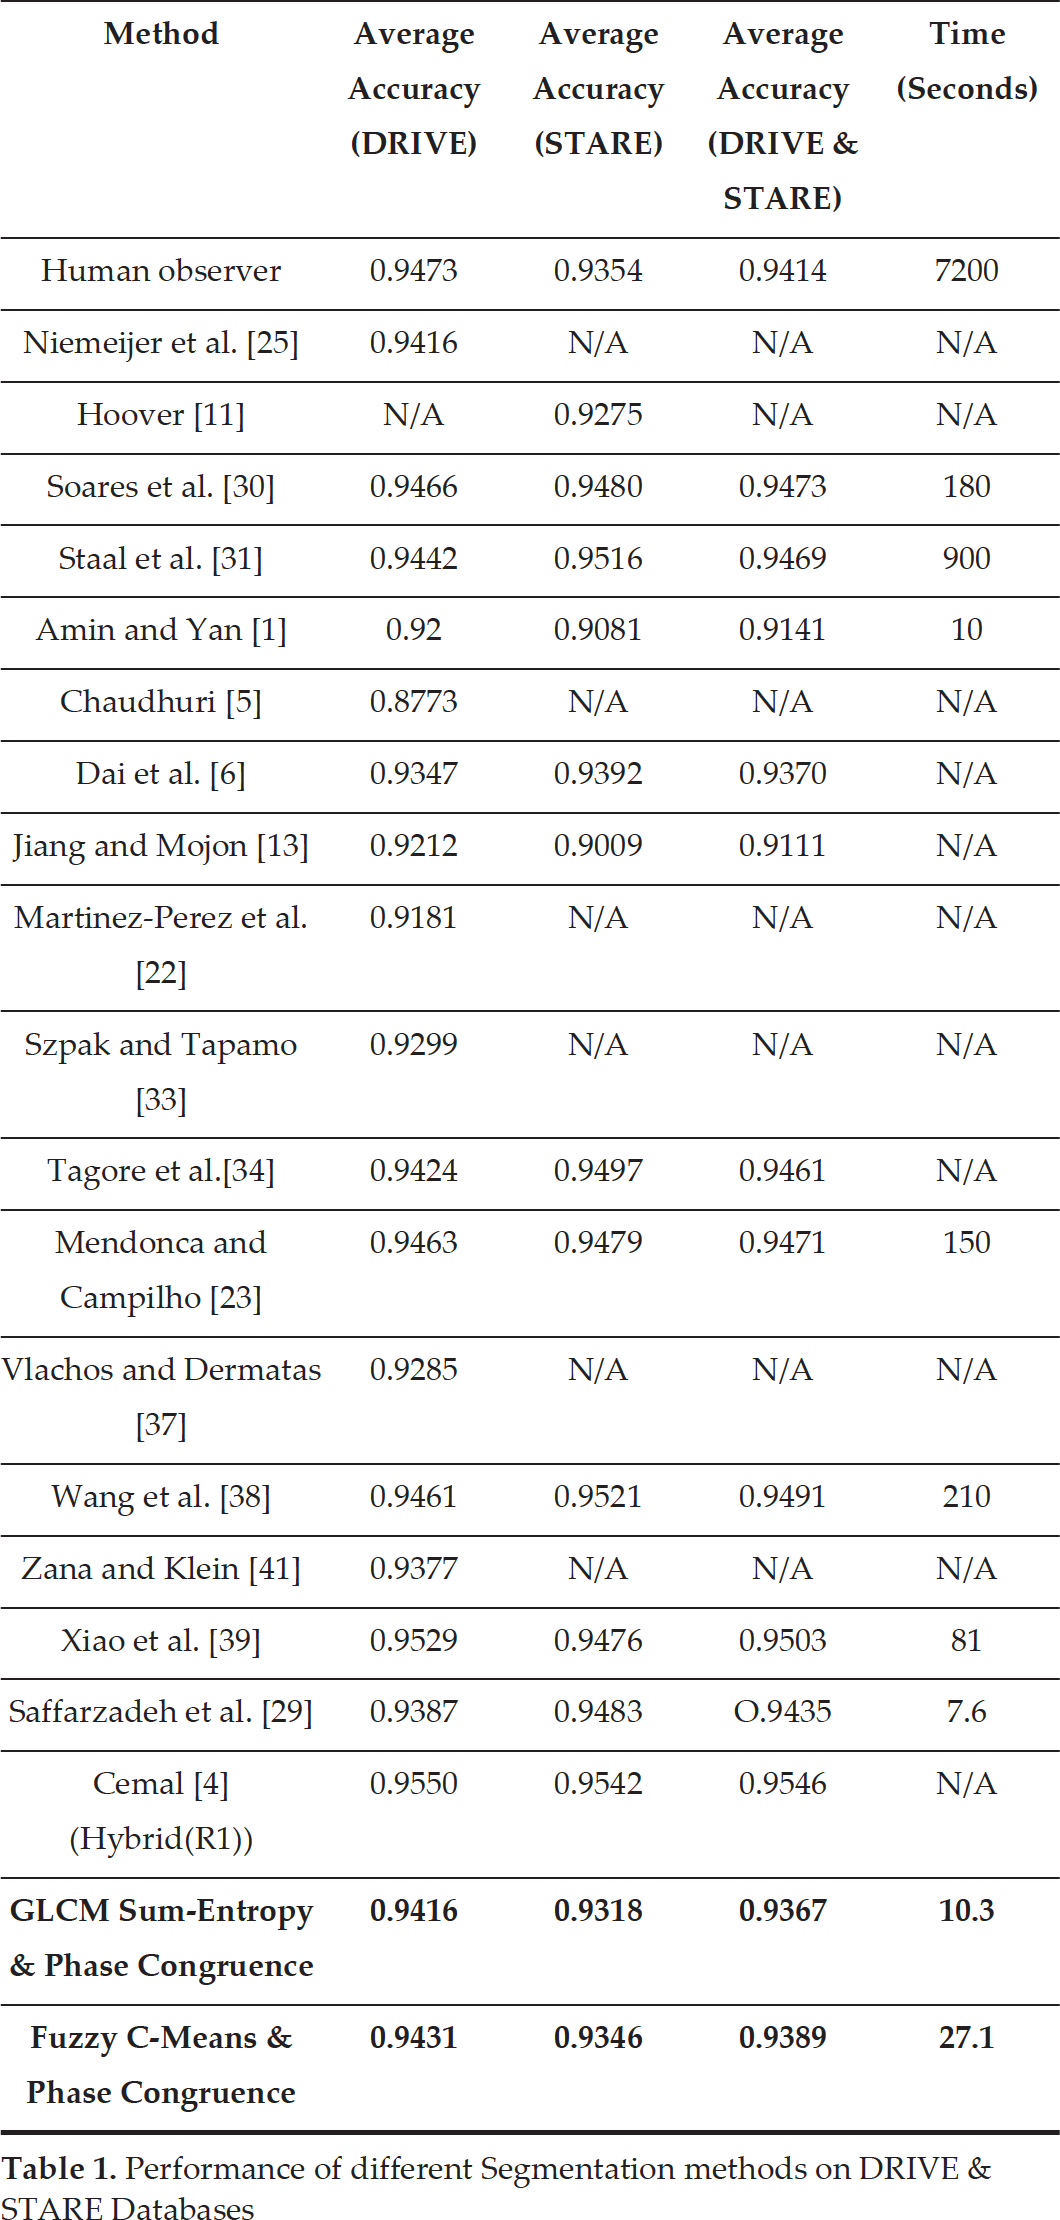
Table 1 shows the performance of Fuzzy C-means and GLCM sum entropy while combined with phase congruence. Fuzzy C-means combined with phase congruence has higher average accuracy rates of 0.9522 and 0.9346 over average accuracy rates of 0.9431 and 0.9318 achieved by GLCM sum entropy combined with phase congruence on DRIVE and STARE databases respectively. The performance measures and the computational time of the proposed techniques in comparison with different techniques are also shown in Table 1.
The phase congruence technique proposed by Zhu [42] presented only a visual performance measure. The works of Chaudhuri et al. [5] and Martinez-Perez et al. [22] present lower average accuracy while compared to the proposed techniques. Vlachos and Dermatas [37] present lower average accuracy while compared to the proposed techniques on DRIVE database. Niemeijer et al. [25] present lower average accuracy rate while compared to fuzzy c-means combined with phase congruence but the same average accuracy rate while compared to GLCM sum-entropy combined with phase congruence on DRIVE database. Szpak and Tapamo [33] and Zana and Klein [41] present lower average accuracy rates while compared to the proposed techniques on DRIVE database. Hoover [11] presents a lower average accuracy while compared to the proposed techniques on STARE database.
Amin and Yan [1] and Jiang and Mojon [13] present lower average accuracy rates while compared to the average accuracy rates of the proposed techniques on DRIVE and STARE databases. Amin and Yan [1] is however computationally faster while compared to the proposed fuzzy c-means combined with phase congruence. Dai et al. [6] and Saffarzadeh et al. [29] present lower average accuracy rate on DRIVE database but higher average accuracy while compared to the proposed techniques on STARE database. Saffarzadeh et al. [29] is computationally faster while compared to the proposed techniques.
Tagore et al.[34] presents a higher average accuracy rate while compared to an average accuracy rate of GLCM sum entropy combined with phase congruence but lower than the average accuracy rate of fuzzy c-means combined with phase congruence on DRIVE database. Tagore et al.[34] presents higher average accuracy rate while compared to an average accuracy rates of the proposed techniques on STARE database. Cemal [4] presents higher average accuracy rates while compared to the average accuracy rates of the proposed techniques on DRIVE and STARE databases. Mendonca and Campilho [23], Soares et al. [30], Staal et al. [31], Wang et al. [38] and Xiao et al. [39] present higher average accuracy rates while compared to the average accuracy rates of the proposed techniques on DRIVE and STARE databases. The average accuracy of the human observer is also higher than the average accuracy rates of the proposed techniques. Cemal [4], Tagore et al. [34], Mendonca and Campilho [23], Saffarzadeh et al. [29], Soares et al. [30], Staal et al. [31], Wang et al. [38] and Xiao et al. [39] present higher average accuracy rates while compared to the proposed methods on a combined average accuracy rates performance on DRIVE and STARE databases.
GLCM sum entropy combined with phase congruence is computationally faster while compared to Mendonca and Campilho [23](14.6 times), Soares et al. [30](17.5 times), Staal et al. [31](87.4 times), Wang et al. [38](20.4 times), Xiao et al. [39](7.9 times) and human observer (699 times). FCM combined with phase congruence is also computationally faster while compared to Mendonca and Campilho [23](5.5 times), Soares et al. [30](6.6 times), Staal et al. [31] (33.2 times), Wang et al. [38](7.75 times), Xiao et al. [39] (3 times) and human observer (265.7 times).

Segmented Vessel Network With Traced Boundaries
These proposed methods are computationally fast because they are unsupervised methods and do not require training phase like the supervised techniques. Fuzzy c-means combined with phase congruence however yields a longer running time while compared to GLCM sum entropy combined with phase congruence due to its (i.e. FCM) iterative nature. Although the proposed methods also yield lower average accuracy rates while compared to the supervised segmentation methods [30, 31], It should however be noted that these methods are not like the supervised vessel segmentation techniques whose performances are highly dependent on the labelled training sample by experts which could sometimes be extremely difficult, expensive or unavailable as new training sample are often for the retraining of the classifiers before applying it on a new database.
In conclusion, the investigation presented in this paper shows that fuzzy c-means combined with phase congruence yields a higher accuracy rate but a longer running time, while compared to GLCM sum entropy combined with phase congruence. This is however due to the iterative nature of fuzzy c-means. While compared to the previously proposed supervised segmentation techniques for retinal vessel detection, the proposed methods are not labelled training dependent thus making them computationally faster. Although good accuracy rates are achieved, there is still room for improvement. Our future work shall do a further investigation on more robust and timely efficient segmentation techniques for the detection of both large and thin vessels in retinal images.
Footnotes
6.
The authors would like to thank Hoover [11] and Staal et al. [![]() ] for making their databases publicly available.
] for making their databases publicly available.