
Abstract
We propose a network model to identify the main drivers of consumer-based brand equity. We apply our research to assess the value of three over-the-counter drug brands. Our aim is to help manufacturers to improve their position in the market of self-medication. This market has very peculiar characteristics: consumers buy products in response to their specific health needs; nonetheless, the market is not strictly regulated in the same way that the prescription market, which allows firms to choose their pricing and communication strategies. Moreover, consumers are not forced by physicians to buy one specific drug, but they can choose the one they prefer. To develop our model we use the Analytic Network Process methodology, which allows integrating qualitative and quantitative judgments from many decision makers and deals with non-regular preference structures. The output of the model is a ranking of the brand value drivers, according to their importance in influencing the consumers' purchase intentions. We find that advertising plays a major role in this setting. To test our model and validate our results, we analyse three Italian brands that produceover-the-counter (OTC) Diclofenac-based drugs. In addition, we compare our results with their market share.
Keywords
1. Introduction
In recent years the pharmaceutical industry experienced a decrease in its performance, which involved losses in profit margin and return on investments. This situation can be partially ascribed to the very peculiar nature of this industry: manufacturers face high costs for R&D activities and for patents, competition is high and the relationship with customers is often very constrained. In this context, reduced profit margin can impede – or, at least, make more difficult – the development of new products, which, for the most part, require long lead times. Opportunities come from the attempt of governments to mitigate the costs of state-subsidized healthcare: these costs are already huge and are likely to grow with the shifting of age distribution toward an older population[1] In the last few years governments, have delisted many drugs, passing them from the prescription to the non-prescription market. The definition of “non-prescription medicine” varies from country to country: in many cases, it is coincidental with “over-the-counter” (OTC) products, while in other cases, it is possible to further subdivide these products into other categories. In Italy, as an example, non-prescription drugs are subdivided in SOP (which in Italian stands for “without need of prescription”) and OTC: both include self-medication drugs, but for the latter advertising is permitted – under the approval of the Italian Board of Health – whereas for the former it is not. Moreover, in the case of OTC drugs, manufacturers are also free to choose the price of their products. Under these specifications, it appears clear that OTC products can represent a potentially new source of value for the pharmaceutical industry: in fact, manufacturers are progressively less constrained in their relationship with consumers; specifically with regard to both pricing and communication strategies. Manufacturers can often leverage the reputation of the products they already produce, when launching new ones. In some cases, having a good reputation in the prescription medicines sector (Rx)helps to improve one's position in the OTC market as well.
Prior research has emphasized the strategic importance of brands in driving consumer choices. Brand image can make the difference in secure a sale when the consumer is uncertain and cannot choose among very similar products [2, 3]; it can also be a means to connect with consumers' inner values [4] and to convey positive or negative feelings about product characteristics. Actually, it is often hard to assess a product's full value before the purchase, especially when it has many complex features; so one has to rely on other users' opinions or on the brand's reputation. Accordingly, the quality of a product is often linked to its brand value [5]. Consistently, it is often the case that the perceived value of a product is highly influenced by more ethereal and less tangible elements. Furthermore, brand equity has proved to be positively related to market shares [6], purchase intensions and consumer preferences [7].
A large body of literature has studied ways to measure brand equity, and many different approaches can be identified: some adopting a financial perspective [8] – in order to determine the financial value of the brand; some focused on the strategic management of brands [9, 10]; others based on behavioural science and mainly focused on customer perceptions, taking into account the multiple dimensions of the brand value [11], analysing the concepts of brand strength and brand value [12], considering facets, such as perceived quality, perceived value for money, uniqueness, and the willingness to pay a price premium for a brand [13], or stressing the importance of brand knowledge and brand awareness [14]. Some private companies, such as Interbrand and the advertising agency Young & Rubicam, have also developed methodologies to asses brand value.
In this paper, we try to identify the major drivers of brand value for OTC medicines, following a consumer-based approach. Our research is intended to provide useful guidelines to the pharmaceutical companies who want to improve consumer awareness and the purchasing of self-medication drugs, when not strictly conditioned by a medical prescription.
In a previous work we used a consumer-based approach to find the most important determinants of brand equity in the fashion industry [15]. By means of the Analytic Hierarchy Process (AHP), we found evidence to say that companies' reputations and the strategies adopted to build consumer loyalty play a major role in determining the brand value as perceived by consumers; we also emphasized the importance of choosing the most appropriate price for products, having reliable after-sales services and paying attention to customer feedback. In the present study, we extend our previous research, using a more complete model to assess brand equity – we build our model under the general framework of the Analytic Network Process (ANP). The ANP is a more general approach to the theory of decision making than AHP. In the same way that AHP does, ANP allows integrating both qualitative and quantitative judgments from various decision makers, and to hypothesize a spreading of influence ofeach decisional element towards some others. Nonetheless, in the case of ANP the spreading of influence is not made to follow a top-down structure, rather it can follow any direction, thus building a network of influences. Alternative solutions to a stated problem can be considered as decisional elements and can receive/spread their influence from/towards other decisional criteria. In this way, non-regular structures of preferences can also be taken into account: as a person is aware of what the alternatives are, he/she can be willing to revise the importance assigned to each decisional element, thus showing a circular structure of preferences.
As we move from the fashion industry [15] to the pharmaceutical industry, we need to reshape some of the brand equity determinants, to be more industry-specific. In fact, the former industry is characterized by products with less tangible features which can more easily connect with consumers' inner feelings and desires. By contrast, products from the latter are often purchased by consumers that cannot postpone the fulfilling of specific health needs.
2. Methodology
The Analytic Network Process is a methodology developed by Thomas L. Saaty[16, 17], which is useful in dealing with complex problems and decisions that require multiple evaluation criteria and are characterized by bounded rationality. The ANP is a generalization of the Analytic Hierarchy Process: both methodologies are based on the consideration that solving a complex problem as a whole can be an issue that is too difficult to deal with. Therefore, the problem is treated as a system and is decomposed into less and less complex subsystems, so as to understand their operating principles. In doing so, however, it is important not to lose sight of the relations among the various parts that form the whole system. In the AHP these relations are accounted for by a hierarchical decomposition structure, whereas in the ANP they are represented by means of a network structure. In this latter representation, decisional elements are grouped together in clusters on the basis of their functional or structural homogeneity. The various decisional elements affect one another and they contribute to the solution of the main problem with a different degree of importance. So an element will be important if it assumes a priority over a great number of decisional variables. Therefore, the network of priorities has to be built and analysed. In this network, there is an arrow from a cluster Ci to a cluster Cj if some elements in Ci assume a priority over at least one element in Cj. Moreover, there is a loop on a component Ck, if some elements in Ck affect at least one other element in Ck. When we deal with decisions, one of the clusters has to be dedicated to the alternative solutions; knowing which are the possible solutions to the problem, indeed, can affect the importance that the decision maker attributes to the various elements.
Once the network of dependences has been built it is necessary to determine the impact of each decisional criterion over all the others, both on direct links and on paths of whichever length. To this end, the decision maker has to express an opinion on the importance of each element over the others to reach the goal, analyse the network structure and select the connected components. Given two connected components Ci and Cjan element in Cj is chosen as the control criterion and the elements in Ci are pairwise compared to determine which of them affect it the most. This step can be handled with an AHP logic: given the control criterion, a pairwise matrix is built in order to compare all the elements which affect the control criterion. For each couple of elements in the matrix the decision maker has to express a judgment on the relative importance in affecting the control criterion. In this step the decision maker can make use of Saaty's semantic scale (Table 1).
Saaty's AHP semantic scale Source: [18]

If the judgments are consistent, the corresponding normalized principal eigenvector can be used to synthesize the local priorities of elements in Ci over the control criterion in Cj.
Local priorities among decisional elements are summed-up in a so-called supermatrixW, which has as many rows and columns as the number of decisional elements in the network. Decisional elements shown in this matrix are subdivided by components. Therefore, it is possible to find blocks in W, which correspond to the intersection between clusters Ci and Cj. If there is not a priority among the elements in Ci and the elements in Cj, the corresponding block of rows and columns in W will be identically null; otherwise, in the block between the two components we will find the local priorities of the elements in Ci over the elements in Cj, determined through the pairwise comparisons of the AHP methodology.
It may happen that not all the components have the same importance in reaching the goal; therefore, the local priorities of the elements in Ci over the elements in Cj have to be weighted, considering the priority of Ci over Cj. Weights can be determined through a control hierarchy, in which all the components of the ANP structure are pairwise compared by making use of the AHP.
The combination of the priorities in the supermatrixW with the priorities among clusters gives a stochastic supermatrix WS, in which the generic element Wlk represents the impact of the element el in Ci over the element ek in Cj, which is already weighted on the impact of the component Ci over Cj. The matrix WS can be considered as the adjacency matrix of a graph, in which arcs represent the priority network and their values impact between the two elements. Again, an element will be much more important for the decision making process if it impacts on a higher number of other decisional elements – impact, is measured not only on direct arcs, but also considering indirect influences over all the possible paths in the graph. Accordingly, these influences can be determined calculating WSk, with k→+∞, and are called Limiting Impact Priorities (LIP) of decisional elements; these priorities are defined between each pair of elements in the network. On the other hand, it is possible to determine a synthetic index for the priority of an element over the whole network: this index is called Limiting Absolute Priority (LAP) of the element; it can be proved that it is represented by the principal eigenvector of WSk. LIP and LAP depend on the characteristics of primitivity and reducibility of WS: if WS is imprimitive and irreducible then LIP does not exist.
The ANP allows structuring complex models of influence spreading, which accounts for Benefits, Opportunities, Costs and Risks (B.O.C.R. models): a super-hierarchy has weights for the four macro-categories (B, O, C, and R) – or for a part of them; starting from each category, a network of influence among elements is developed.
3. The B.O.R. model for OTC drugs consumer-based brand equity
In order to develop a model to measure consumer-based brand equity for OTC drugs, we need to identify a set of determinants which can affect consumer choices. We started from the determinants of consumer-based brand equity defined in [15], adapting them to the present case study.
First of all, we structured three macro-clusters for our model – including Benefits, Opportunities and Risks. It is worth nothing that our model does not include any determinant of the brand value pertaining to the cluster of Costs. This choice is mainly due to the peculiarities of the analysed scenario. To give an example, we can consider the price of the offered products and the time spent to reach the selling point: these two elements (costs) are pretty comparable for all the analysed drugs; accordingly they do not make a real difference in a consumer's choice, so they were not included in the model. What is more important in this context is that the price of the product has to fit their quality and characteristics – and such a decisional element has been included in the Opportunities cluster. Then, we identified the decisional elements for each of the macro-categories and grouped them in clusters, consistently with the homogeneity conditions (the structure of the model is presented in Table 2). We were careful not to include more than nine elements in each cluster and no more than nine clusters in each network, so as to respect the principles of ANP/AHP methodology [18].
Drivers of consumer-based brand equity for OTC drugs
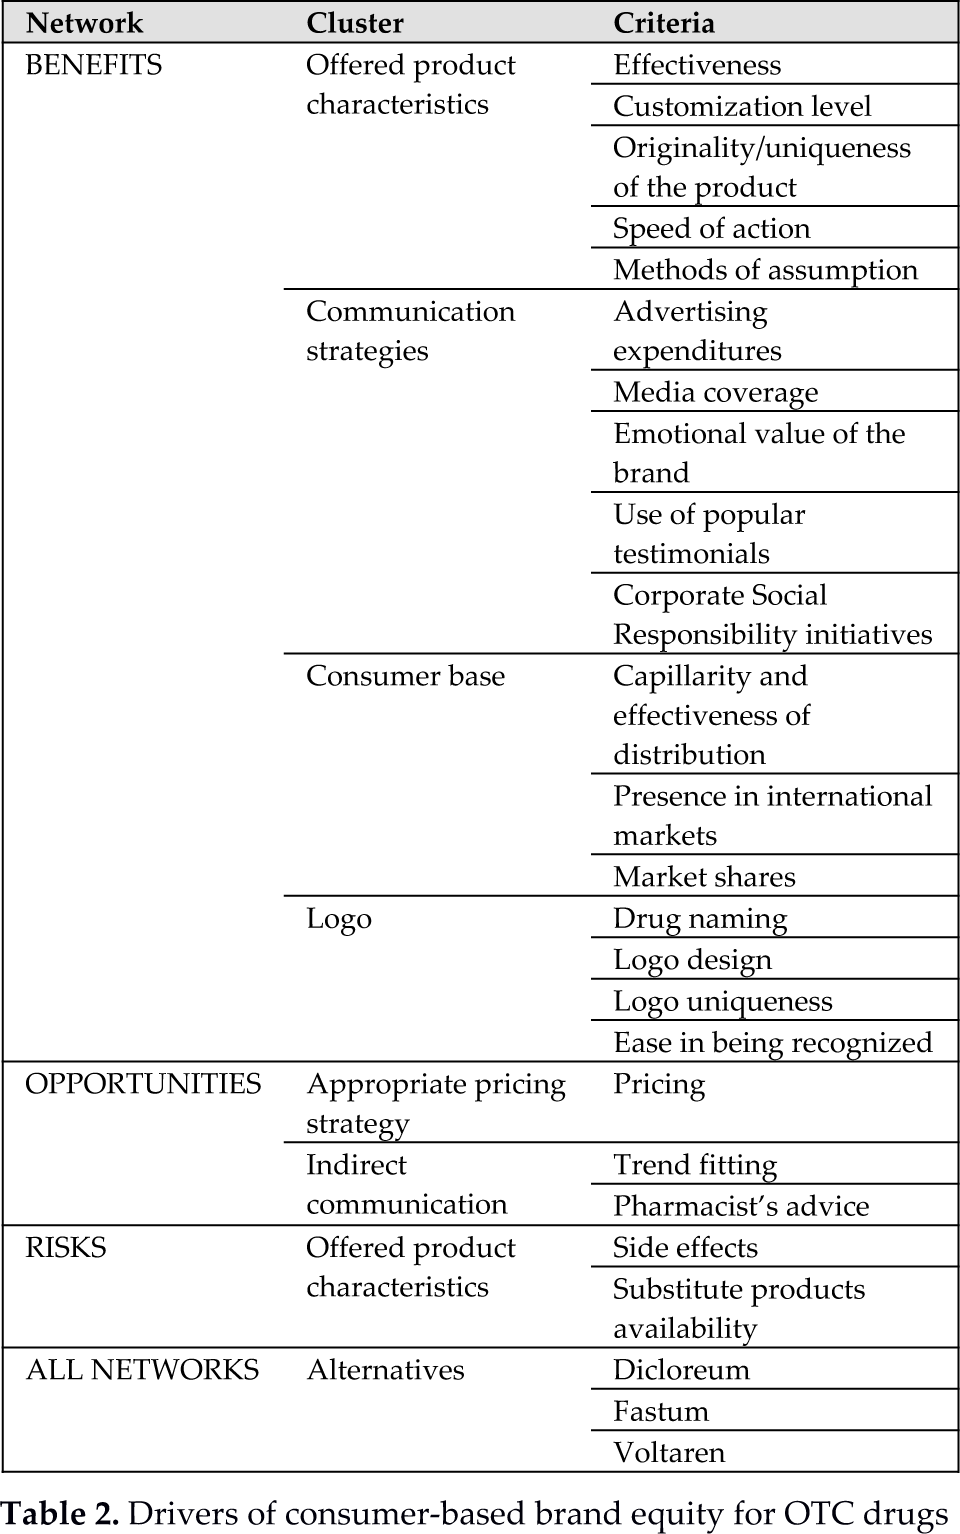
The main changes, compared to our previous work, concern the brand-equity determinants, which have to be revised on the basis of the specific nature of the products we are now considering. To give an example, the criterion “quality” presented in [15] can be translated as “effectiveness” in this study; “customization possibilities” is equivalent to “customization level”. Having also included the networks of opportunities and risks, “trend fitting” can be moved to the former network and grouped together with “pharmacist's advice”; additionally, some other product characteristics can be considered as risks, such as the possibility of experiencing “side effects”.
The cluster “communication strategies” has lost three elements, as we believe that “point of sale design”, “frequency of interaction with customers” and “sexual references in the advertising message” are not applicable to the OTC drugs market. In the same way, the cluster “strategies for building customer loyalty” loses most of its meaning when dealing with drugs and, therefore, does not appear in the network.
As regards the alternatives, this cluster encompasses three non-steroidal anti-inflammatory drugs (NSAIDs) with Diclofenac as the active principle. The brands are all well-known in Italy and are among the most popular and widely used:
Dicloreum, produced by Alfa Wassermann Ltd.;
Fastum, produced by A. Menarini Industrie Farmaceutiche Riunite Srl;
Voltaren, produced by Programmi Sanitari Integrati Srl.
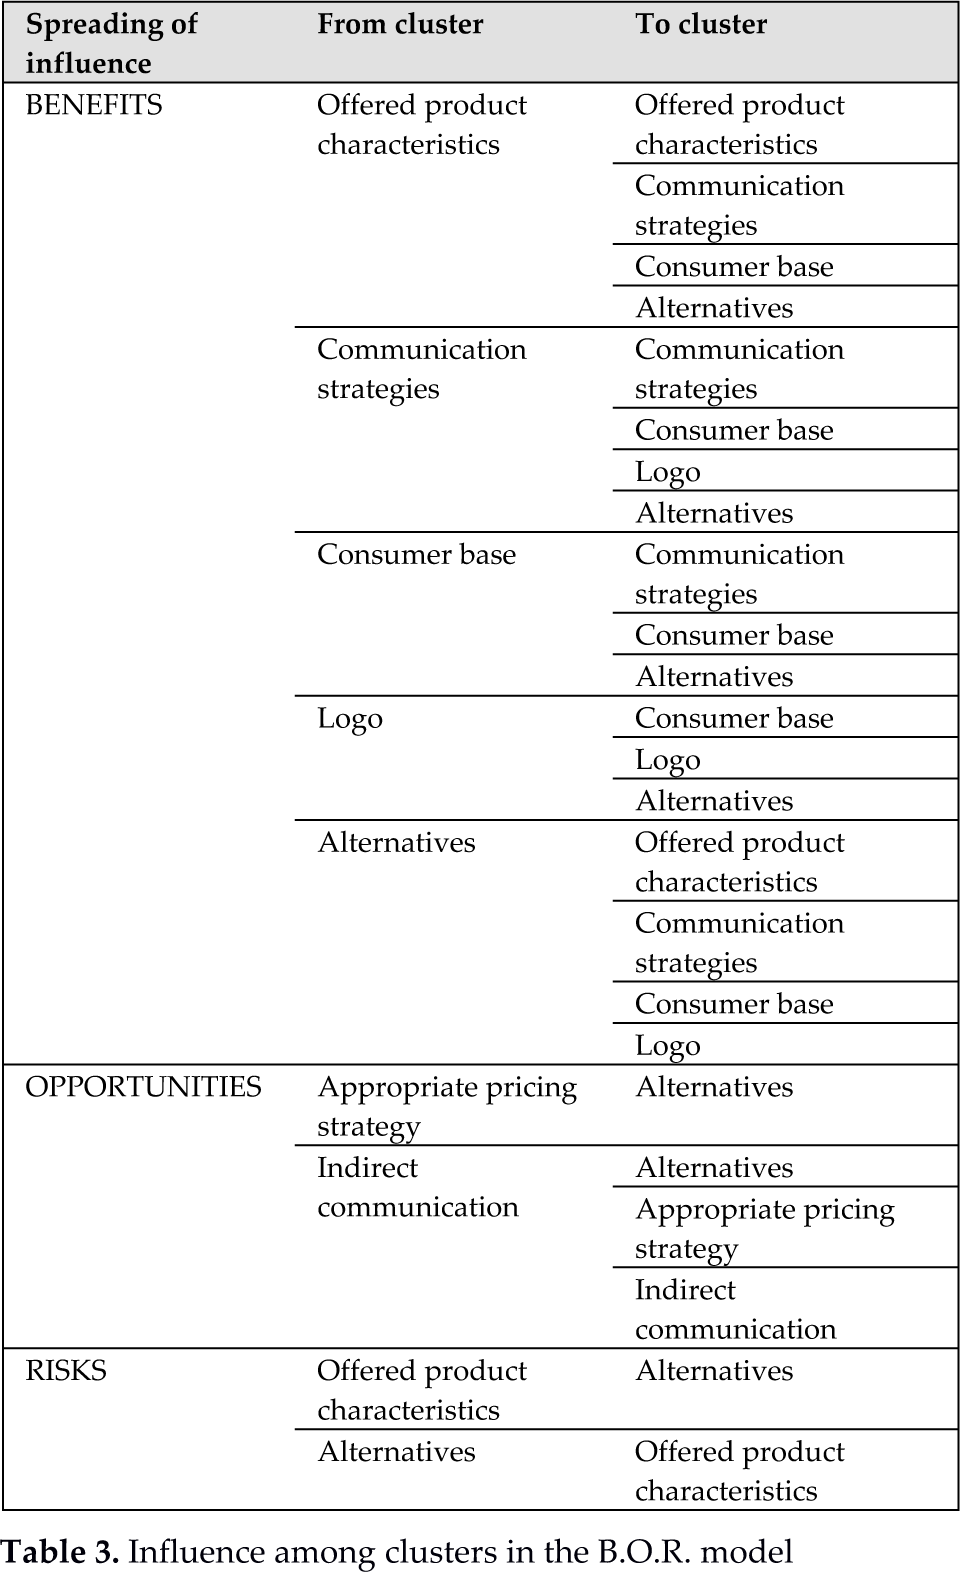
The cluster of the alternatives has to be considered for all the three networks of influence in the B.O.R. model. The spreading of priorities in the networks is summed up in Table.
Influence among clusters in the B.O.R. model
Finally, a super-hierarchy is added to allow different importance coefficients for benefits, opportunities and risks in the model, as shown in Figure 1.
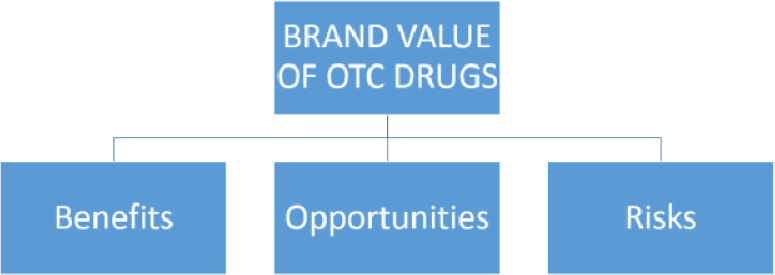
Super-hierarchy of the B.O.R. model
4. Data collection
In order to assess the importance of each driver of brand value for OTC drugs, we designed a survey made of 60 questions for as many pairwise comparison matrices and we administered it to a sample of 60 potential and actual customers of the three drugs.
Since consistency of pairwise comparisons is a major issue in AHP/ANP, the survey has been administered by means of direct interviews and making use of a pre-organized Office Microsoft Excel worksheet; as each respondent gave his/her judgments the worksheet displayed the correspondent consistency ratio value and, if not acceptable, it automatically suggested the judgment needed to be revised, according to the methodology proposed by Saaty[18]. The interviewee could accept the revision or not.
In this way, at the end of the interviewing process, almost all the collected judgments were consistent. Individual judgments were aggregated in the form of a synthesis matrix, by calculating their geometric mean.
Starting from aggregate judgments, we built the following for the three networks:
the unweightedsupermatrix;
the control hierarchy;
the weighted supermatrix.
Both benefits and opportunities supermatrices are primitive; the risks supermatrix is cyclic with cyclicityc=2. Anyway, both LIP and LAP do exist and can be determined. Moreover, we were able to assign weights to the subnetworks of benefits, opportunities and risks, by means of the super-hierarchy.
5. Results
The ANP solution provides results for the three subnetworks and the absolute priorities for the whole B.O.R. model.
Local and global priorities of decisional elements in the B.O.R. model

Local and global priorities for the identified drivers of brand equity are shown in Table 4. Table 5 shows the overall outcomes for the alternatives, determined using the formula
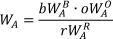
where:
WA is the global weight of alternative A in the B.O.R. model;
WAB, WAO and WAR are the local weights of alternative A in the three networks of benefits, opportunities and risks;
b, o, and r are the weights of benefits, opportunities and risks with respect to the goal of assessing brand value.
Overall outcome for alternatives
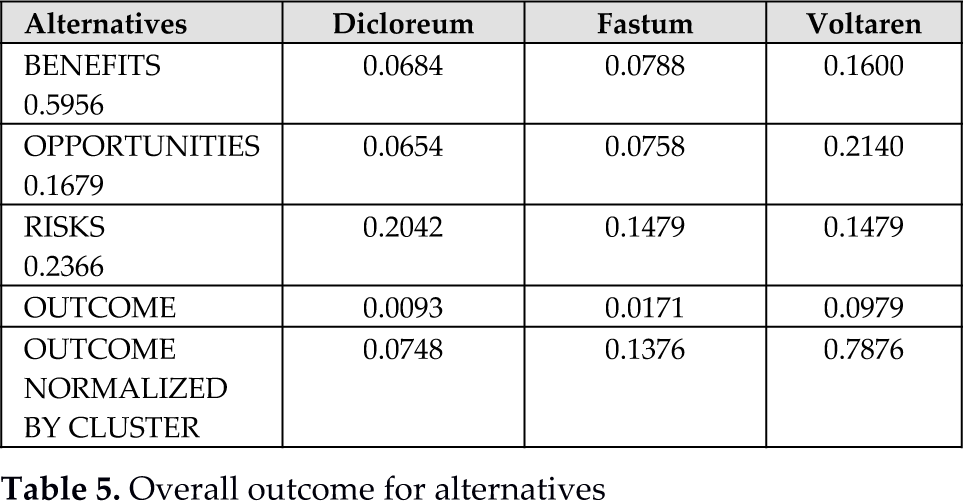
As can be noted, the main category is that of benefits, which accounts for roughly 60% of brand value. In this category, the main drivers are “advertising expenditures”, “presence in international markets” and “media coverage”, which, when combined, amount to almost 25% of global priority, corresponding to more than 40% in the benefit category. In the “opportunity” category, the three criteria have roughly the same importance, with a slight preference on “appropriate pricing strategy”. Finally, looking at risks, the main driver is the availability of “substitute products”, whereas “side effects” accounts for 10.66% of global priority, corresponding to 46% in the risk category.
The overall outcomes for the alternatives show that – balancing benefits, opportunities and risks – the preferred OTC drug is Voltaren (79%), followed by Fastum (14%) and Dicloreum (7%).
This ranking among drugs is consistent with the one presented by the Italian Board of Health, which shows the list of the 50 OTC drugs supplied to most drugstores and authorized shops in the first half of 2012 1 : Dicloreum does not appear in this list, therefore, it is not among the first 50 drugs.
Our results can also be compared with a report 2 made by Federfarmaco Ltd., which is an association of 26 cooperatives of drugstores, with a total of 11,400 stores all over Italy (together they represent 35% of business volume for the intermediate supply of medicines). This report compares the market shares of five Diclofenac-based drugs – including Dicloreum, Fastum and Voltaren – before and after a suggested price cut for Fastum products in some drugstores. 329 drugstores took part to this event and 99 of them put the suggested price cut into effect. The event took place in April 2013 and Federfarmaco monitored the market shares, both in participating and non-participating drugstores (the results are presented in Table 6).
Market shares of Diclofenac-based drugs (Source: Federfarmaco 2 )

If we normalize market shares considering only the first three players, we obtain the values in Table 7; this table also shows the compatibility index (SI) values resulting from the comparison with final scores from our model: this index allows the comparing of two vectors of priorities and checking if they can be considered similar [19].
SI index for normalized market shares of diclofenac-based drugs

Our results are significantly similar to the rankings presented in Table 7. Consistently, we find more evidence to support our model.
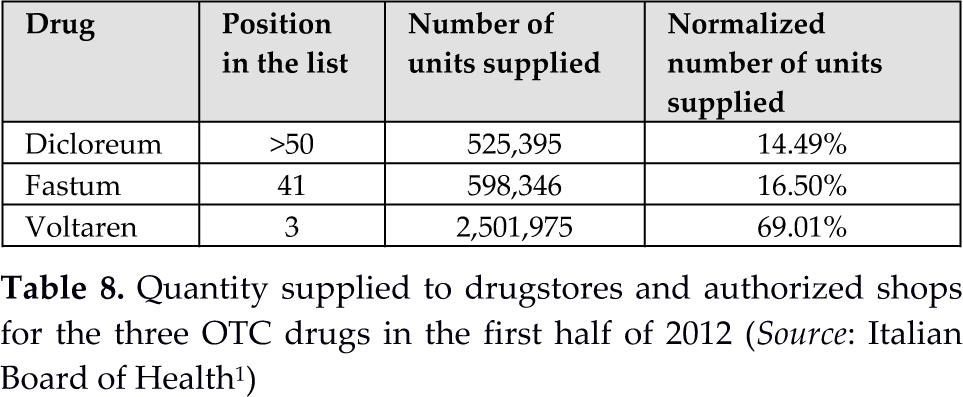
To extend the comparison between our results and the market shares at a national level we once more consider the list of the Italian Board of Health 1 . This list also shows the number of packages supplied for each drug (Table 8). As Dicloreum is not in the list, we assume for it to have the same quantity as for the 50th drug (Zerinol). This is the best possible situation for Dicloreum.
Quantity supplied to drugstores and authorized shops for the three OTC drugs in the first half of 2012 (Source: Italian Board of Health 1 )
The comparison between our results and the official data of the Board of Health provides a value for SI of 1.1118, higher than the admissible upper bound – equal to 1.100 – set by Saaty for the compatibility index (see [19]). We are exceeding this limit of 1.18%. This result can be due to a higher hypothesized provided quantity for Dicloreum than the actual one.
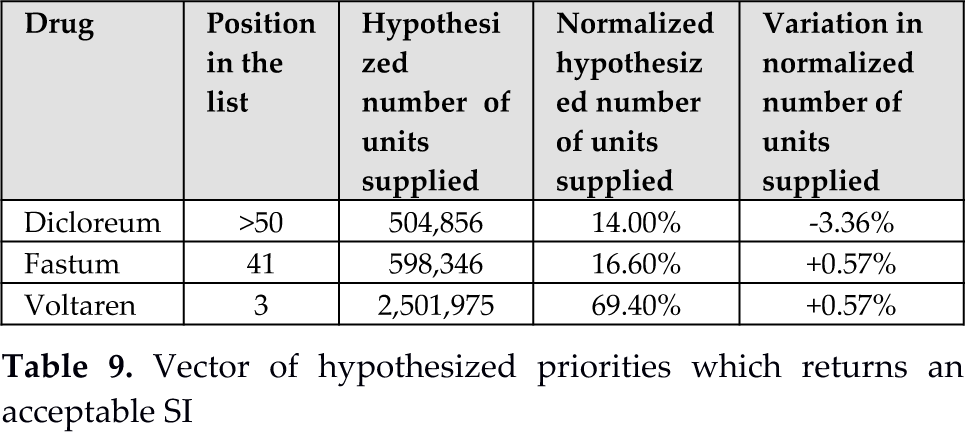
If we hypothesize a lower value for the provided quantities of Dicloreum SI improves: in particular, SI reaches its admissible upper bound for a provided quantity of 504,856 units, which corresponds to a decrease of 3.91% in the hypothesized quantity. If this is the case, the new vector of actual priorities for our OTC drugs would be that shown in Table 9. It is worth noting that the variation in actual priorities of Fastum and Voltaren is lower than 1%, while that of Dicloreum is slightly over 3%. Therefore, a little error in estimating the correct value for Dicloreum provisions can be the cause of our exceeding SI: a little adjustment would be required in order to obtain an acceptable SI value.
Vector of hypothesized priorities which returns an acceptable SI
Provisions of Dicloreum should not fall below 152,150 units, a value which determines SI to rise again to its acceptable upper bound. Therefore, all provisions of Dicloreum in [152,150; 504,856] – which corresponds to an interval [4.68%; 14.00%] for Dicloreum share in the set of our three OTC – gives an acceptable SI value. This is likely to happen, as the report by Federfarmaco shows.
6. Discussion and conclusions
We propose an ANP model to identify and assess the major drivers of consumer-based brand equity for OTC drugs in the Italian self-medication market. In 2012, these medicines represented 72.3%, in terms of volume, of the non-prescription market, which in turn amounted to 13.3% of the whole medication market [20]. OTC drugs can be an important source of value for drug manufacturers, as prices are not constrained by law and product characteristics can be promoted via advertising (under the approval of the Italian Board of Health). Moreover, self-medication consumers' behaviour is not imposed by physicians through prescription: consumers are free to choose whatever drug they like to fulfil their health needs. Brand value, therefore, emerges as a valuable asset for medicine manufacturers and has to be effectively managed.
In our model, we hypothesize three macro-categories of drivers (Benefits, Opportunities and Risks), each made of different clusters, influencing consumer choices. The results show a sharp priority of benefits, which account for almost 60% in determining consumer behaviour. Among the benefits, the highest importance is given to “communication strategies”, followed by “consumer base”. Among the drivers of communication strategies the highest priority is assigned to “advertising expenditures” (20.74% among benefits), followed by “media coverage” (9.71%), “use of popular testimonials” (8.83%) and “corporate social responsibility initiatives” (7.32%). These four out of five drivers of communication strategies occupy the first four positions in the priority ranking of benefits. “Communication strategy” cluster has roughly 50% of priority.
Generally speaking, one may think that, investing in advertising for OTC drugs is not beneficial to their consumption [20]: in fact, consumers choose to acquire self-medication drugs only if needed, given the peculiar nature of these products. By contrast, our analysis points out that “communication strategies” play a major role in guiding consumer behaviour. This is probably due to the existence of more than one OTC drug, which can compete to fulfil a specific health need. Accordingly, the consumer has the duty of choosing among different products. In this setting, advertising can guide a consumer's choice toward the selection of one specific brand over the competing alternatives. This is also supported by the results for drivers of risks, where the main reason not to choose a specific drug is set on “availability of substitute products”, which has a higher priority than the risk of incurring in “side effects”. Moreover, the opportunity network results support the previous considerations: in fact, the first driver appears to be the setting of an “appropriate pricing strategy”, followed by “pharmacists' advice”: both these criteria can be thought of as indirect communication elements, even if they have different nature and characteristics.
It is interesting to notice that, among benefits, the first eight positions are not occupied by any of the product characteristics, which account for only 15% of benefits. This is mainly because our study considered products with the same active ingredient that are also sufficiently homogeneous in their effects. Finally, the last positions in the ranking of benefit drivers are dedicated to three out of four elements in the “logo” cluster, which only accounts for 13% of benefit priorities.
In the practice of management, organizational and less tangible factors often play a role that is stronger or equivalent to technical ones [21]. In a very peculiar industry, such as the pharmaceutical one, it will be useful to cross-subsidize R&D and new product development activities, to invest in these activities and to recognize the importance of intangible assets, which is vital to maintain a competitive advantage [22]. Accordingly, we suggest integrating a deep understanding of customer needs, values and perceptions within the knowledge management practices. Indeed, the pharmaceutical industry is a knowledge-intensive industry: for firms operating in such an industry to overcome their competitors Zack suggests a knowledge strategy made up by the combination of exploitation of existing knowledge and the exploration of new knowledge [23]. In fact, according to Zack “exploration provides the knowledge capital to propel the company into new niches while maintaining the viability of existing ones. Exploitation of that knowledge provides the financial capital to fuel successive rounds of innovation and exploration. Exploration without exploitation cannot be economically sustained over the long run unless it is subsidized or directly generating a revenue stream (e.g., a research institute). Exploitation without exploration will ultimately result in trying to pump from a dry well.”
To conclude, we maintain that our model can help manufacturers in addressing the most effective drivers to improve their presence in the market and to exploit the potential value of their non-prescription drugs – advertising above all.
Footnotes
7. Acknowledgments
We wish to thank Telecom Italia S.p.A. for financially supporting this research.