
Abstract
The condition of the interfacial area and interphase region in a nanocomposite can significantly affect its mechanical performance. In this research, the tensile performance of a POM/CaCO3 nanocomposite, including the modulus of elasticity and tensile strength, are analysed using different mathematical models and the Ansys FEM software. The mechanisms of the plastic deformation and crazing of the POM/CaCO3 nanocomposite were investigated using FEM. Furthermore, the effects of interface adhesion and the interphase property on interfacial debonding, as well as tensile properties, were analysed. The tensile strength of the nanocomposite could not be greater than that of bulk POM because of the failure which was initiated from the matrix. By stiffening the interphase and increasing the adhesion between nanoparticle and polymer, the nanocomposite's elastic modulus and strength were increased. Two toughening mechanisms, including plastic deformation and crack initiation, were observed in the POM/CaCO3 nanocomposite. The high interfacial adhesion of the matrix to the particles led to the formation and propagation of crazes along the extension load in the POM matrix. The tensile strengths of different nanocomposites were over-predicted by the Pukanszky model, while the moduli magnitudes estimated by the Ji mathematical model were less when compared to those determined by FEM.
1. Introduction
The incorporation of mineral particles into polymers can improve their mechanical properties. The higher stiffness of mineral particles can lead to the incremental increase of a composite's stiffness [1]. Micron-sized particles usually cause a reduction in impact resistance [2]. On the other hand, using nanoparticles can lead to better impact and wear performance [3]. Adhesion between nanoparticles and the polymer matrix can affect a composite's mechanical properties [4]. Decreasing the interfacial strength could cause the interfacial debonding of particles from the matrix [5] and, as a consequence, the tensile strength of the composite could be reduced. Interfacial debonding can also cause shear yielding of the matrix around the particles [6]. Conversely, when particles are bonded perfectly to the polymer, this can cause the matrix to craze around the particles such that, as a consequence, impact resistance is reduced [7–10]. The optimum interfacial adhesion strength for a composite should be slightly lower than the polymer crazing strength. The nanocomposite should provide a degree of adhesion that controls the initiation time of interfacial debonding in order to maximize toughness. However, the interfacial adhesion strength should not be too low so as to significantly scarify the modulus and other mechanical properties [7]. Chen et al. proposed a model based on meso-mechanics to predict the interfacial strength under uniaxial loading, and they concluded that the critical particle size for debonding depends on the degree of adhesion between the nanoparticles and the polymer matrix [11]. Zappalorto et al. described the role of the interphase region in interfacial debonding conditions under hydrostatic loading [12]. Salviato et al. demonstrated - for the stiff nanoparticles - how the elastic properties of the interphase regions play a prominent role in determining debonding strengths [13]. Lin et al. demonstrated that the debonding of particles from the polymer matrix can increase the impact energy, even though the tensile strength declined [14]. Zhang et al. employed different nanoparticle surface modifiers in PA66 nanocomposites. The increase in the glass transition temperature indicated a stronger interaction between the nanoparticles and the matrix, and this led to the increment in the tensile strength of the nanocomposites [15]. Wang et al. showed experimentally that there is an interphase region in nanocomposites which is stronger than the polymer matrix and which has a significant effect on the mechanical properties of the nanocomposites [16]. The large interfacial area between a nanoparticle and the polymer matrix elevates the crystal nucleation of the polymer in a thin interphase region around the particle [16]. The existence of an interphase region with a higher strength and modulus than the polymer matrix would cause the composites to have superior mechanical properties [17]. On the other hand, stress concentration induced by nanoparticles could have a negative effect on the yield strength. Xie et al. showed that nanoparticles act as stress raisers, leading to the debonding/voiding and deformation of the matrix material around the nanoparticles and which can affect the composites' mechanical properties [18]. The dispersion of nanoparticles in the polymer matrix could directly affect the mechanical performance of composites. Very small particles are difficult to disperse, creating agglomerates that behave as a large, single particle [19]. Peng et al. considered the overlapping of polymer-nanoparticles' interphases for different particle shapes and showed that the degree of particle clustering had a strong influence on the Young's modulus of the nanocomposite [20]. This result was due to the existence of interlayer regions among the nanoparticles. Recently, Pontefisso et al. showed numerically that the particle distribution has a negligible effect on the tensile modulus of particulate nanocomposites [21]. The finite element procedure and analytical methods have been exceptionally effective in determining the mechanical properties of non-homogeneous materials like composites. The use of numerical analysis to gain better performance in composite materials is well established [22, 23]. The identification of the mechanical properties of the interphase and its modelling procedure both have a significant impact on the accurate prediction of nanocomposites' tensile properties [24]. A number of efforts have numerically analysed nanocomposites' tensile behaviour using FEM [4, 6, 20, 25, 26]. Dommelen et al. numerically compared the mechanical behaviour of polymer composites filled with rubber against mineral particles and concluded that mineral particles in semicrystalline polymers could increase both the stiffness and impact energy of nanocomposites [6]. Kemal et al. investigated the elasto-plastic behaviour of PVC/CaCO3 nanocomposites and demonstrated that voiding around the particles could enhance the toughness of the nanocomposites [4]. Boutaleb et al. developed a micromechanical-based numerical model to investigate the impact of various graded interphase regions on the tensile properties of silica-filled polymers [25]. Peng et al. developed a computational model to estimate the moduli of nano-reinforced polymer composites by taking into account the interface and particle-clustering effects [20]. Sevostianov et al. compared various approaches to modelling the interface imperfections of fibre-reinforced composites and determined a mathematical model for the spring elements in order to bring to highlight the imperfection between a fibre and polymer matrix [26]. A number of researchers have incorporated molecular dynamics (MD) modelling to estimate the interphase modulus [27–29]. According to Qiao et al., the numerical calculation of molecular dynamics can capture some structural and dynamical details of the interphase, but only at the molecular time and length scale, while continuum modelling requires material properties that are many orders of magnitude longer [30].
In the prediction of the tensile performance of nanocomposites, the interface adhesion of the nanoparticle-matrix and the interphase region around the nanoparticle have not yet been specifically defined. In this research, the tensile behaviour of POM (Ultraform N2320-003)/CaCO3 (Socal 312) nanocomposites was numerically analysed by employing the ANSYS-14 FEM software. In this respect, the representative volume element (RVE) method was implemented; the interphase region and interfacial adhesion characteristics were brought into account. Moreover, the results of the FEM method were compared to those predicted by mathematical models.
2. Mathematical and Numerical Approaches
Mathematical and numerical methods are conceptually valuable resources in predicting the properties of nanocomposite materials before production. The mathematical and numerical models used in this research are described in the following subsections.
2.1 Mathematical Models
The tensile properties of nanocomposites, including their tensile strength and elastic modulus, were analysed via micromechanical models. The modulus magnitude depends on two possible factors, namely interfacial adhesion and the matrix's crystalline structure [7]. The interfacial strength can have a noticeable effect on a nanocomposite's tensile strength [31]. The incorporation of a surface modifier can improve matrix-particle interfacial contact. The surface modifier also has a nucleating effect, and this may lead to crystallinity promotion and, as a consequence, the modulus may increase [7].
2.1.1 Analytical models for elastic modulus prediction
Micromechanical models for predicting the elastic moduli rarely correspond to the experimental approach because they ignore the interphase layer around a nanoparticle. These models mostly include parameters such as particles volume fraction, polymer matrix and filler moduli. A number of researchers have suggested analytical models to calculate the elastic moduli of two-phase systems, including the Enistein [32], Guth [33] and Mooney [33] models, as described respectively by equations (1)-(3). These all assume perfect bonding between the containing phases as well as the absence of interaction among adjacent particles:
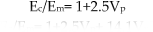
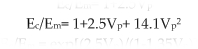

where Ec and Em are the elastic moduli of a composite material and a bulk polymer, respectively, and Vp is the volume fraction of the particles in the composite material.
In order to bring into account the effect of the interphase region on the elastic modulus, three-phase models which consider the interphase region have been implemented, including the Ji [34], modified Lo [35], M-T [36] and self-consistent [37] models. Among these models which consider the interphase region, only the Ji model can account for the variation of the modulus along the interphase thickness. In this research, Ji's model, as given by equations (4-a)-(4-f), was employed to predict the nanocomposite modulus:


where r and τ in equation (4-b) denote the particle radius and interphase thickness, respectively. Ef in equation (4-e) is the elastic modulus of the particle and Ei(0) in equation (4-f) is the elastic modulus of the interphase region adjacent to the particle.
2.1.2 Analytical models for tensile strength prediction
There are many empirical and semi-empirical models which have been proposed to estimate the tensile strength of composite materials [31]. Most models of tensile strength prediction do not consider interfacial adhesion between the particle and the matrix. However, the tensile strength of a nanocomposite mainly depends on the adhesion between the nanoparticle and the matrix [31]. The model proposed by Pukanszky et al. [32], as given in equation (5), takes adhesion between a filler and the matrix material into consideration:

where σc and σm are the tensile strengths of the nanocomposite and the bulk polymer, respectively, and β is the adhesion coefficient of the particles to the polymer.
2.2 Finite Element Approach
In this research, a cylindrical RVE was implemented to analyse the tensile behaviour of POM/CaCO3 nanocomposites (Figure 1).
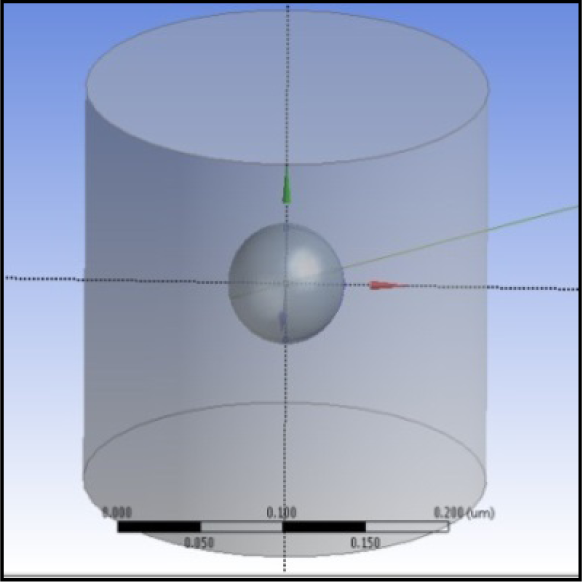
Cylindrical RVE
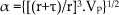
A cylindrical RVE with an equal height and diameter provides the best configuration for accurately determining the mechanical properties of particulate composites [38]. The determination of the RVE's dimensional conditions requires the establishment of a volumetric fraction of spherical nanoparticles in the composite. Hence, the weight fractions of the particles were converted to volume fractions. The volume fraction of a particle in the RVE (Vp

where, r represents the particle radius and a indicates the diameter of the cylindrical RVE. The volume fraction of the particles in the composite (Vp) is obtained using equation (7) [22]:

where dm and dp denote the matrix and particle densities, and mm and mp indicate the matrix and particle weight fractions, respectively; mp was chosen to be 0.05, 0.1, 0.18 and 0.25; the particle radius (r) was taken to be 35 nm. The RVE dimension (a) was determined by equalizing equations (6) and (7). The characteristics of the polymer matrix and filler particle were selected as reported in [39] and [1] respectively (Table 1).
The materials' properties as used in the FEM simulation

The experimental data of the plasticity stress-strain curve of the tensile test for the bulk POM (Ultraform N2320-003) [39] was converted to the true stress-strain curve (Figure 2) using iterative trial and error and the weighted average method, as proposed by Ling [40], Zhang et al. [41] and Joun et al. [42]. The intersections of the true stress-strain curve and the slant parallel lines were used to define the numerical values of the true stress and plastic strain in Ansys.

The true and experimental stress-strain curves of the polymer matrix
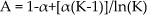
Three types of RVE schemes with different interphase regions were modelled. The first RVE had no interphase region and employed the Mori-Tanaka method [28, 36], but its phases were not perfectly bonded to each other, whereby different adhesion ratios were applied between the matrix and the filler. In the second RVE model, the effective interface model (EIM) was used and it was assumed that the equivalent-continuum interphase region was continuous and homogeneous [17], assuming an elastic modulus of 3.5 GPa for the interphase region (which is relatively more than that of the bulk polymer modulus (2.7 GPa)). In modelling the third RVE, a graded interphase [25] was incorporated in 10 different layers. The layers' moduli and Poisson coefficients varied exponentially along the particle radius between matrix and particle using equation (8) [17]:

where: R= r/ri, R(f)=rf/ri.
where t may be either E or ν, such that E represents Young's modulus and ν is Poisson's ratio. In addition, r is the radial distance from the particle centre; rf and ri are the particle and interphase outer radii, which have taken to be 35 and 45 nanometres respectively. The loading on the RVE is defined as symmetric displacement, which provided equal displacements at both ends of the RVE. In order to examine the crazing and nonlinear effects, the large deflection analysis was employed. To obtain the nanocomposite modulus and yield strength, the force reaction is defined against displacement. In order to converge a nonlinear problem, as previously defined, simulation parameters comprising the mesh-type and - size for both matrix and filler were evaluated.
The features, applications and size ranges of the corresponding elements are presented in Table 2. The elements' dimensions were chosen in such a way that any smaller values would not affect the results [43]. The large strain PLANE183 element was used in the matrix and the interphase regions in all the models. In order to model the adhesion between the interphase and the particle, a COMBIN14 spring-damper element was used. The stiffness of this element varies between nil to unity, which determines the interfacial strength for the interface region.
Elements features, applications and size ranges used in RVE modelling

In modelling the interface, the spring element was selected because it could tolerate a certain stress within the interphase and particle. The magnitude of aforementioned stress was equal to the debonding strength of the interface region. When the equivalent stress in the interface region reaches the debonding strength, the element breaks down and, subsequently, the two mentioned phases are separated. The spring stiffness values which were employed in this research included 0, 0.1 and 1, and were used for non-bonded, partially bonded and perfectly bonded samples, respectively.
In order to obtain a better convergence in modelling, it was required that all the phases existing in the RVE model should have a mapped meshing [43]. An example of the mapped meshes used for the RVE modelling (second RVE) is shown in Figure 3.
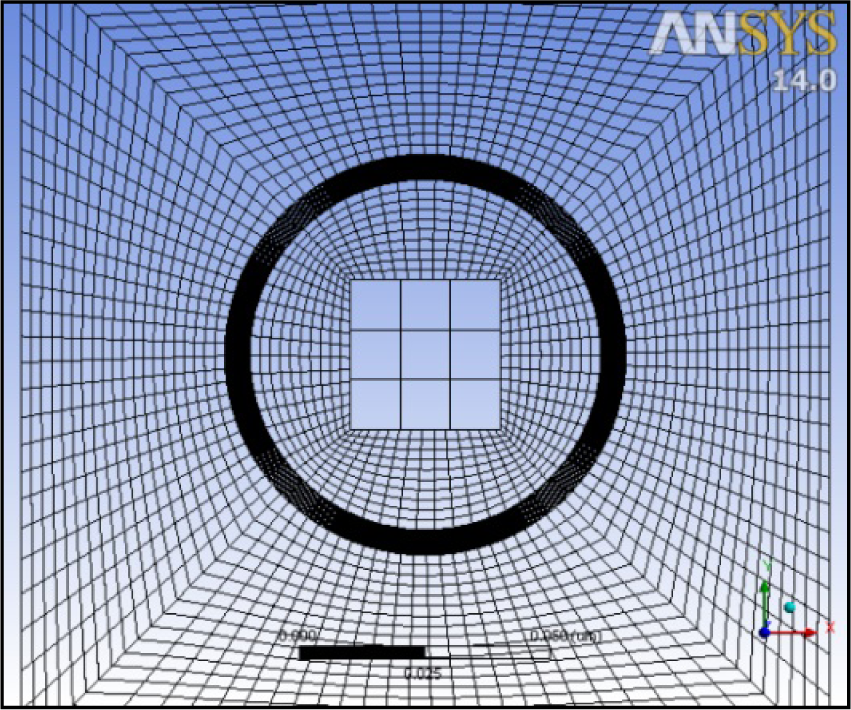
The mapped meshing used for modelling the RVE containing a homogenous interphase
To converge an exact nonlinear solution, it is also important to set the strain rates of the FEM models based on the experimental tensile tests' setups. Hence, FEM models of different RVEs with various particle contents should have comparable error values. In this respect, the ratio of the tensile test speed to the gauge length of the specimens should be equal to the corresponding ratio in the RVE displacement model. Therefore, the rate of displacement in the RVEs was set to be 0.1 (min−1), as chosen for the experimental tests for the bulk POM [39].
3. Results and Discussion
The Von Mises equivalent stress distributions in the RVE models with different interphases and interfacial characteristics are depicted in Figure 4 to Figure 6.
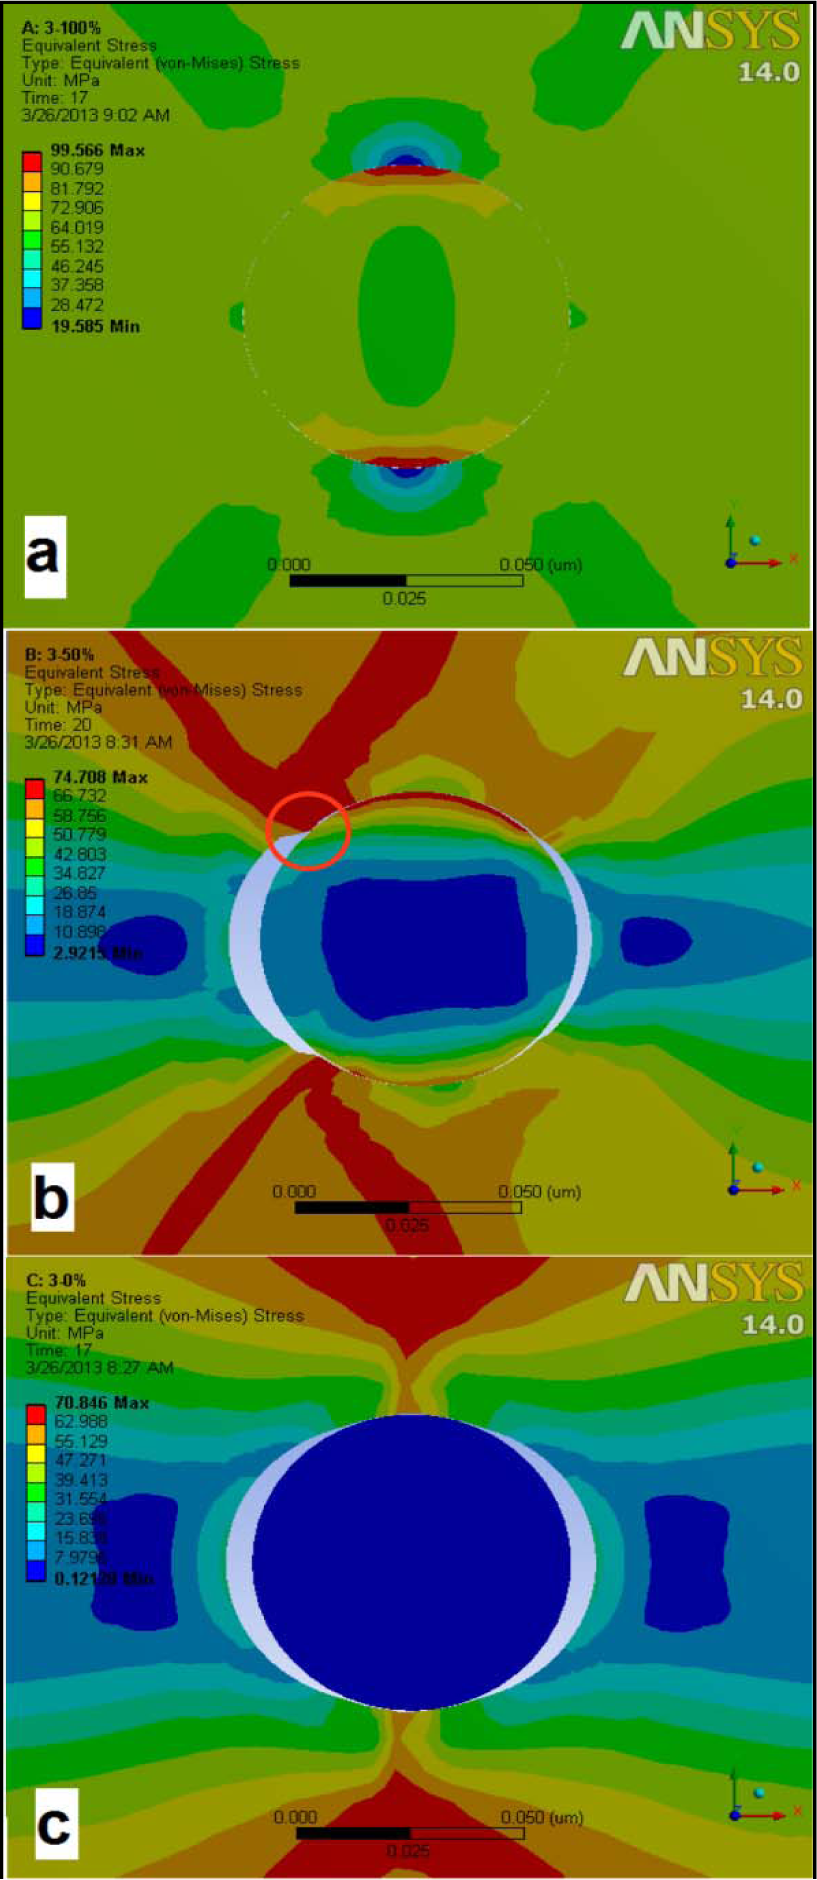
Stress distributions of RVEs without an interphase region and different adhesions: a) perfectly bonded, b) partially bonded, c) non-bonded

Stress distributions of RVEs with homogenous interphase regions and different adhesions: a) perfectly bonded, b) partially bonded, c) non-bonded
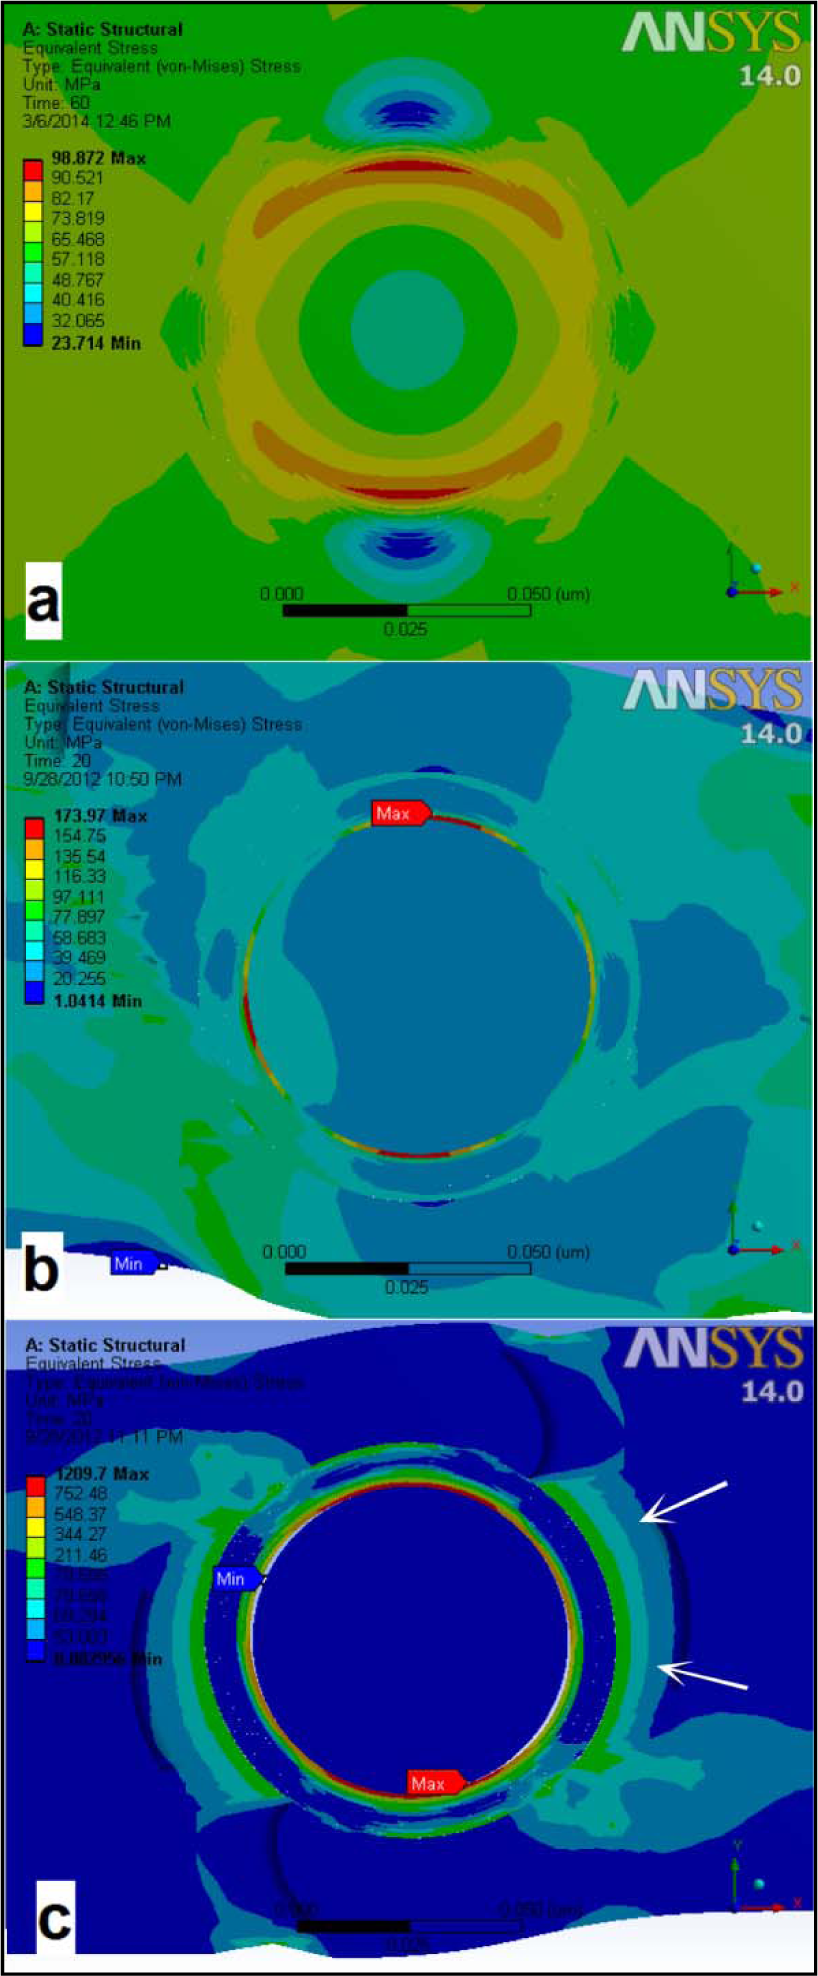
Stress distributions of RVE models with exponential interphase regions and different adhesions: a) perfectly bonded, b) partially bonded, c) non-bonded
Figure 4-a to Figure 4-c show the stress distributions around the nanoparticles for different interfacial adhesions using the first RVE model, which has no interphase region. The reduction in the contact forces between the nanoparticle and the polymer matrix led to the interfacial debonding. In Figure 4-a, the stress concentration and hoop stress around the particle can be observed. Figure 4-b shows that maximum stress occurs at the debonding region, whereby it is indicated by a circle. This result may imply that the energy used to separate the matrix from the nanoparticle is considerable, and it may lead to the improvement of the nanocomposite's mechanical properties [4].
In Figure 5-a to Figure 5-c, the stress distributions are shown for different interfacial adhesions using the second RVE model, which has a homogenous interphase region. Consideration of a homogenous interphase region led to the more uniform distribution of stress around the particle when compared to the first RVE model. The homogenous interphase played a significant role in transferring stress from the matrix to the particle. By considering the exponential variations of the properties in the interphase region (Figure 6-a to Figure 6-c), and because of the high stiffness of the interphase region, voiding occurred in the matrix rather than in the particle matrix interface.
This phenomenon was also observed experimentally by Zhang et al. for epoxy resin filled with silica nanoparticles [44].
Figure 7 shows the plastic strain contour of the RVE model for the situation involving no interphase or adhesion. According to Figure 7, the RVE is contracted plastically towards the particle along the vertical plane, which is perpendicular to the tension axis in the horizontal direction. This increases the contact area between the particle and the matrix. In addition, the deformation is propagated in the vertical direction.

Plastic strain contour
Figure 8 depicts the elastic strain contour of the RVE model by considering a homogenous interphase and perfect adhesion. In this respect, the crazing of the polymer matrix - which is due to the higher interfacial adhesion of the matrix to the particle - is observed. Moreover, it is seen that crazes are propagated parallel to the extension load.

Elastic strain and crazing contour
According to Figure 7 and Figure 8, the polymer matrix could undergo two toughening mechanisms, including plastic deformation and crack initiation.
Figure 9 shows the tensile moduli of the nanocomposites obtained by FEM and the mathematical models with respect to the weight contents of calcium carbonate nanoparticles. By increasing the nanoparticles' weight content, the elastic moduli of the nanocomposites - for perfectly bonded models - increased significantly, as shown in Figure 9-a. The Ji model provided closer results to the FEM models as compared to the other mathematical models; this was due to the fact that the existence of an interphase region was taken into account by Ji model (Figure 9-b). The Ji model underestimated the results by up to 31% when compared to FEM. According to Figure 9-a, although the moduli of the perfectly bonded/without an interphase model and the perfectly bonded/homogenous interphase model are close to each other for up to 18 wt% of nanoparticles concentration, they differ when nanoparticle inclusion reaches up to 25 wt%. According to Figure 9-a, at high level of nanoparticles concentration (i.e., 25 wt%), the existence of an interphase region considerably affects the nanocomposite's modulus, although the interphase stiffness (i.e., 3.5 GPa) differs slightly from that of the bulk polymer (i.e., 2.7 GPa).
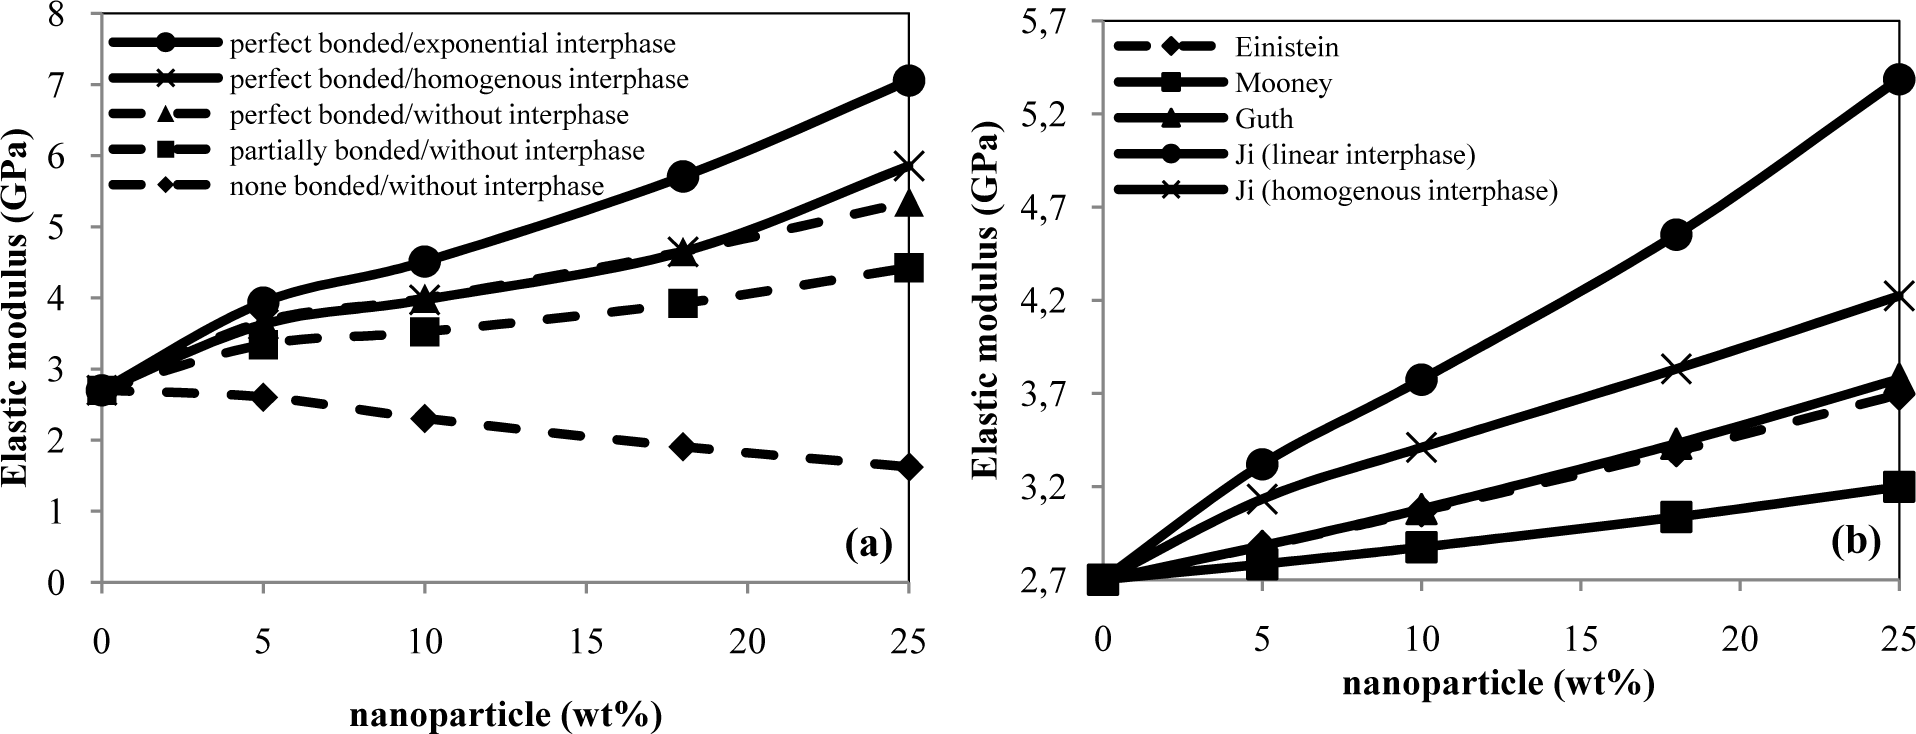
Elastic modulus of the nanocomposite against the nanoparticles' weight-percentage: a) FEM models, b) mathematical models
Figure 10-a and Figure 10-b depict the tensile strengths of the nanocomposites obtained by FEM and the Pukanszky model respectively. By the incorporation of nanoparticles, the tensile strengths were reduced in those models in which the debonding process occurred (non-bonded and partially bonded). By stiffening the interphase region (in those models which were perfectly bonded), the debonding process barely occurred and this caused the tensile strength to remain constant with an increase in the nanoparticles' weight content. In the second and third RVEs, the tensile strength remained constant with an increase in the particles' weight fraction. This was due to the failure which was occurred in the matrix region of the RVE. The tensile strengths obtained by the FEM approach and the Pukanszky model were almost equal at a high level of adhesion (Figure 10). At low levels of adhesion, the results of the FEM scheme were up to 40% lower than those of the Pukanszky model - this can be attributed to the formation of a void around the nanoparticle due to the reduction in particle-matrix adhesion. The interfacial debonding of the matrix and nanoparticle is the most effective parameter in determining the tensile properties of nanocomposites, as was also reported experimentally by Norman et al. [45]. Apart from the tensile moduli, the tensile strengths showed significant differences among those RVE models which were with or without interfacial debonding.

Tensile strength of the nanocomposite as a function of the nanoparticles' weight percentage and interfacial characteristics: a) FEM models, b) Pukanszky model with different values of β
Both the interfacial adhesion and the interphase's mechanical properties could affect the debonding time and, as a consequence, could affect the tensile properties of the nanocomposites. The results of the FEM approach and the mathematical models indicated that the inclusion of mineral particles mainly led to the improvement of the modulus. According to Fu et al., the tensile strength of a polymer nanocomposite and the load-bearing capacity of a particulate composite depend on the strength of the weakest path throughout the microstructure [31]. Hence, the addition of nanoparticles will not have any strengthening effect on the nanocomposite's structure as long as the overlapping of those interphases with a higher strength than the bulk matrix has not occurred.
4. Conclusion
In this research, the tensile behaviour of POM/CaCO3 particulate nanocomposite was analysed using the Ansys FEM software. The mechanisms of the plastic deformation and crazing of nanocomposite were investigated. Moreover, the effects of interface adhesion and interphase characteristics on the tensile properties were studied. The tensile strength of the nanocomposite could not be greater than that of the bulk polymer because of the failure which could occur from the matrix material. With interphase stiffening and increasing adhesion between nanoparticle and polymer, the nanocomposite's elastic modulus and strength increased. The elevation of used energy to separate the matrix from the nanoparticle can lead to the considerable improvement of the composites' mechanical properties. Furthermore, it was observed that the tensile strength decreased in those models in which the debonding process occurred. When the interphase layer is not formed, the extent of interfacial adhesion between polymer and nanoparticle could considerably affect the tensile strength. The moduli predicted by Ji's mathematical model were up to 31% lower, and the tensile strengths predicted by the Pukanszky model were up to 40% higher than those obtained by the FEM models.