
Abstract
This paper describes the validation process of a localization algorithm for underwater vehicles. In order to develop new localization algorithms, it is essential to characterize them with regard to their accuracy, long-term stability and robustness to external sources of noise. This is only possible if a gold-standard reference localization (GSRL) is available against which any new localization algorithm (NLA) can be tested. This process requires a vehicle which carries all the required sensor and processing systems for both the GSRL and the NLA. This paper will show the necessity of such a validation process, briefly sketch the test vehicle and its capabilities, describe the challenges in computing the localizations of both the GSRL and the NLA simultaneously for comparison, and conclude with experimental data of real-world trials.
1. Introduction
Underwater vehicles are of increasing importance for a number of research and industrial applications. With the increased application of such vehicles, the demand for improved navigation and localization capabilities is rising as well. A survey by the WHOI (Woods Hole Oceanographic Institution) [1] has identified a number of improvements which are necessary or would enable/improve certain operations. Since the development effort for improved navigation algorithms is distributed among numerous research groups world-wide, a common description of the algorithms and their capabilities would greatly improve their comparability. This work tries to move in this direction by proposing a framework for algorithm comparison. While the examples used in this work (and its origin) are from underwater localization, the framework is applicable to every localization technique which is evaluated with real data (as opposed to simulation/synthetic data, where algorithm evaluation is comparatively easy). Similar approaches have been proposed for 2D localization problems (e.g., [2] for large urban settings).
This paper is organized into six sections: After this introduction, the necessity for a validation process is explained and, against this context, the work of this paper is related to the literature. This is followed by a methodology section and a brief description of the test vehicle. In the experiments section, the results from field trials are presented and finally summarized in a conclusion.
2. The necessity of a validation process
A lot of research has contributed to the field of underwater localization in recent years. One of the main reasons for this high level of interest is the need for new algorithms which can support the multitude of new scenarios for which underwater vehicles are used. The problem of underwater localization has a high order of complexity, since a number of adverse conditions do apply:
Six-DOF problem domain: The problem of localization underwater has to be inherently handled in all degrees of freedom, as an underwater vehicle can (and will) be moving along all these degrees of freedom. Even special cases of bottom vehicles (crawlers) or surface vehicles (boats) will be subject to rough terrain or waves, respectively. For all vehicles navigating in the water column, this is further aggravated by the inability to maintain a position without active control.
No easy access to global solutions: In contrast to terrestrial applications, there is no convenient global localization information available. The signals of GPS do not penetrate the water far enough to be usable underwater (i.e., only a few centimetres), and long antennae or surface buoys are impracticable or even unusable due to currents and increasing distance from the surface (e.g., in the case of deep-ocean exploration).
Reduced communication capabilities: Since water is a very good absorber in the EM-spectrum, communication using radio is reduced to very short distances. While the modality of choice for communications is acoustics, their bandwidth and reliability are far inferior to terrestrial techniques (e.g., Iridium, WiFi).
Significant effort for testing: The number of available large controlled-condition testing facilities for underwater vehicles is severely limited. This makes the usage of the ocean or lakes necessary for testing, which comes with a huge logistical overhead and offers very limited control over environmental conditions (e.g., salinity, turbidity, currents). The most interesting applications for underwater localization take place in the ocean, the largest biosphere on Earth.
While many advances in underwater localization have been made, it is hard to compare different methods. One of the reasons for this is the lack of a suitable terminology for comparison, another reason is the problem of acquiring reference measurements under realistic conditions, due to the reasons listed above. A reference measurement in real-world data is considered to be the equivalent of a ‘ground-truth’ measurement in simulation/synthetic data. As a result, it is the authors' belief that good practice for the development of new algorithms includes the following points:
Comparison with reference measurements: The NLA has to be compared with a reference measurement in order to be characterized properly. This reference measurement should be as accurate as possible. However, the capabilities of the test vehicle need to be taken into consideration.
In-system validation: Ideally, the reference measurement is recorded simultaneously with the NLA measurement in order to avoid bias in the data. This means that both algorithms run synchronized on the test vehicle.
Validation datasets including real-world data: The validation datasets should not only consist of simulation data or controlled-environment (e.g., test tank) data. Ideally, validation data are also recorded in the environment that the NLA is designed for.
Definition and description of failure cases: Depending upon the sensors of the NLA, failure cases have to be considered. This may include environmental conditions (turbidity, inhomogeneous medium) as well as system-related conditions (available memory/processing power, power consumption).
The authors are aware that not all of these conditions may be satisfiable for every given circumstance. In particular, the availability of a good reference measurement for real-world environments is often limited. This is aggravated by the inherent recursiveness of the validation process: any reference measurement needs to be validated by another reference measurement, which makes it practically impossible to create a complete chain of validation. The only possible remedy to solve this problem is deviation from the necessity of real-world data for validation. For underwater localization, this may mean using reference data from a test tank with specialized short-range, very-high accuracy, localization systems (such as the VICON tracking system with underwater modification (T-Series camera with VIS-strobe and suitable housing) 1 ) or limitation to surface tests in open waters while using GPS as a reference. A widely-used practice is validation using spot-measurements, e.g., using GPS localization at the start and end points of an underwater run while driving a closed path [3]. All of these practices are non-ideal and provide sparse validation, but they suffice for reference measurement validation. The reason for this is that the reference measurement should use an accomplished localization strategy. ‘Accomplished’ in this context means a strategy which has been used by other groups with published success. Combining the knowledge of the feasibility of a given reference measurement with the sparse validation of a specific implementation results in sufficient dependability upon the reference measurement.
2.1 Terminology of underwater localization
The aim of underwater localization is to find the vehicle pose η = [x, y, z, φ, θ, ψ] in six-DOFs, consisting of the vehicle position η1 = [x,y,z] and its Euler orientation η2 = [φ, θ, ψ]. The earth-centred, earth-fixed (ECEF) frame {e} is used as the reference frame. A frame as shown in figure 1 is attached to the vehicle's origin and used as a body-fixed frame. The vehicle's position and its orientation are expressed in an ECEF frame, and its linear and angular velocities are expressed in a body-fixed frame. Each measurement of the pose is accompanied with a covariance, giving a measure of uncertainty. Ideally, the transformation of the world coordinate system into the geographic coordinate system is known. Since this is not an intrinsic necessity for the comparison of underwater localization techniques, and since not all approaches will yield this transformation, for the rest of this paper the geographic coordinate system is not used.
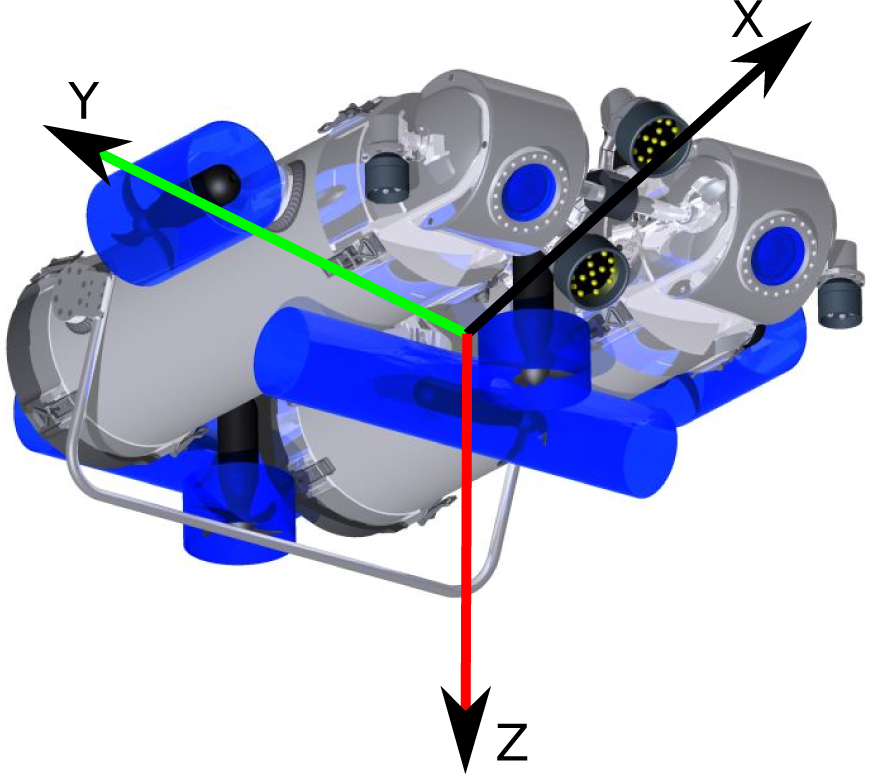
Vehicle's body-fixed frame coordinate system
Methods for underwater localization can be categorized in multiple ways - this paper will use the actor-based categorization. It differentiates between infrastructure-centric localization and vehicle-centric localization. Infrastructure-centric localization uses an external localization system, which has to be set up in the mission area prior to any further work. Examples of infrastructure localization techniques are beacon systems, like USBL, SBL and LBL (UltraShort/Short/Long - BaseLine), which use triangulation between a number of fixed stations and the vehicle for position measurement [4], [5]. The individual techniques differ mostly in complexity of set-up and accuracy. Vehicle-centric localization uses only the sensors built into the vehicle to be localized. These sensors can either interact with the environment (exteroceptive) or else only measure internal parameters (interoceptive). An example for a vehicle localization technique combining both types is ‘dead-reckoning’, using an IMU (inertial measurement unit) and a DVL (Doppler velocity log).
The criteria for comparing different localization techniques are numerous: absolute accuracy, long-term stability, update frequency, robustness (against noise, environmental conditions), computational complexity, impact on vehicle instrumentation, and versatility. All these criteria will be applied to both the GSRL as well as to the NLA (see section 6.1).
2.2 The gold-standard method for localization for underwater vehicles
This section describes the concept of the gold-standard method for localization (GSRL) available for underwater vehicles. It is a combination of infrastructure and vehicle localization systems on the basis of dead-reckoning and acoustic sensors. It uses the input from a number of sensors: IMU, DVL, DPS (digital pressure sensor) and LBL. All sensor data are fused by a KF (Kalman filter), yielding a six-DOF localization measurement η. The different sensors all provide specific information for this purpose:
IMU: The IMU provides the vehicle orientation η2 and translational acceleration
DVL: The DVL provides the vehicle speed over ground
DPS: The DPS provides the distance to the surface, i.e., the depth of the vehicle z. These data are medium frequency (≈10) and long-term stable.
LBL: The LBL provides the vehicle position η1 data relative to one of the localization beacons. These data are low frequency (≈1) and low accuracy.
The quality of the localization is mostly dependent on the data quality of the IMU, the DVL and the DPS, while the LBL sensor is used to ensure long-term stability and cancel drift. In particular, IMU sensors are available in different qualities, sizes and price ranges. For example, the JHUROV vehicle of Johns Hopkins University uses an IMU developed by the US Navy, which is not available for non-military applications but has very high levels of accuracy [6].
Most implementations of this localization technique are vehicle-specific: there are no readily available open-source versions which can be used out of the box. This results in the repeated implementation of algorithms and greatly reduces the comparability of individual vehicles' performance.
Examples of the implementation of GSRL-flavours for underwater vehicles include the implementation on the DEPTHX-Vehicle [7], where DPS, IMU and DVL sensors are used. The particular implementation of the vehicle's sensors yields a divergence rate of 0.5% of distance travelled, although the method for determining this quantity is not given in their published work. The non-stabilized long-term error of 0.5% fits with other publications, where similar accuracies are reported (e.g., [8]). A GSRL implementation including external references for long-term stability is described in [9] [10]. They use a high-quality DVL with 1.2 combined with a 12 LBL system to achieve a standard deviation of only 9 with an update rate of 4. The LBL provides position measurements every six seconds. This shows the effectiveness of the combination of a high-speed local sensor with a low-speed global sensor.
The implementation of the GSRL used for the work described in this paper follows a modular approach and is publicly available as open-source software using the ROCK-Toolkit [11] as middleware. The idea behind this is to enable easy adaptation to other vehicles or sensor configurations. A good example is the HROV-Project 2 , in which parts of this implementation are used, even though the instrumentation of the HROV-vehicle differs considerably.
3. Methodology
The steps to successfully validate a new localization algorithm are:
Selection and implementation of a GSRL suitable for the vehicle.
Sparse validation of the GSRL implementation.
Implementation of a NLA.
Recording of the validation data.
Computation of the resulting characteristics for the NLA.
The most important aspect is the computation of the characteristics of the NLA. The following quantities will be used for this purpose throughout the rest of this work:
The vehicle pose:
in six-DOFs, consisting of the vehicle position:

and its Euler orientation:

as described in section 2.1. The position at a given point in time is denoted by the use of η1(i) where i = 0 is the initial position and i = n is the final position of an experiment. The position difference between a frame and its predecessor is defined as:
The distance travelled as measured by the algorithm can then be defined as:

The deviation d is defined as:

which denotes the distance between the estimates of the GSRL and the NLA at the end of a test run.
A similar quantity is the sparse deviation ds, which is defined as:

and which denotes the distance between the position estimates of the start and end of a test run.
The in-track deviation is defined as:

with the mean μ:

and the standard deviation σ:

which can be used to judge the error characteristics between two estimated trajectories.
The relative deviation dr:

and the sparse relative deviation dr,s:

are used for way-normalized comparisons.
It is important to note that all the quantities comparing the GSRL and the NLA have to be corrected for the GSRL uncertainty. This is necessary, since the GSRL measurement has an uncertainty as well, which is non-negligible and thus has to be taken into account. This has the disadvantage that a NLA cannot be better than the GSRL. The correction for the deviation is simply done by adding the GSRL's deviation, resulting in the corrected deviation dc:

This yields an upper bound for the NLA's deviation. It is important to note that the tested algorithm (NLA) might perform significantly better than the reference algorithm (GSRL) without this being visible using this quantity. Nevertheless, using this more conservative value, overconfidence regarding a new algorithm can be prevented.
4. The test vehicle and its capabilities
The vehicle used for all the experiments in this paper is the autonomous underwater vehicle (AUV) (see figure 2). is a small vehicle developed by the DFKI-RIC during the -project [12]. Despite its small dimensions (100 · 85 · 20) and weight (75), it is equipped with state-of-the-art sensor systems (for details, see table 1) and has high levels of manoeuvrability and versatility. Since it was designed as a hovering AUV, it does not need to move forward to maintain its depth - as most AUVs need to do - and can move sideways as well. This is especially useful for the testing of algorithms, since the forward speed can be selected freely (up to 1), and external side forces (e.g., currents) can be compensated for. The AUV's endurance is about 8, with the ability to fast-charge in two hours. Its maximum operating depth is 150. Sensor processing is done by its two powerful embedded-PCs, both of which employ multi-core CPUs. A special feature of the PC used for computer-vision is its graphics processing unit (GPU), which can be used to significantly speed-up parallelizable algorithms [13]. has been in operation for the past three years, and has proven its usability and capability as a test platform for the algorithms' development and verification [14].
List of sensors/instruments of the AUV

For 360° scan
Relative to receiver

The AUV
4.1 Vehicle control
The AUV is controlled by its two on-board PCs. The control system uses the ROCK framework [11] as middleware and for communication purposes, providing open-source drivers and modules for assorted sensors and actuators, as well as a number of controllers and management modules. The five thrusters are controlled by a motor command module, which gets its data from an AUV-control module. The latter implements the key functionality for the AUV, including depth control, distance-to-ground control, station-keeping, and heading and speed control. On top of this, a trajectory-follower module allows the vehicle to follow pre-defined trajectories. The trajectory data is provided by way points which are interpolated using B-splines to provide a constant curvature. The trajectory follower needs a vehicle position as input, which is usually the output of the GSRL for the validation experiments.
4.2 GSRL implementation on the test vehicle
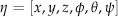
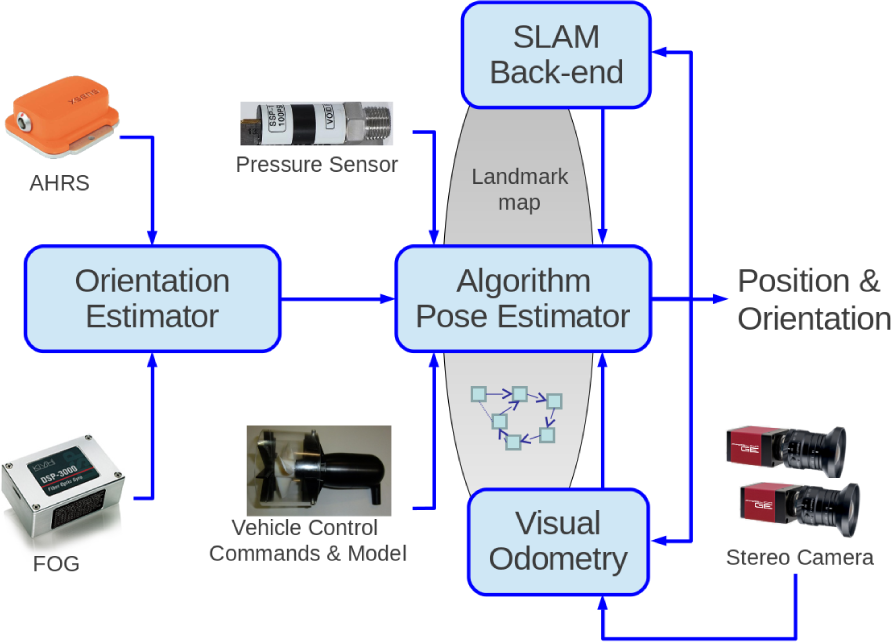
The GSRL implementation on the AUV is shown in figure 3. At its core is a Kalman filter (called a ‘pose estimator’), fusing the sensor data from all available sensor systems. In order to keep this Kalman filter simple, the orientation estimation is computed separately, fusing the information of a single-axis fibre optic gyroscope (FOG) for yaw with the data from an attitude heading reference system (AHRS). Due to cost restrictions, a navigation-grade IMU was not feasible for the vehicle. Since strong magnetic disturbances were expected during operation (especially in the metal-walled test tank), the magnetometers of the AHRS are only used once during initialization, resulting in the yaw portion of the orientation being measured only by the integration of the FOG data during operation. This results in the following inputs: orientation η2 from the orientation estimator, depth z from the DPS, vehicle speeds
Flowchart of the GSRL implementation on the AUV
Due to an error in the LBL module, no valid data were recorded during the field tests described in section 5. This was only discovered in post-processing, after the trials. This means that, for the datasets used in this work, only un-stabilized results could be computed. While this needs to be remedied in the long run, it does not impact the main agenda of this work: to show the validation process. Consequently, the loop-closing capability of the NLA was deactivated as well, in order to have two comparable localization algorithms.
4.3 NLA implementation on the test vehicle
The AUV was built with a new localization algorithms in mind (for details, see [15]). This algorithm is supposed to replace the DVL and LBL sensors of the GSRL in the long run with computer vision-based measurements using a stereo camera system observing the ground beneath the vehicle (ground-relative navigation). This is accomplished by the utilization of a simultaneous localization and mapping (SLAM) approach. The flowchart for this implementation (called ‘SURE-SLAM’, stereo underwater realtime exploration-SLAM) is shown in figure 4. Note that, besides the LBL and DVL, all the other components are used from the GSRL in this case, which is not a necessity for the validation scheme. Further, the visual system can be operated completely by itself, with the disadvantage of reduced stability. The localization algorithm has three major parts: visual odometry, SLAM and a pose estimator. The visual odometry computes the motion between two camera image pairs (from the stereo camera system) by the extraction and matching of SURF-features [16]. The resulting information is of similar quality to the DVL measurements in the GSRL, since only changes in motion are computed. The SLAM component keeps track of a global feature map and the vehicle's poses in the form of a graph. It recognizes when the vehicle passes over a patch of ground it has already passed over (loop-closing). As soon as such a loop-closing occurs, it is integrated into the graph as an additional link, reducing the overall uncertainty (graph-based SLAM [17]). In this way, it can greatly reduce drift-induced deviation and increase long-term stability, similar to a LBL. The pose estimator for the SURE-SLAM is similar to the GSRL version, only with different parameters and input ports. This algorithm will be used in section 5 to show the application of the validation scheme.
Flowchart of the NLA implementation (called ‘SURE-SLAM’) on the AUV
5. Experimental data of real-world trials
For this section, the SURE-SLAM algorithm described in section 4.3 will be used as an exemplar NLA for the validation process, using the implementation of the GSRL described in section 4.2.
5.1 Sparse validation of the GSRL implementation
As stated in section 2, since this GSRL implementation is supposed to be the reference localization measurement, it could only be sparsely validated. To accomplish this, two experiments were conducted: first the trajectory-follower module was used to drive a rectangular trajectory in a 5 · 4 test tank, starting at a defined position at the surface (this was ensured by manually holding the vehicle to the wall). The vehicle speed was selected as 0.1. In order to increase the length of the driven trajectory, multiple circuits were driven. After 10 trajectories were completed, the vehicle was manually returned to the defined starting position. The deviation of the start-to-end position was interpreted as a deviation over the driven distance. The results were a deviation of ds = 0.76 after a travelled distance of |η|= 106.2, resulting in a relative deviation of dr,s = 0.71%. The resulting x/y positions as well as the x/y/z positions are shown in figures 5 and 6. It needs to be noted that the trajectory follower used in this experiment was complemented by an obstacle-avoidance module, which used a scanning sonar to prevent the vehicle from colliding with obstacles. This resulted in a slight offset of the trajectories, as seen in figure 5, since occasionally the tank walls were considered obstacles.

Position estimation by the GSRL for the sparse indoors validation dataset. Ten consecutive rectangles (2.5 · 2.5) with manually enforced start and end positions. Due to the confined space of the test tank, obstacle-avoidance behaviour was active at the same time, accounting for the offset of the squares (because of detected tank walls).

X, Y and Z components of the position estimation of the GSRL during the sparse indoors validation dataset
The second experiment was conducted in a lake with a similar setup, but with longer trajectories under more realistic circumstances. Again, the vehicle's start and end position were fixed (holding it against the pier), but this time it performed one single large rectangle of 100 · 100. The vehicle speed was selected as 0.3. The result was a deviation of ds = 2.20 after a travelled distance of |η|= 542.2, resulting in a relative deviation of dr,s = 0.41 %. The resulting trajectory and its manual fixing positions are shown in figure 7.
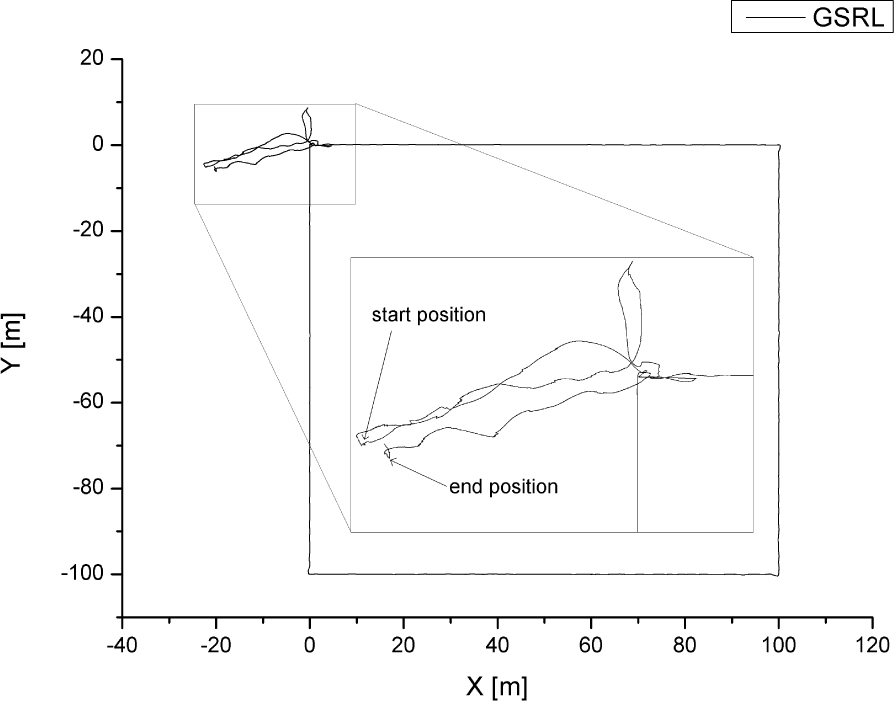
Position estimation by the GSRL for the sparse outdoors validation dataset. One large rectangle (100 · 100) with manually enforced start and end positions.
The fact that the second experiment resulted in a better deviation despite being executed under more realistic conditions is explained by the smaller number of corners in the driven trajectory. Since the vehicle stops at each corner before it executes the turn, it experiences more pitch and roll. This increased the accumulated error of the DVL and thus resulting in worse results.
In conclusion, the upper bound for the GSRL relative deviation value is dr(GSRL)= 0.75%. This value lies within the expected range for the DVL/AHRS combination as described above, and will be used for the remainder of this work.
It should be noted that the GSRL deviation is a composite value, since it combines position deviation and rotational deviation. The drift of the orientation estimation and the drift of the accumulated speed-over-ground measurements by the DVL both contribute to the final deviation. In order to estimate how much of the drift stems from the orientation drift, the performance of the orientation estimator was evaluated separately. Using a long-term test where the vehicle was sitting outside of the water, on a table, the angular random walk was recorded using the Allen variance. A value of 3° was measured. Since this measurement was taken with no roll or pitch variation (which increases the error, since only a single-axis FOG was used), the upper bound for the random walk error in the orientation estimator was selected as 6°.
5.2 Recording of the validation data
Two datasets were recorded as validation data: the first in a test tank, the second in a lake. This follows the idea of real-world data, since the NLA is supposed to be used both indoors and outdoors. Since SURE-SLAM (which is used as the NLA in this case) is a visual algorithm, the various environmental conditions arising during the experiments had to be taken into account.
The indoors dataset will be used to show the correctness of this validation approach, since two measurements can be used here: the normal comparison measurement using the GSRL, as well as the manual reference measurement similar to section 5.1. The indoors dataset was recorded in clear water conditions, without any special lighting conditions, with a distance to the ground of 1.5 and an average speed of 0.1. Again, 10 rectangular trajectories were driven with a 2.5 · 2.5 size, and the start and stop positions were manually defined. The resulting trajectory as estimated by the NLA is shown in figure 8. The sparse measurement resulted in a deviation of ds = 0.79, after a travelled distance of |η| = 103.9. A relative deviation of dr,s = 0.76% was calculated. These values are very close to their GSRL counterparts, thus showing that the NLA is working as designed.

Trajectories as estimated by the NLA for the indoors validation dataset. Similar to figure 5, the offsets in the squares are artefacts of the obstacle avoidance module.
Comparing the estimated trajectories of the NLA and the GSRL, the position difference at the end of the trajectory was d = 0.23, resulting in a relative deviation of dr = 0.22%. The standard deviation of the error between the two estimated trajectories was σ = 0.08. The fact that these values are significantly lower than in the sparse case underlines the necessity of considering the deviation of the reference localization when computing such quantities.
The outdoors dataset was recorded in open water (the Baltic Sea, 2012), with moderately turbid water (≈3 FTU), sunny outdoors lighting conditions, a distance to the ground of 2.5 and an average speed of 0.3. There was a steady current of about 0.4, and about 0.5 of waves. Five 8 · 8 rectangular trajectories were driven. The resulting trajectories as estimated by the GSRL and the NLA are shown in figure 9. The position difference at the end of the trajectory was d = 0.71, with a driven distance of |η| = 160, resulting in a relative deviation of dr = 0.45%. The standard deviation of the error between the two estimated trajectories was σ = 0.15.
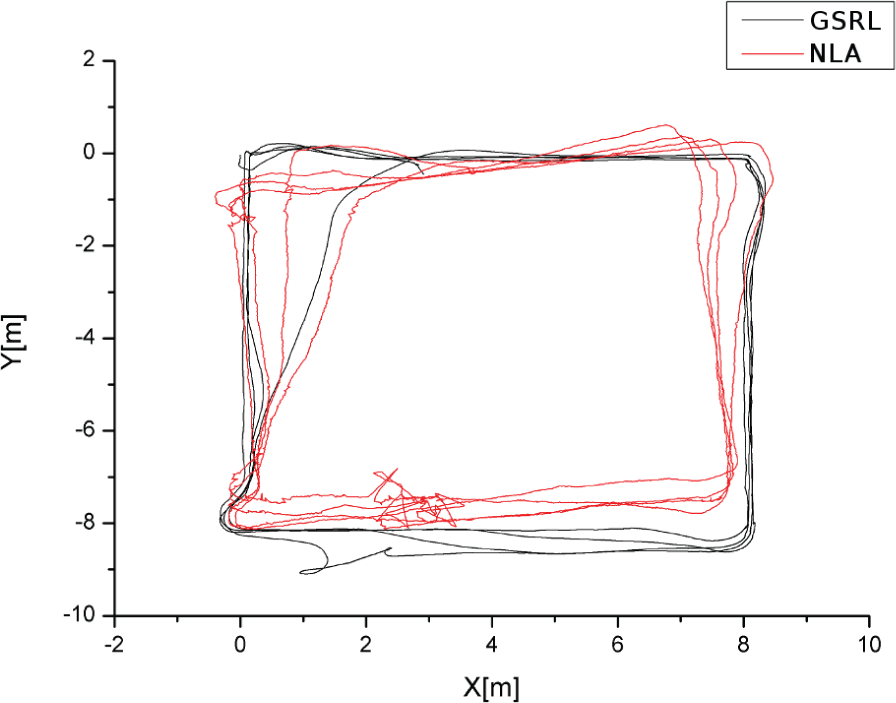
Trajectories as estimated by the GSRL and the NLA for the outdoors validation dataset
5.3 Computation of the resulting characteristics for the NLA
The resulting corrected deviations for the NLA are dc = 1.03 for the indoors dataset and dc = 1.91 for the outdoors dataset after a travelled distance of |η| = 106 and |η| = 160, respectively, with corrected, relative deviations of dc,r = 0.97% and dc,r = 1.2%. These results lie within the expected range considering that no external reference was used in the measurements. They represent the upper bounds for the expected error of the NLA as validated with the GSRL.
5.4 Description of the failure cases
There are a number of circumstances where the described visual SLAM-based NLA fails. It is important to keep the operational conditions within parameters if the visual SLAM-based approach is to be used as a primary localization and navigation solution:
Distance to ground: It is a necessity for the visual system to yield usable results that the ground be visible and within the triangulation range of the stereo camera system. The optimal operation conditions are within 2–5 stand-off distance to the ground, with operation still possible between 1.2 and 7.5. Further reduced stand-off distance results in too little stereo overlap, while greater distance reduces depth resolution, both resulting in poor localization results or even drop outs.
Turbidity: Water turbidity acts as an image blurring agent and results in the reduced performance of the feature extractor. The system has been tested at a stand off distance of 2 with a turbidity range of 0–10 FTU. A turbidity greater than 7 FTU resulted in decreased performance or drop out.
Image overlap: The algorithm requires an image overlap of at least 35%.
Motion blur: Since motion blur greatly reduces the matching effectiveness of the feature detector, it has to be avoided by the selection of appropriate illumination, exposure times and gain settings for the cameras.
Repetitive structure: Overly repetitive structures lead to the failure of the loop-closing capability of the algorithm. The two test cases for this were a swimming pool floor (tiled in two colours) and the net of a fish-farm in Norway. Both resulted in good results for local navigation, but loop-closing was limited to areas with additional structure (e.g., numbers on the ground (pool) or anchor lines (net)).
Non-Lambertian surfaces: The algorithm operates with the expectation of mainly diffusely reflecting surfaces (Lambertian scatterers). Specular reflecting surfaces, such as ice, change in appearance independently of their relief (i.e, their height towards the camera), which results in the poor performance of feature matching.
Overly dynamic ground: The algorithm will compute the motion relative to the motion of the ground. If the ground is covered by dynamic structures (such as sea grass) which move independently of the vehicle, the algorithm will report more significant motion, i.e., if more than 50% of the detected feature points are on moving sea grass, the motion relative to the sea grass will be computed.
6. Conclusion
This paper described the validation process of an algorithms for underwater localization. After showing the necessity of such a process, it was described in detail. A complete example of application is given using an acoustically stabilized dead-reckoning algorithm as a gold-standard localization algorithm and a visual SLAM approach as a new localization algorithm. The datasets were recorded on a real vehicle in both indoor and outdoor environments. While only the upper bounds of the errors can be estimated with this approach, it could be shown that this practice is necessary to prevent overconfidence in new algorithms.
6.1 Comparison between the GSRL and the NLA
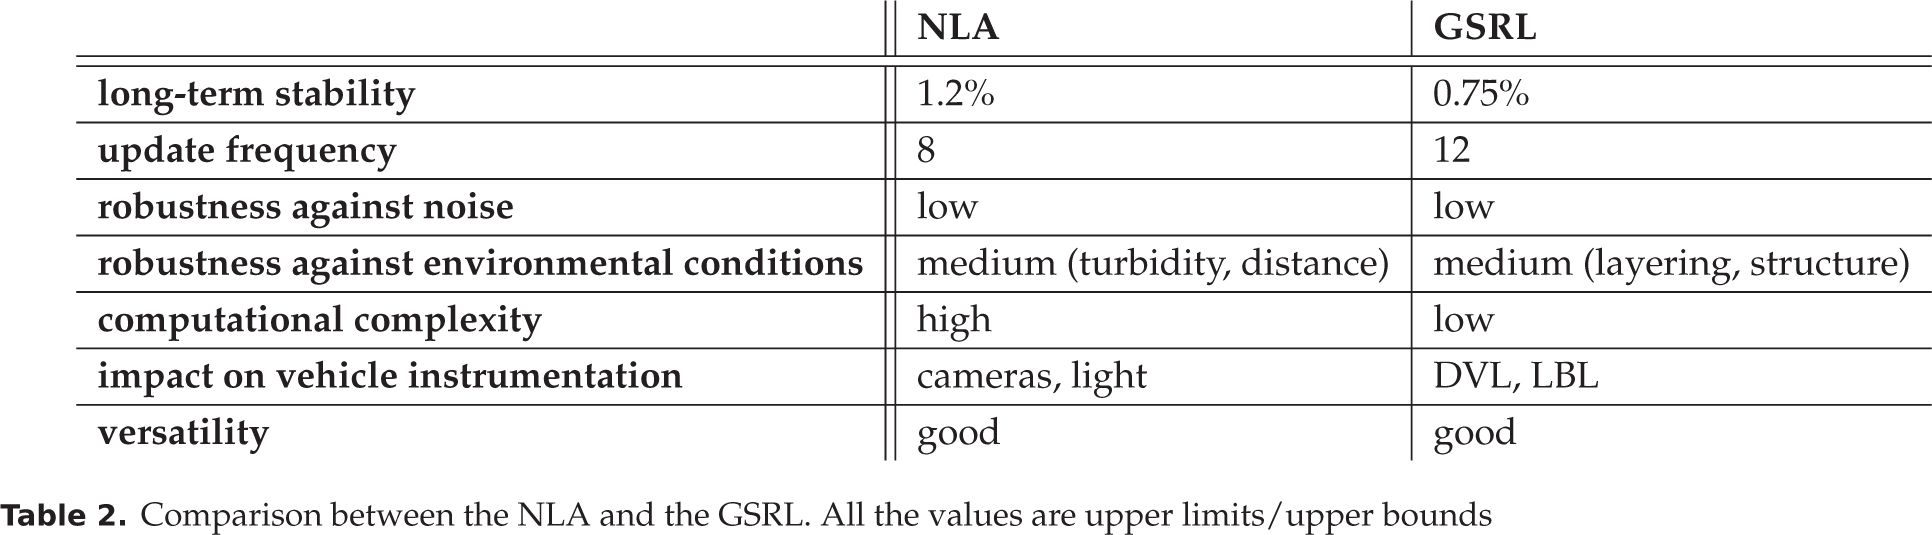
The NLA described in this paper (SURE-SLAM) performed well (see table 2). While its long-term stability is lower than of the GSRL, it is only slightly lower. The same can be said for its update frequency, which should be readily improvable with advances in the computation power of embedded systems. Most important is the robustness against environmental conditions. Here, their strengths and weaknesses seem to be highly disjunct, presenting the opportunity to combine both methods into an even better system.
Comparison between the NLA and the GSRL. All the values are upper limits/upper bounds
6.2 Future work
A logical next step in this work is the recording of data with an external reference system (LBL) in order to compare the results of stabilized algorithms and the applicability of this approach for long-term measurements. This will be done as soon as funding and a suitable testing environment can be found.
The relatively small number of experiments conducted so far will be extended in the future. While, with the experiments at hand, the feasibility of the approach could be conclusively shown, not all possible environmental conditions and potential problems could be covered. An additional limitation so far has been the size of the available test pools for the validation measurements. In the foreseeable future, access to a large 20 · 15 test basin will be possible, where larger-scale experiments will be possible under controlled environmental conditions.
Another aim would be to establish a more precise algorithm as the GSRL. This might not be necessary if the stabilized version performs well enough. Tests with visual absolute reference measurement methods, as described in section 2, might also be possible in the future.
Finally, the combination of the GSRL and the SURE-SLAM described in this paper seems very interesting and would yield a system similar to the VAN approach developed by [18], with the notable difference that SURE-SLAM is a completely capable localization algorithm on its own (as opposed to the vision system in VAN).
Footnotes
7. Acknowledgements
The authors would like to thank Jens Hilljegerdes for his great work in designing and constructing the AUV, as well as Marius Wirtz for his invaluable help in integrating and maintaining the vehicle.
This work is part of the -project, funded by the German Federal Ministry of Economics and Technology (BMWi) according to a resolution of the German Bundestag, grant no. 03SX290.