
Abstract
We present a new method for obstacle and pedestrian detection with lower computation complexity and higher detection performance on a small target. By calculating stereo disparity according to the road parameters, our system efficiently detects objects above the ground. Experiments on over 10,000 images captured in urban areas demonstrate our method's effectiveness.
We also propose a multi-scale compatible pedestrian detector. Detection speed is improved by avoiding size adjustment of input. Experiments on three public pedestrian databases and our HENU database show that our detector achieves better results than the state-of-the-art detection quality at equal speed, especially on pedestrian target with small size.
Introduction
Over the last decade, ADASs [1] (Advanced Driver Assistance Systems) have become a hot research topic attracting increasing attention. Such systems are designed to reduce the incidence of traffic accidents by providing critical information for drivers. Typical ADASs are Adaptive Cruise Control or Lane Departure Warning, and one of the most complex ADASs is pedestrian detection which plays a critical role in human protection. Compared to commonly used laser radar and infrared cameras, visible cameras have the unique advantage with regard to hardware costs. In this paper, we focus on two aspects: computation complexity and detection performance on small human targets.
Pedestrian detection in real road conditions is a very challenging task because of changes in human appearance and background complexity. Stereo information, such as stixel in [2, 3], is used to locate obstacles above ground. Pedestrian features, such as HOG (Histograms of Oriented Gradients) [4], HW (Haar Wavelets) [5] and EOH (Edge Orientation Histograms) [6], are used to train a pedestrian detector. Detection methods combined with stereo information and graphic features usually achieve better performance.
This paper is organized as follows: Section 2 discusses the related works on pedestrian detection. Section 3 examines the main algorithm used in this paper, SPM (Surface Parallax Map)[7] initialization, occlusion image generation and SPM compensation algorithm for real-time. Section 4 describes the pedestrian detection in ROI. Section 5 outlines the experiments details. Finally, the conclusion of our approach is made in Section 6.
Related work
In recent works, obstacle and pedestrian detection has usually been based on the extraction of geometric contexts from stereo images. Badino[2] proposed the “stixel” concept, which uses adjacent rectangular sticks of a certain width and height to represent vertical objects in front of vehicles (which can be considered as obstacles). To do this, stereo disparities are used to build a stochastic occupancy grid, then stixel is extracted after the free space and the height for every column are computed. Stixel is reviewed by Benenson [3] without the use of depth map computation. Cost volumes are computed pixel-wise instead of using depth map, and the disparity (and thus the depth) of each stixel is estimated using 2D dynamic programming over vertical projection of the cost volume.
Regions containing pedestrians can be considered as ROIs (Region Of Interest). ROI extraction can avoid exhaustive searching in candidate windows. A robust classifier employing four directional features is propose in [8], and temporal continuity of classification score is considered to improve the temporal change of appearance. Zhao et al. [9] segment the image into sub-images that satisfy pedestrian size and shape constrains, using intensity gradients of the candidate sub-images as input to a trained neural network for pedestrian recognition. Gavrila et al. [10] present a multi-module pedestrian detection system: stereo-based ROI generation, shape-based detection, texture-based classification and stereo-based verification. Franke [11] presents a correlation-based stereo vision approach which uses real time stereo analysis based on local features and correlation; a neural network classification scheme using spatial receptive fields is used to recognize objects in urban traffic. David et al. [1] present a pedestrian detection system including three independent modules, and this uses an adaptive image sampling method to distribute pedestrian-sized ROIs along the surface, using HW and EOH to train an AdaBoost classifier. 3D data and window grouping are both used to verify the positive ROIs and refine the final detections. Nedevschi et al. [12] present a stereovision-based obstacle detection system that reconstructs and works on 3D points corresponding to the object edges. Those points are grouped into objects according to distance. Nedevschi [13] proposed a vehicle environment perception system by reconstructing 3D points corresponding to the edge features and representing the lane as a 3D surface to separate obstacle from road.
In this paper, in order to improve detection speed, we adopt a new stereo matching algorithm which has lower computation complexity and is sensitive to obstacles. By computing the difference of an object's projection on the road, the system is able to detect obstacles (including pedestrians) above the ground. Because of the low computation complexity of the algorithm and the fact that the surface parallax map can be precalculated, time is significantly reduced. We also propose a multi-scale compatible pedestrian detector. Once the classifier has been trained, the features of a small target can be used as classifier input directly without changing the image size. Experiments show that our detector provides state-of-the-art detection quality while achieving higher accuracy on the small target. With regard to the detection result in figure 1, the travelable area and obstacles are perfectly divided. The red boxes indicate the current area as obstacles and the upper area is impassable, the yellow boxes are the nearest pedestrian detected by our classifier, the green area means travelable.

Detection results of video sequence in database HENU. Red boxes indicate the nearest obstacle detected in front of the vehicle, yellow boxes are the nearest pedestrian detected, the green area means travelable. (a) Result from sequence 50. (b) Result from sequence 66.
Obstacle detection and ROI generation usually extract stereo information from a scene by computing a depth map or stixel. Both of them need to run matching algorithms pixel by pixel. Although new matching algorithms have been proposed, matching complexity is inherited. We employ a variant of the disparity map which restricts pixel matching in the specific plane (road surface). This variant is the so-called Surface Parallax Map (SPM). Parallax indicates the different position of the object in left-right images. If we consider that pedestrians and other above-ground objects are located between the cameras and the road plane, part of the road is occluded. By analysing the occlusion pattern, locations of object above-ground can be detected [7]. The main procedure of our method is: first, calibrate the road surface and use the road parameters to initialize the SPM; then transform the parallaxes of the objects into the occlusion image by using improved equation (1); finally, obstacles and ROIs are extracted by analogizing the occlusion area.
Surface Parallax Map
The SPM stores the stereo disparity of the road surface. An object above-ground can be detected by considering the parallax difference in the SPM. Our method can detect obstacles within 75 metres of the front of the vehicle and at a height no less than 5 cm. As shown in figure 1, even speed humps can be detected while using a low-resolution camera. We also use a Ground Control Point (GCP) [14] to improve matching accuracy as described in [7]. GCPs are used to assemble the pixel disparity of the ground surface into the SPM. GCPs can be extracted by marking the roadside in images manually or by placing signs at real roadside. We chose the former which is more convenient and does not affect the accuracy during testing. The SPM schematic is shown in figure 2.

Surface parallax map initialization. Sketch of GCPs and control lines.
As shown in figure 2, centreline O is perpendicular to the baseline of the camera. The markers are the GCPs on the road surface - the control lines pass the GCPs respectively. All the control lines are parallel to the road surface. The control lines captured by the left camera are blue and the yellow lines belong to the right, d indicates the horizontal disparity at the current position. When cameras are calibrating, the two optical axes of the cameras must be restricted in the same plane in order to avoid vertical disparity [7]. Considering the distortion of the cameras, the disparities in the same y-coordinate are not identical. The algorithm in [7] uses means to approximate the disparity. In this paper, we adopt discrete values to improve the SPM algorithm. The parallax disparity d(x, y) is modified as described in equation (1):

where (x, y) is the coordinate of the current position, the origin is on the upper left, Δy indicates the y-coordinate of the vanish line in the image, m is the number of control lines, n is the number of GCPs on each control line, x i,j is the x-coordinate of the GCP, i = 1, 2, … n, j = 1, 2, … m, y i is the y-coordinate of the ith GCP along a control line, d(i,j) is the disparity of the ith GCP on the jth control line.
By giving d(x,y) we use cost function to generate an occlusion image from the new input. We consider SSD (Sum-of-Squared Differences) and SAD (Sum-of-Absolute Differences) in [11], ZSAD (Zero-mean Sum of Absolute Differences), NCC (Normalized Cross Correlation) and ZNCC (Zero-mean Normalized Cross Correlation) in [15]. These cost functions were evaluated in previous works [7], and ZSAD has been chosen for its comprehensive performance on calculation speed and disparity accuracy. As described in equation (2), where I L and I R are pixel values at coordinate (x, y) in the left and right images, Ω is the neighbourhood of the current pixel, using a horizontally placed rectangular, Ī(x, y) expresses mean intensity of neighbourhood Ω.


As shown in figure. 5, by using the SPM, input images can be transformed into occlusion images in which the above-ground objects have brighter colours.
An SPM is more efficient than other depth map algorithms in two respects. First, an SPM can satisfy real-time requirements without specific hardware accelerating (such as GPU and FPGA programming). Second, pixel-wise matching in an SPM uses 1 to 1 instead of 1 to N, so the matching cost is decreased from O(WHN) to O(WH), where W is the width of the image, H is height, N is the local neighbourhood. Programming in Matlab, running on a laptop with a four core CPU and 4G RAM, the processing speed of the occlusion image generation algorithm base on an SPM is 11 images per second with resolution 640×480. In contrast, the speed of the disparity image using semi-global matching is two images per second. The detection speed in our algorithm for obstacles is seven images/s and for pedestrians it is six images/s.
Our SPM algorithm is established on the basis of the assumption that the driving area in front of the vehicle is flat. However, this assumption is not always satisfied in the real world. As described in [7], the SPM algorithm needs to be compensated for special circumstances. As shown in figure 3, Z indicates the driving direction of the car, X indicates the horizontal and Y indicates the vertical. As the road surface changes, the driving direction will change around three axes correspondingly. Because the cameras are fixed to the vehicle, a camera rotating around the Y and Z axes does not affect the SPM, but rotating around the X axis will affect the results of equation (1). We adopt a real-time road surface fitting algorithm to compensate SPM output by calculating the angle between the road and the horizontal.

Road surface fitting by matching edge feature. (a) Original image and edge image detected by using the Canny operator. (b) Surface points after stereo match, every unit denotes 0.1667 metre.
The stereovision-based road fitting technique is divided into three categories[7]. The first category extracts the road surface information by detecting the lane and roadside[12] [13] [16]. The second category detects the road feature points, calculates the 3D coordinates of these points by using a stereovision technique, and fits the road surface on those points [1][17]. The third category applies the SFM (Structure From Motion)-based technique to fit the road plane [18]. The limitation of such methods is that only passed areas can be rebuilt. Our method first matches edge feature points in images to obtain the points of the road area, then projects those points to the YOZ plane and analyses the angle between the road and the horizontal, using equation (4) to correct SPM output. Since the upper part of the image is usually occupied by meaningless background such as trees and buildings, our matching algorithm only considers the lower half of images, which is the road region.
We use a Canny operator to detect the horizontal and vertical edge because the the Canny algorithm can generate continuous edges which are conducive to matching road feature points. The parameters are described as follows: using σ = 1 as the standard deviation of the Gaussian filter in the Canny method; the high value for thresh T H is relative to the highest value of the gradient magnitude of the image; the low thresh T L is 0.4 * T H .
The edges detected are shown in figure 3(a). The matching algorithm of the feature points adopts the cost function used to calculate the occlusion image in Section 3.1. In figure 3(b), the scale unit is 0.1667 metre. The 3D coordinates of the feature points are projected to the YOZ plane, β expresses the angle between the road and the horizontal, the line with minimum β and passing maximum points is selected as the road surface projection.
After correcting the equation of parallax d(x,y) is modified as:

where s is the compensate factor, H is the height from the camera to the road surface, L i is the distance from each GCP to the camera centre, L is the road surface distance from the current target to the camera, α is the angle between the horizontal and the sight line, β is the angle between the road and the horizontal which is positive uphill and negative downhill.


During the experiments we found that the road surface changing does not affect the detection distance of obstacles, but compensate algorithm can reduce the horizontal offset of the target in the occlusion images.
For pedestrian detection, exhaustive searching of the entire image leads to huge computational cost. But with ROI, detecting can be concentrated on the most likely area. In our approach, cameras are calibrated using Zhang's algorithm [19], the SPM is used to generate ROIs, and triangulation is used to calculate the size and position of the detecting window in the ROI. Many human features are proposed to classify detecting windows as pedestrian or non-pedestrian. Gavrila proposes a shape-based detector and a texture-based classifier in the literature [10]. David uses a Real AdaBoost classifier combined with Haar wavelets and edge orientation histograms to locate pedestrians. A detection algorithm adopting the HOG features can effectively classify pedestrians [4]. A variant of HOG has been used to train the SVM classifier which is declared to achieve a good detection result [20]. But the shortcoming of HOG is that it is sensitive to the size of the input image. Therefore, the testing sample must be adjusted to the size of the training sample. Otherwise classifiers should be trained at different scales. The Haar features are not sensitive to different scales because it extracts regional features. A classifier trained by Adaboost can remain discriminative at different scales. But discrimination of Haar features on pedestrians is weaker than for HOG. Benenson [21] use the FPDW (Fastest Pedestrian Detector in the West) which is proposed by [22] to train classifier at N/k scales. N are all the scales that need to be checked and k represents the number of the scale which can be approximated by analysing others. This method improves detection efficiency by reducing the number of classifiers trained on different scales.
In order to improve detection speed, we present a new pedestrian detector compatible with different sizes of input image. The detector adopts a feature called BHGD (Boosted Histogram of Gradient Direction). Extraction of BHGD includes two steps. First, detection windows are divided into blocks, histograms of gradient are calculated for each block. Using histogram feature to train SVM classifiers for each block and evaluate the performance of these classifiers on new data. Second, we build a composite classifier by using the Adaboost algorithm to choose discriminative blocks. This boost step is unique and does not exist in HOG. We also present compensation algorithms to improve the performance of the composite classifier on small targets. BHGD inherited high discriminative from HOG features, meanwhile it introduces compatibility on different scales of pedestrians.
BHGD Feature Extraction
As mentioned, BHGD features need two steps to build a pedestrian detector. First, the histogram of gradient direction is calculated for each block in detecting windows. The block splitting strategy is similar to HOG. Considering the size of the training image to be 160×96 or smaller, we define block as a square in which the side length is 2 n (n = 2, 3, 4, 5, 6). A smaller block will drastically reduce performance. We consider both an overlapping and a non-overlapping block arrangement. For each block, we calculate its histogram of edge gradient direction. Without considering the negative angle, we divide 180 degrees into nine bins in which edge gradients are accumulated. Histograms as feature vectors are used to train the SVM classifier (here we employ libsvm). The discrimination of each block's classifier is evaluated on the new training data. Second, we set these SVM classifiers as weak classifiers and build the pedestrian detector by using Adaboost to select block's classifiers with high performance. The optimized parameters used during experiments are: 8×8 windows, which allows the blocks to overlap, 30 weak classifiers selected. The selected blocks are shown in figure 4, most of the blocks are located at the pedestrian area at size 8×8. We do experiments on MIT, INRIA, USC and HENU database (208 positive samples cropped from 69 video sequences captured in urban areas), MIT includes 924 positive samples, image size is 128×64. INRIA includes 3542 positive samples and 1218 negative, image size is 160×96. USC includes 1168 positive samples, image size is adjusted to 160×70. HENU includes 208 positive samples, image size is 160×86. Experiment details are described in Section 5.
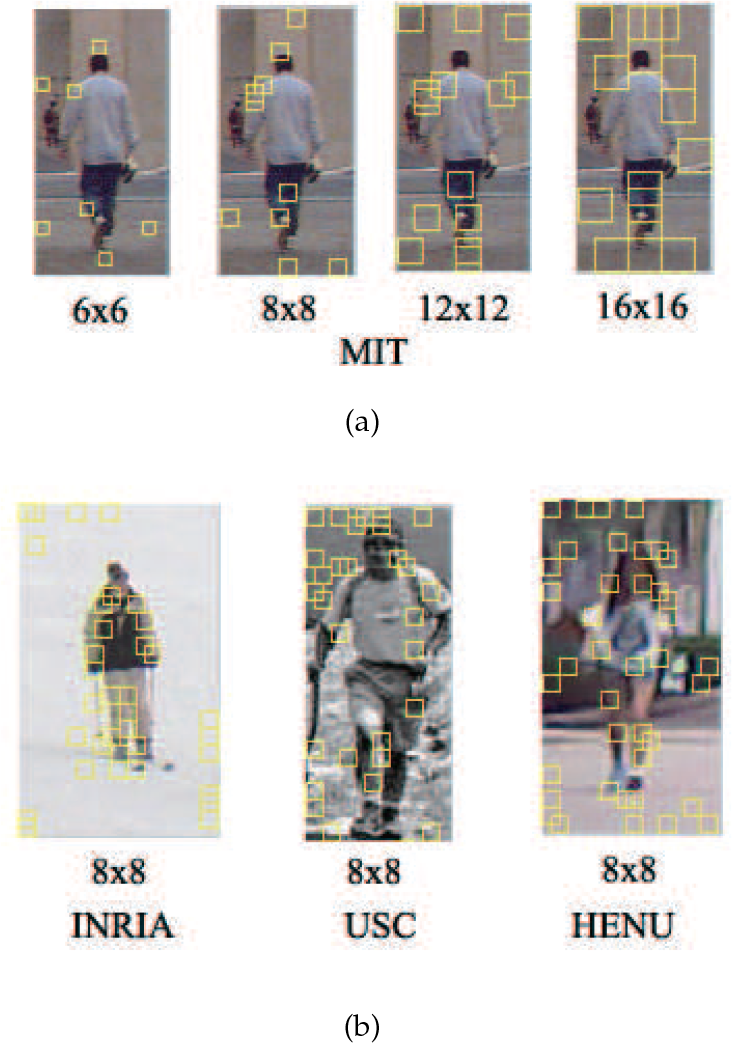
Blocks selected in BHGD classifier. (a) Different block size selected on MIT database, overlap allowed. (b)8×8 blocks on INRIA, USC and HENU, overlap allowed.
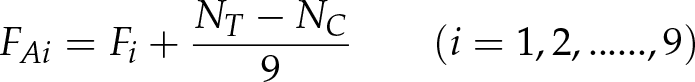
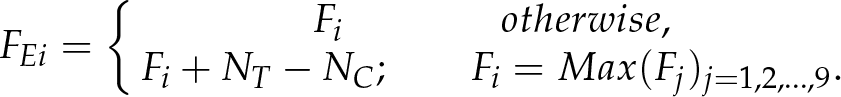
Pedestrian features are easily affected by scale change. When the size of the input image is different from the training image, detector performance drops dramatically. Because BHGD treats a block as the basic unit in the extracting and training phase, by adjusting the size of feature block according to input, our classifier can retain considerable discrimination. The experiment results proved this useful characteristic as seen in figure 7(b). When the size of input image zooms out at 80%, the classifier with BHGD can retain accuracy by 95.22% on a positive sample and 94.11% on negative ones. The Adaboost classifier with HW and EOH has decreased performance. Furthermore, analysing the features affected by scale change, the main difference is the number of edge gradients in each block. The smaller the size, the smaller the number. Considering this situation, we propose three compensation algorithms between multiple scales including AC (Average Compensation), WC (Weight Compensation) and EC (Enhanced Compensation) as shown in equation 8–10, where Fi is the feature of the block, FAi is the average compensated feature, FWi is the weight compensated feature, FEi is the enhanced compensated feature, NT is pixel number in the block on training step, NC is the pixel number in the block on the test step. For all three algorithms, we first calculate the difference of the pixel number between two scales. AC averagely assigns this value among nine bins of gradient direction. WC assigns this value according to the edge number in each bin. EC assigns this value to the bin which has the biggest edge number. The experiment results are shown in figure 7(f) 7(e) 7(d). Weight compensation is chosen in our method.

SPM Reliability under Different Road Conditions
For an onboard obstacle and pedestrian detection system, reliability is the most important property. We built a test database with six categories covering most common road conditions which include an asphalt road, a mud road, a lawn, a slope, and night and rainy conditions. The SPM algorithm demonstrates excellent performance on asphalt, mud and lawn. As seen in figure 5a, b, c, obstacle and people are highlighted in the occlusion images. The maximum effective distance of the obstacle is 80 m, for pedestrian it is 60 m, the minimum detectable height is 5 cm (e.g., speed humps). We also tested the SPM on the slope at 10%, −10%, 20% and −20%, seen in figure 5d. Although x of the object has obvious drift, the detectable distance was unchanged. For the night condition, insufficient illumination and the blind spots of the vehicle headlights made detection more difficult. The maximum distance of the obstacle is reduced to 30 m, as seen in figure 5e. For the rainy condition, the maximum distance does not change. The only problem is that because the angles of the water reflection are different in left-right images, reflections can be detected as the obstacle on the road surface, as shown in figure 5f. Since the SPM is based on disparity in the pixel match and image contrast can be significantly reduced during night, the detection distance is decreased by 60% and detection rate is decreased by 41.2%. For the rainy day the detection rate is decreased by 3.5%. Obstacle and pedestrian detection experiments were conducted on over 10,000 images of 69 video sequences captured in urban areas. Table 1 shows the statistical average detection distances and rates of 100 images randomly selected from the detection results. Figure 6 shows the average detection rate of pedestrian and obstacle according to distance variation. It should be noted that because only a proportion of targets can be captured by camera when they are too close to the vehicle, the curve peak usually appears at 5 m. The detection rates indicate the possibility of the nearest pedestrian being detected. For obstacle detection, if the sum of the disparity value in the red rectangle is larger than the threshold, this area would be considered as an obstacle. Search a strategy in images is bottom to top. Once there is an obstacle, the upper part will be ignored. As shown in figure 1, the travelable area and obstacles are perfectly divided. For pedestrian detection, we use a BHGD classifier to verify whether the ROIs contain pedestrians.
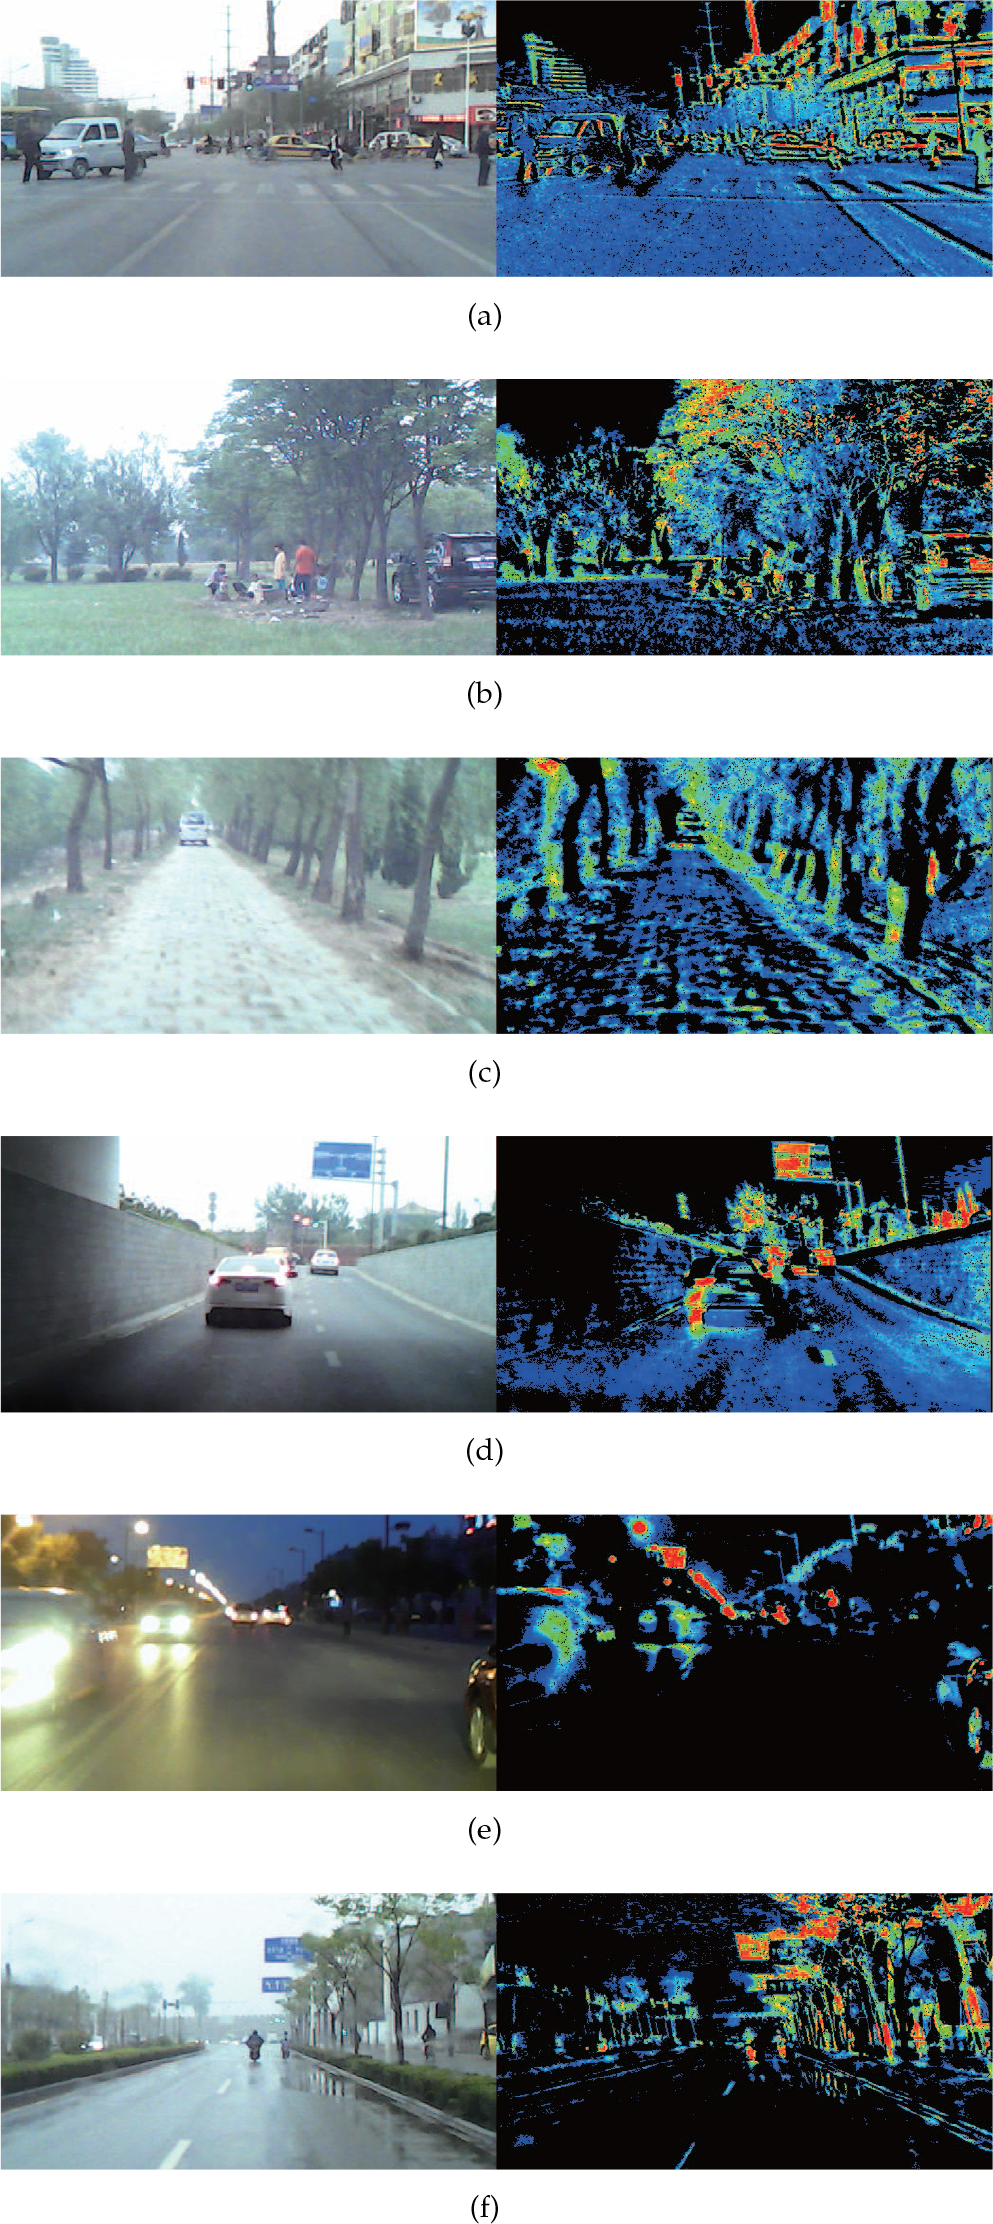
SPM reliability experiment on six categories: (a) is asphalt road, (b) is mud road, (c) is lawn, (d) is slope, (e) is night and (f) is rainy. Obstacle and pedestrian are highlighted in the occlusion image.
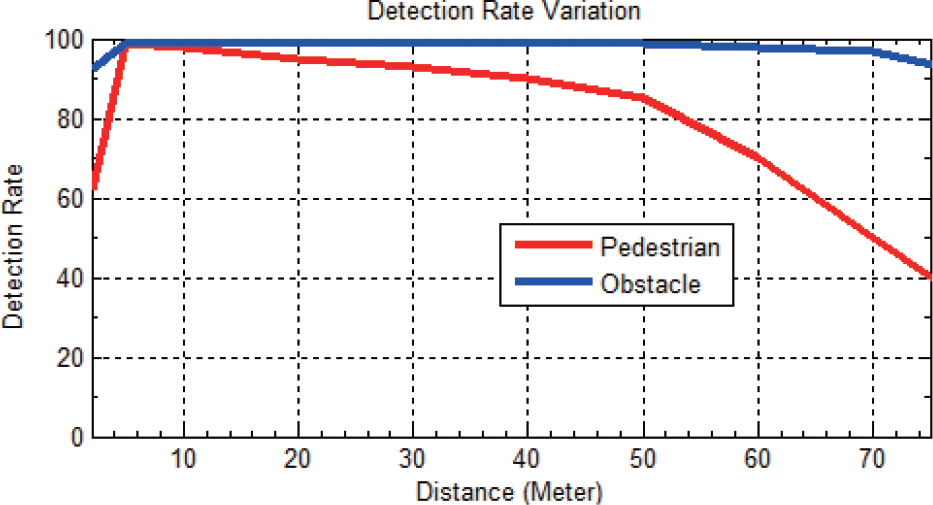
Detection rate of pedestrian and obstacle according to distance variation
Average detection distance and detection rate of obstacle and pedestrian

As the block is the basic unit of our classifier, the layout directly affects the performance of the pedestrian detector. In experiments, we try different sizes and alignment rules to determine the optimal parameters. We tested a variety of typical blocks in the detection window. A block is defined as a square with side length 2 n (n=2,3,4,5,6). The experiment results show that the block of size 8×8 gives the best discrimination as shown in figure 7(a), and overlap blocks show better performance than non-overlap ones. By analysing the data it is not difficult to find that the optimal block size is concerned with window size and pedestrian height in that window. Eight pixels is almost the width of limbs and head in our testing data. Overlap blocks can achieve better performance because they can provide more appropriate blocks.

Detection error tradeoff in experiments. (a) Classification performance of eight kinds of block layouts are considered, including overlap and non-overlap schemes, on INRIA. (b) Performance of BHGD, HW+EOH at original scale and 80%, on INRIA. (c) Comparison between BHGD detector, SVM with HOG and Adaboost with HW+EOH. (d) Three compensation algorithms on INRIA at 80% scale. (e) Three compensation algorithms on MIT at 60% scale. (f) Three compensation algorithms on USC at 40% scale.
As shown in figure 7(c), the BHGD classifier can achieve better detection results than the SVM with HOG and Adaboost with HW & EOH, while consuming equal time. The reason for BHGD achieving better performance is that it retains the most discriminative area in the detection window and removes the weaker blocks. In order to verify the compatibility for multi-scale of BHGD, we shrink the input images, as shown in figure 7(b), and the BHGD is also better than HW and EOH.
The most important feature of the BHGD detector is that it can improve detection accuracy when the input image is smaller than the training data. In our experiments, without compensation our classifier can retain certain accuracy when the input images zoom out to 80% of the training data, as seen in figure 7(d). Performance can be further improved by introducing a compensation algorithm in the BHGD features calculation. We test three compensation algorithms on multi-scales, the performance of WC is shown in figure 8(b), the detection accuracy of small targets is even better than with large ones. EC is shown in figure 8(c). Experiments on database INRIA (figure 7(d), figure 8(b)), MIT(figure 7(e), figure 8(a)), USC (figure 7(f)), and HENU (figure 8(c)) demonstrate the generic features of our detector. In particular, the results on HENU (208 positive pedestrian samples) proves the effectiveness of the detector on small samples.
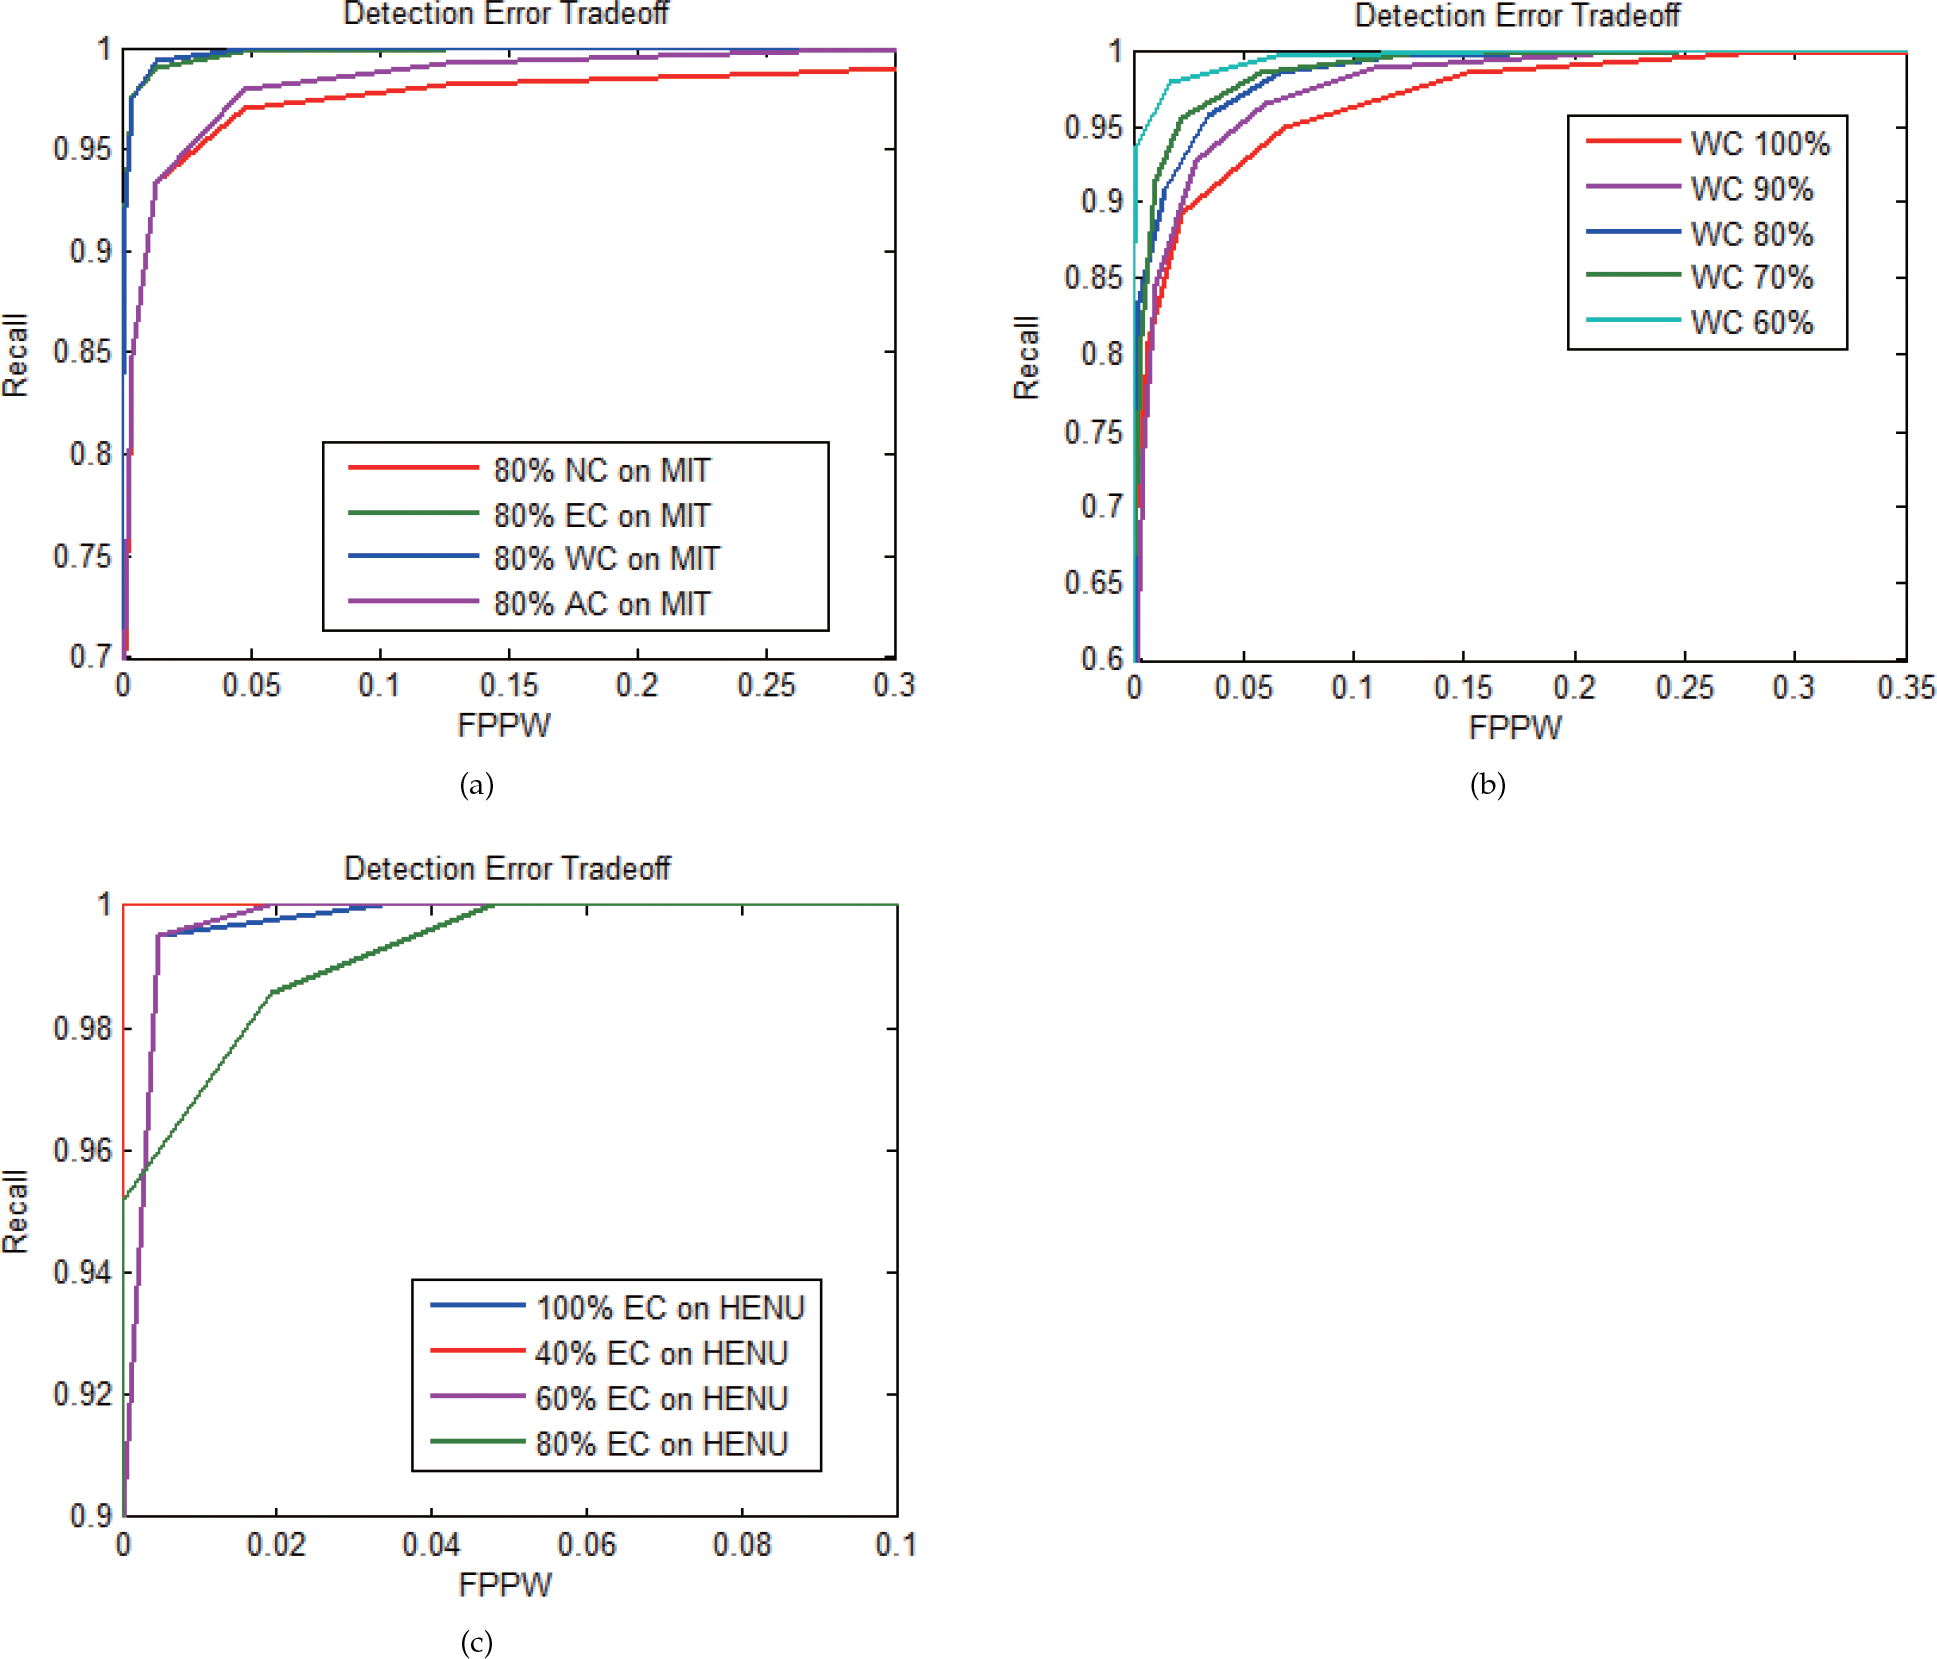
Detection error tradeoff in experiments. (a) Three compensation algorithms on MIT at 80% scale. (b) Detection performance of weight compensation on INRIA from 60–100% scale. (c) Detection performance of enhanced compensation on HENU from 40–100% scale.
In this paper, we present a novel approach for obstacle detection and ROI generation. Instead of using a depth map or disparity map, the SPM is improved to extract stereo geometry from a scene. Because the SPM has low computation complexity and can be precalculated, detection speed is improved. Meanwhile, our method can maintain high accuracy in multiple road conditions, which is essential for an onboard system. The minimum detection height is no less than 5 cm (an object like a speed hump can be detected in our system). The maximum detection distance for obstacles is 80 m, and a false alarm can be removed according to the height and width of the occlusion area. This approach was originally designed to detect obstacles above-ground, but during experiments we found that potholes can be detected too. The SPM algorithm is designed to detect objects above a specific plane with low computational complexity, and the detection results are not easily affected by illumination and textures.
We also propose a pedestrian feature called BHGD and use it in training a multi-scale compatible pedestrian detector. We test the detector on three open databases and our HENU database (208 cropped images and 69 video sequences captured from a moving vehicle in urban areas). Our pedestrian detector achieves better results than the state-of-the-art detection quality at equal speed. In particular, when the size of input images is smaller than the training data, the detection accuracy can be further improved. This feature is particularly suitable for onboard pedestrian detection systems because of the small size of distant pedestrians.