
Abstract
Developing robust and reliable control code for autonomous mobile robots is difficult, because the interaction between a physical robot and the environment is highly complex, it is subject to noise and variation, and therefore partly unpredictable. This means that to date it is not possible to predict robot behaviour, based on theoretical models. Instead, current methods to develop robot control code still require a substantial trial-and-error component to the software design process.
Such iterative refinement could be reduced, we argue, if a more profound theoretical understanding of robot-environment interaction existed. In this paper, we therefore present a modelling method that generates a faithful model of a robot's interaction with its environment, based on data logged while observing a physical robot's behaviour. Because this modelling method — nonlinear modelling using polynomials — is commonly used in the engineering discipline of system identification, we refer to it here as “robot identification”.
We show in this paper that using robot identification to obtain a computer model of robot-environment interaction offers several distinct advantages:
Very compact representations (one-line programs) of the robot control program are generated The model can be analysed, for example through sensitivity analysis, leading to a better understanding of the essential parameters underlying the robot's behaviour, and The generated, compact robot code can be used for cross-platform robot programming, allowing fast transfer of robot code from one type of robot to another.
We demonstrate these points through experiments with a Magellan Pro and a Nomad 200 mobile robot.
Introduction
Fundamentally, the behaviour of a robot (for example its trajectory) is influenced by three components: i) the robot's hardware, ii) the program it is executing and iii) the environment it is operating in. Because this is a highly complex nonlinear system, one usually has to resort to empirical trial-and-error processes to achieve the desired robot behaviour. Such iterative-refinement methods are costly, time-consuming and error prone (Iglesias et al., 2005).
One of the aims of the RobotMODIC project is to establish a scientific, theory-based, design methodology for robot control program development. The approach we pursue in this paper is to “identify” the robot's behaviour, using system identification techniques, thereby obtaining a transparent, analysable computer model in mathematically closed form. Specifically, we use nonlinear polynomial functions using the NARMAX model estimation methodology (see section 2.2). These polynomials model the relationship between the robot's sensory perception and the resulting motor response (“task identification”). The fact that the models are transparent (unlike for example artificial neural network (ANN) or similar opaque models) enables us to use established mathematical operations to analyse them. Such analyses can be used to improve our understanding of the important properties of the robot's behaviour, and also to relate these properties to the task models. This, we believe, is an important step towards the development of a theory of robot-environment interaction that supports the methodical design of future robot controllers and makes testable and falsifiable hypotheses about that interaction.
In this paper we present an example of task identification. We obtain a polynomial model of an ANN-based wall-following task which uses the sonar sensors of our mobile robot to control its rotational velocity. We then analyse the model, determining the sensitivity of the output to each of the sonar sensor inputs using a sensitivity analysis method — this is one example of of many possible mathematical analyses that can be applied to the task model.
Robot identification offers practical advantages as well: First, such models are an extremely compact, essentially one-line representation of the robot's task, thus increasing computational efficiency and memory use. This can be an issue for example in space exploration robots or miniature robots.
Second, such models offer the possibility transferring robot control code to different robots with similar sensor types and configurations to the one used to obtain it. The transfer of the task to the new robot is fast, regardless of the robot's programming platform, since the task model is essentially one line of universal mathematical code. This is a novel method to exchange control programs between different robot platforms. We demonstrate the use of this method in this paper, by identifying the wall-following behaviour of a Magellan Pro robot, and transferring the model — without any further programming or alteration — to a Nomad 200 robot. We show that both robots behave similarly.
Experimental procedure and methods
Experimental procedure
Our first goal was to identify the behaviour of a Magellan Pro mobile robot following a wall. The experimental scenario is the one shown in figure 2. The Magellan Pro is equipped with front-facing laser, sonar, infrared, tactile and vision sensors (figure 1), and operated in a closed arena at the University of Essex (see figure 2).

Radix, the Magellan Pro mobile robot used in the experiments described in this paper.
During execution of the task under investigation we log information every 250 ms. The logged data includes all sensor and actuator values of the robot, as well as the position and orientation of the robot. The position information obtained, therefore, is not subject to any drift errors (as would be the case if we used the robot's onboard odometry). The position information obtained with the overhead camera and the sensor data obtained by the robot are aligned after the completion of the task execution using time as the common reference. Figure 2 shows an overhead image of one experimental setup.
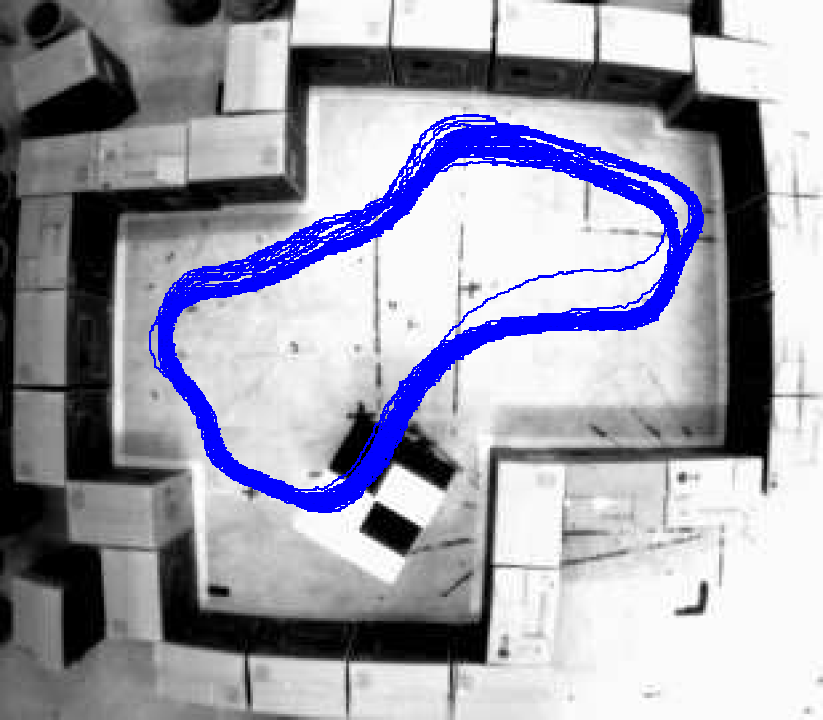
The environment in which experiments were conducted and the robot's trajectory. The robot is visible in the bottom of the image. The dimensions of the navigable space in the environment are approximately 3.3m × 2.8m. The robot is executing a wall-following behaviour (following the right wall), i.e. the direction of motion is counter-clockwise with respect to the image.
After the collection of the experimental data a mathematical model is obtained that relates the robot's sensory perception to the robot's motor response. How this is done is explained in the following section.
The NARMAX modelling approach is a parameter estimation methodology for identifying both the important model terms and the parameters of unknown non-linear dynamic systems. For multiple input, single output noiseless systems this model takes the form:

The first step towards modelling a particular system using a NARMAX model structure is to select appropriate inputs u(n) and the output y(n). The general rule in choosing suitable inputs and outputs is that there must be a causal relationship between input signals and output response. In the case of the wall-following robot presented in this paper we have chosen as inputs the robot's sonar range sensors and as output the robot's rotational velocity.
After the choice of suitable inputs and outputs, the NARMAX methodology breaks the modelling problem into the following steps: i) polynomial model structure detection, ii) model parameter estimation and iii) model validation. These steps form an estimation toolkit that allows the user to build a concise mathematical description of the system. These procedures are now well established and have been used in many modelling domains (Billings and Chen, 1998).
A detailed procedure of how structure detection, parameter estimation and model validation is done is presented in (Korenberg et al., 1988, Billings and Voon, 1986). Two applications of the NARMAX modelling method in robotics are presented in (Iglesias et al., 2005) and (Nehmzow et al., 2005).
Experimental results
Overview
This section presents an example of task identification. The task under investigation (wall-following) and the data collection procedure, using the Magellan Pro mobile robot, is explained. After that, the NARMAX modelling process which led to the task model is described. In order to verify that the model obtained is a faithful representation of the task, suitable statistical tests are chosen to compare the behaviour of the robot when executing the task and that when executing the NARMAX model of the task.
After that, an example of task model analysis is presented were a measure of the relative importance of the model inputs to the model output is estimated.
Finally, to demonstrate the portability of the task in the form of a polynomial, the model was sent to colleagues in the Department of Electronics and Computer Science of the University of Santiago de Compostela in Spain, to run on their Nomad 200 mobile robot. The Nomad robot executed the task in the corridors of the department while continuously recording its sensor data. For comparison purposes the Nomad 200 was also run in the same environment with the original ANN controller.
The wall-following task
An ANN-based wall-following task similar to the one described in (Iglesias et al., 1997) and (Iglesias et al., 1998) was used in this experiment to drive the robot. An overhead image of the lab environment used to collect data using the Magellan Pro robot and the resulting trajectory of the robot is shown in figure 2.
The program uses as input the information coming from the sonar sensors facing the frontal obstacles and the wall being followed, and as output the appropriate robot rotational velocity ω to effect the desired wall-following behaviour (see figure 3). The transitional velocity of the robot was kept constant at 0.08m/s.

Diagrammatic representation of the ANN wall-following program used in the experiments conducted in this paper.
Briefly, the wall following behaviour is achieved as follows: To reduce the dimensionality of the input space a self-organising map (SOM) (Kohonen, 1997) is used. This reduces the input to a six-component vector uc which is subsequently thresholded using a simple low-pass filter (LPF) to produce a binary vector ud. This thresholding is done to further reduce the input space to 64 (26) possible states. The binary vector is then fed into a multilayer perceptron (MLP) which outputs the appropriate rotational velocity for the robot. The MLP is trained using data generated using a robot driven by a human operator.
During execution, because the number of possible input states is relatively small, a lookup table is used instead of the MLP to provide the output. This is done in order to minimise computational load.
Using the procedure described in section 2.2, a model of the ANN wall-following task was obtained. In order to avoid making assumptions about the relevance of specific sonar sensors, measurements from all sonar sensor were taken into account. The model structure was of input order Nu = 2, output order Ny = 0 and degree l = 2. This initially produced a polynomial of 1225 terms of which, after iterative refinement, only 29 remained. The final model equation is shown in Table 1.
The NARMAX model of the ANN wall-following task, showing the rotational velocity ω as a function of the sonar sensor values si, ∀i = 1,…, 16.

The NARMAX model of the ANN wall-following task, showing the rotational velocity ω as a function of the sonar sensor values si, ∀i = 1,…, 16.
Figure 4 compares the actual and model-predicted rotational velocities for part of the validation data set. To validate the model further, we computed the Pearson and Spearman rank correlation coefficients r and rS between the original rotational velocity ωorig and the model-predicted rotational velocity ωmodel. These were found to be r = 0.81 and rS = 0.74 (both significant, p < 0.05), thus indicating no significant difference between ωorig and ωmodel.

A plot of the actual and model-predicted rotational velocities for part of the validation data set for the wall-following behaviour.
Of course, the final and most important validation of any model of robot-environment interaction is to actually execute the model on a real robot in the target environment. We therefore used the model given in Table 1 to actually drive the Magellan Pro Radix. The behaviour of the robot was then compared to that obtained when the original ANN wall-following program was being run. Figure 5 shows the two trajectories superimposed for the purposes of this comparison.
In a first step of comparing the robot's original behaviour with the one it exhibits when controlled by the model given in Table 1, we compare the two trajectories visually. This is shown in figure 5.
From this figure we can see that even within one behaviour there is a certain amount of inevitable variation, but it is clearly visible that both the original and the model behaviour constitute a wall-following behaviour, and that the two trajectories are almost identical.
From merely optical inspection we therefore believe that the two behaviours in figure 5 are very similar, since they show few deviations. The model certainly displays a wall-following behaviour especially at the most challenging aspects of the environment, which are the convex and concave corners.
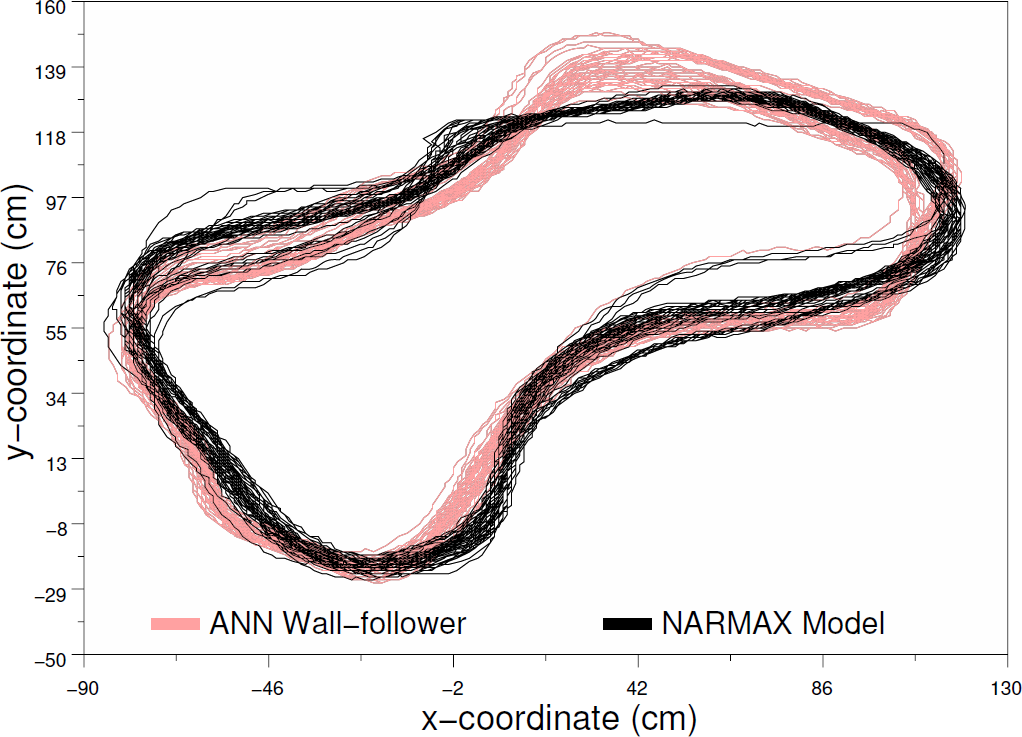
A comparison between the trajectory of the robot when executing the ANN wall-following program and when executing the estimated NARMAX model of this task.
It is now interesting to quantify this statement, and to strengthen it through statistical analysis.
We therefore also performed numerical tests to determine the degree of similarity between the two robot behaviours shown in figure 5. Since this is a wall-following behaviour in a static environment and the robot moves with a constant transitional velocity, there are two distributions we can test for similarity for each of the two behaviours:
the distribution of minimum robot distance to the wall in the original and the model-driven behaviour, and the distribution of the robot's rotational velocity in both cases.
Each of these statistical measures is plotted for both trajectories in figures 6 and 7 respectively.
We analysed both pairs of distributions in figures 6 and 7, using the Mann-Whitney U-test (Barnard et al., 1993, Snedecor and Cochran, 1989) to check whether they are significantly different or not — both tests indicated that the distributions are not different at the 5% significance level.
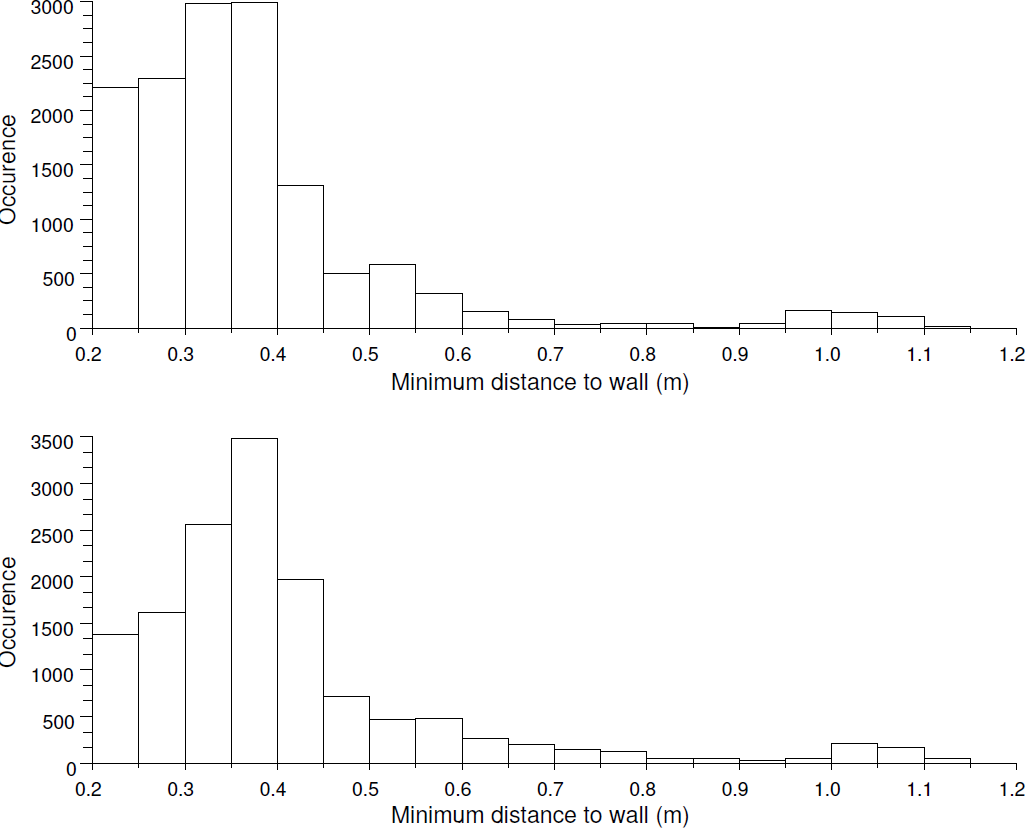
The distributions of the minimum robot distance to the wall for the ANN wall-following program (top) and the NARMAX model (bottom).

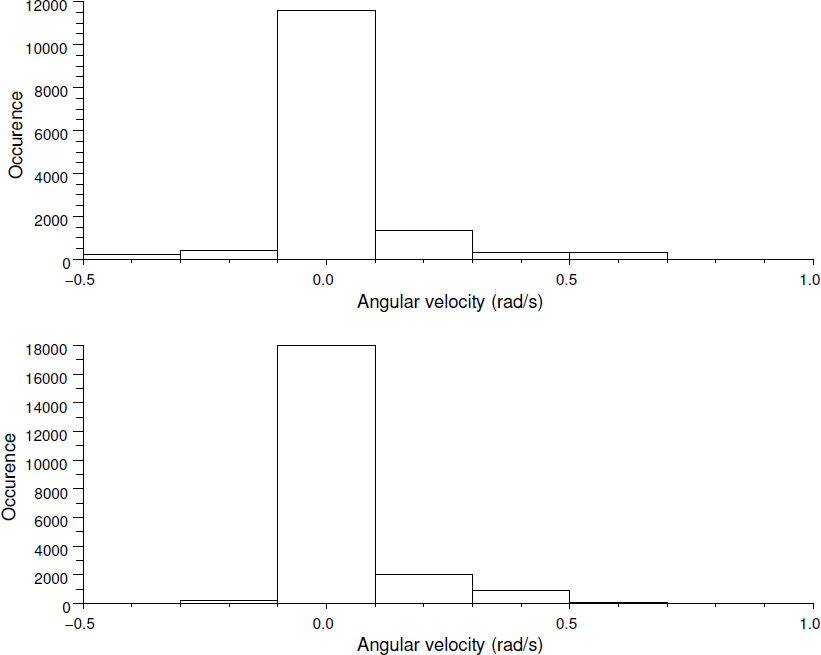
The distributions of the robot's rotational velocity for the ANN wall-following program (top) and the NARMAX model (bottom).
We also compared the space occupancy of each trajectory, essentially treating the two trajectories as static “monochromatic images”. To do this the space occupancy of each trajectory along the x and y axes was separately analysed. Figure 8 shows the distributions of the robot's position along the x-axis for both the ANN wall-follower and the NARMAX model. Figure 9 shows the same distributions for the y-axis.

The distributions of the robot's x-coordinate for the ANN wall-following program (top) and the NARMAX model (bottom)

The distributions of the robot's y-coordinate for the ANN wall-following program (top) and the NARMAX model (bottom)
Again the Mann-Whitney U-test was used to compare each pair of distributions. Both tests indicated that the distributions are not significantly different (p < 0.05).
In summary, there is no statistically significant difference between the distribution of distances to the wall under ANN-control and that obtained under model control. Furthermore, there is no significant difference between the x and y occupancy of the two trajectories — further evidence supporting the thesis that the behaviour achieved with the original ANN controller is identical to the behaviour achieved using the model of Table 1.
The purpose of task identification is to understand robot behaviour by analysing the model obtained. This is now possible since we have an explicit or transparent mathematical model which represents the robot's task.
As an example of one such analysis we use the task model to determine how important are the individual sonar sensors on the robot with respect to the modelled task. In mathematical terms this is equivalent to performing an input sensitivity analysis on our model. This analysis is useful because it may indicate redundant sensors which can be completely removed from the model equation in order to save computational time. In a single-task, purpose-build robot such sensors will also be removed physically from the robot in order to also save space, weight and system power consumption. On the other hand, a sensitivity analysis can point out the sensors upon which the task is most dependent. If this is a critical task which we need to protect from failures as much as possible, we may choose to improve the quality of these sensors or add more as a measure of redundancy.
Sensitivity analysis determines the contribution of each individual input's noise to the overall noise observed in the output, thus indicating the relative importance of each input to the overall behaviour of the system. Whereas a sensitivity analysis of a single-input system can be easily investigated, a thorough sensitivity analysis of a multi-input system becomes increasingly difficult as the dimensionality of the input increases. For a sixteen-input task model such as the one in Table 1 it is impossible with the current available computational power to compute the sensitivity of the output for the entire input space.
Instead we can estimate the sensitivity using the method described in (Sobol', 1993). Sobol shows how a nonlinear mathematical function with multidimensional input can be decomposed into a sum of orthogonal functions (called summands), each dependent on one or more input components. The Monte Carlo algorithm can then be used to estimate the sensitivity of the original function to each summand. In this paper, we have used Sobol's method to estimate the noise contribution of each sonar sensor individually, the result is given in figure 10 (all sensitivity indices given add to 1).
The graph in figure 10 indicates that the rotational velocity of the robot is particularly sensitive to sensors 13 and 14. These sensors are located on the right-hand-side of the robot, and because the robot executes a right hand wall-follow it seems not surprising that our sensitivity analysis has given this result. However, it is surprising (and useful to know) that only two out of six sensors on the right hand side are important. This result could be used, for instance, to design cheaper wall-following robots which use fewer sensors.

The sonar sensor sensitivity estimates computed from the model in Table 1 using the method described in (Sobol', 1993).
Identifying robot behaviour, as outlined above, not only generates very compact, transparent and analysable code, it also offers the advantage of allowing extremely fast cross-platform programming. A model such as the one one given on Table 1 is essentially one-line code that can be run on any robot platform that has the required sensing and acting capabilities.
To demonstrate this, we have used the NARMAX model in Table 1 to control on a Nomad 200 robot (see figure 11), moving in the corridors of the department of Electronics and Computer Science of the University of Santiago de Compostela, Spain. Like the Magellan Pro, the Nomad 200 robot uses 16 sonar sensors distributed evenly over 360°.

The Nomad 200 robot while executing the wall-following task.
To verify that the Nomad robot behaves in a similar fashion as if the original ANN wall-following code was executed, sensor data was also collected with the original task code. It is important to note that the environment in these two cases was unchanged (figure 12).
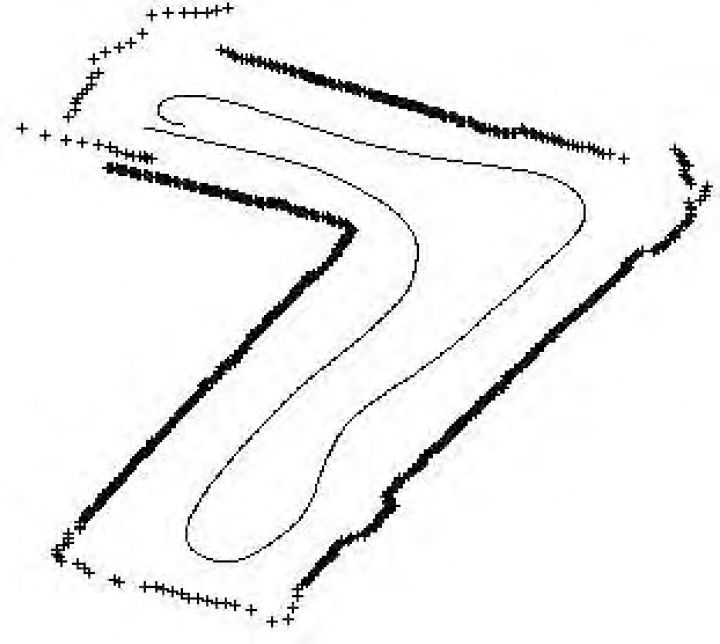
Trajectory followed by the Nomad robot in its first lap in a L-shaped environment, and when the Narmax model was used to control it. The symbol ‘+’ reflects the sensor measurements provided by one of the lateral sensors during this first lap.
As with the Magellan Pro robot, in order to compare the behaviour of the Nomad robot when running the original task and the task model, we used the Mann-Whitney U-test to compare the minimum distance to the wall and the rotational velocity of the Nomad. Both tests revealed no significant difference (p > 0.05) between the two pairs of distributions shown in figures 13 and 14 1 .
What we observed in this experiment, in short, was that a different robot — the Nomad 200 — would exhibit qualitatively similar behaviour to the Magellan robot, which had been used to “identify” the behaviour — in other words, that control code transfer was possible.
There are, however, statistically significant differences in the robots' distances to the wall (compare figures 6 and 13) and the robots' turning speeds — figures 7 and 14 (U-test, p < 0.05), indicating that the two robots do not behave identically in all respects. This, we believe, is due to the different environments in which experiments were conducted — a closed environment constructed from cardboard boxes in the Magellan's case, an office corridor in the Nomad's case — as well as physical differences between the robots, such as sensor characteristics, weight distribution and motor power.

The distributions of the minimum robot distance to the wall for the ANN wall-following program (top) and the NARMAX model (bottom) for the Nomad 200 robot.
The distributions of the robot's rotational velocity for the ANN wall-following program (top) and the NARMAX model (bottom) for the Nomad 200 robot.
In this paper we have shown how the NARMAX modelling approach can be used to obtain a non-linear polynomial model of the robot's task in a real robot-environment-task system. We have also shown how these models can be validated (both qualitatively and quantitatively) to prove that they are faithful representations of the task program codes. As faithful models, they are valuable tools in the analysis of robot behaviour and the development of robot control code.
We have also shown that as a consequence of compressing the task into a single NARMAX polynomial it is possible to transfer control code to a different robot platforms (with similar sensor configuration) quickly and efficiently.
Most importantly, this paper demonstrates how a transparent model of the task can be directly analysed using established mathematical methods — which would be either impossible or at least very hard with opaque models such as artificial neural networks.
In summary, robot identification allows the user to
Generate a compact one-line representation of a robot's behaviour, Analyse this behaviour quantitatively, in particular identify the individual importances of each sensor, Transfer control code quickly and efficiently between different robot platforms, without the need of re-coding for the new target platform, and Use this principled and theory-based approach of developing robot control code to reduce the dependence upon trial-and-error methods and the designer's intuition.
Footnotes
Acknowledgments
The authors would like to thank the following institutions for their support:
The RobotMODIC Project is supported by the Engineering and Physical Sciences Research Council (EPSRC) grand GR/S30955/01 under the Mathfit initiative. Roberto Iglesias is supported by research grants PGIDIT04TIC206011PR and TIC2003-09400-C04-03.
1
A comparison of the trajectory of the Nomad robot when executing the original code and the model could not be made in this case because there were no reliable means of recording the position of the robot during its operation.