
Abstract
Discriminant saliency is a kind of decision-theoretic-based saliency detection method that has been proposed recently. Based on local gradient distribution, this paper proposes a simple but efficient discriminant centre-surround hypothesis, and builds local and global saliency models by combining multi-scale intensity contrast with colour and orientation features. This method makes three important contributions. First, a circular and multi-scale hierarchical centre-surround profile is designed for the local saliency detection. Secondly, the dense local gradient orientation histogram (LGOH) of the centre-surround region is counted and used for the local saliency analysis. And thirdly, a new integration strategy for the local and global saliency is proposed and applied to the final visual saliency discriminant. Experiments demonstrate the effectiveness of the proposed method. Compared with 12 state-of-the-art saliency detection models, the proposed method outperforms the others in precision-recall, F-measures and mean absolute error (MAE), and can produce a more complete salient object.
Keywords
1. Introduction
The mechanism of saliency plays an important role in visual selective attention. It may provide a rapid and effective strategy to reduce the computational complexity of visual processing. Inspired by biological vision systems, numerous computational saliency models of visual attention have been proposed and widely used in the fields of machine vision, image processing and intelligent robotics, etc.
Most of current biologically-inspired visual saliency models usually rely on bottom-up/spatial-based or top-down/object-based processing. The bottom-up model is based on feature integration theory and the centre-surround hypothesis [1–2]. The primal images are decomposed into several independent feature spaces, such as intensity, colour and orientation, etc. The conspicuity map of each feature space is extracted individually, and they are then linearly combined to form the final saliency map. The top-down model is a kind of goal-directed saliency analysis, and it requires prior knowledge of the tasks in question [3–4]. Compared with the bottom-up model, it can realize more efficient and accurate visual searching, but its cost is lower speed and higher computational complexity. Some alternative models have been proposed that integrate top-down and bottom-up saliency attention [5–6]. However, the main shortcomings of these models are low resolution, poorly-defined object boundaries and high computational costs.
In recent years, many saliency models have been proposed. R. Achanta et al. presented a fast salient region detection method based on the low-level features of luminance and colour [7]. It can generate high quality saliency maps of the same size and resolution as the input image. R. Achanta et al. also introduced a higher precision salient region detector based on a frequency-tuned method [8]. V. Gopalakrishnan et al. presented a colour and orientation distribution-based salient region detection framework [9]. They introduced a novel orientation histogram of image regions that can be used to characterize the local and global orientations. D. Gao et al. proposed a discriminant saliency detector [10–11]. It is rooted in the decision-theoretic interpretation of perception, and can produce optimal saliency measures in the sense of classification. In the frequency domain, Q. Zhang et al. analysed and integrated local saliency, global saliency and rarity saliency into the same framework [12]. Distinct from the bio-inspired models, these models are usually pure computational ones. Although they are inspired by the biological concept of centre-surround contrast, they are not based on any biological model. In addition, a centre-surround hypothesis based on Weber's Law [13] has been proposed by us. It provides better saliency detection performance than those of Itti [1], Achanta [8] and Rahtu [14]. However, this method exhibits undesirable blur in the detected salient object, and tends to highlight objects' boundaries rather than the whole object.
In this paper, we introduce a new and efficient discriminant centre-surround hypothesis for saliency detection. It is inspired by the biological model of spatial receptive fields and the concept of local descriptor in the field of computer vision. Specifically, the centre-surround differences are estimated by LGOH, such as the gradient location and orientation histogram (GLOH) [15], the DAISY descriptor [16–17], the local binary pattern (LBP) [18] and the Weber local descriptor (WLD) [19], etc. Note that we do not strictly discuss the biological plausibility of this hypothesis in cognitive neuroscience, instead demonstrating by experiments its good performance, enhancement of salient areas and suppression of non-salient areas.
Compared with other saliency models, our model has the following main contributions:
Inspired by the centre-surround pattern of biological vision, we design a circular and multi-scale hierarchical centre-surround profile for each pixel of the primal image.
We extract the LGOH of the centre-surround region to represent the centre-surround differences, and use the statistic of LGOH as a decision value for the local saliency analysis.
We proposed a new integration strategy for the local and global saliency to get the final visual saliency maps.
This paper is organized as follows. Section 2 describes the proposed discriminant centre-surround hypothesis. Section 3 discusses the local saliency analysis based on LGOH, and gives a new integration strategy for the local and global saliency. Section 4 shows some experimental results and discussions. Finally, Section 5 presents our conclusions and prospects.
2. The Proposed Centre-surround Hypothesis
The centre-surround hypothesis is an important mechanism for almost all saliency models, whether they are bio-inspired or pure computational. Its main function is self-excitation in the central excitatory regions while inhibiting in the surrounding regions [2]. L. Itti et al. determined centre-surround contrast using a difference of Gaussian (DoG) [1–2]. S. Frintrop et al. used a square filter to compute centre-surround differences [20]. R. Achanta et al. used a centre-surround feature distance [7]. A frequency domain processing-based centre-surround contrast estimation method was presented in [8]. Meanwhile, D. Gao et al. proposed a discriminant centre-surround hypothesis by combining the hypothesis of decision-theoretic optimality with the traditional hypothesis. It maximized the mutual information between the feature distributions of the central and surrounding regions [10–11].
In this section, we present a simple but efficient discriminant centre-surround hypothesis. We begin by describing the structure of our centre-surround organization and then discuss how to apply it to the local saliency detection.
2.1 Circular and Multi-scale Hierarchical Centre-surround Profile
Here, we are mainly inspired by two research achievements in the field of cognitive neuroscience.
The first one is the compartmental model of the cone-H1 cell network, which had been used to simulate the synergistic centre-surround receptive field of the monkey H1 horizontal cells [21]. The simplified compartmental model is shown in Figure 1, where the centre-surround receptive field (the grey region) is organized by the horizontal cell network. Each horizontal cell is modelled as a soma represented by a sphere and connected to all of the cones lying in a 120 µm diameter dendritic field. Horizontal cells are connected to their nearest neighbours with resistive gap junctions.

Illustration of the simplified compartmental model
The second one is the resolution hypothesis in the visual attention mechanism [22]. Experimental evidence suggests that the attention mechanism can actively enhance the spatial resolution at the attended location. Moreover, the attention dynamics can be demonstrated by the processing of multiple spatial resolutions with a visual search of hierarchical patterns.
Based on the aforementioned neuropsychological evidence, we design a circular and multi-scale hierarchical centre-surround profile by extending the compartmental model to a multiple spatial resolution model. The illustration of the proposed centre-surround organization is shown in Figure 2.

Illustration of the proposed centre-surround organization
The image plane can be regarded as the cone array in Figure 1. Figure 2(a) shows the structure of the centre-surround (the grey region) that is composed of N concentric circles with different radii. There are M hypothetical H1 cells (solid circular points) on each concentric circle. The hypothetical H1 cells on different concentric circles have different spatial resolutions. Clearly, the hypothetical H1 cells on circles with a larger radius have higher spatial resolution than those on circles with a smaller radius. The range of the dendritic field of each hypothetical H1 cell is illustrated by the identically coloured circles in Figure 2(b).
2.2 Discriminant Centre-surround Hypothesis for Local Saliency Detection
Based on the well-known fact that human the vision system is sensitive to gradient magnitude and orientation, we present a discriminant centre-surround hypothesis by the statistical analysis of the LGOH. Firstly, we use the DAISY descriptor to extract the dense LGOH of the centre-surround region. Next, we propose the local saliency decision by the variance analysis of the LGOH.
Let

More details about the DAISY descriptor can be found in the literature [16–17]. Here, we reorganize Equation (1) to form our LGOH for the local saliency analysis.
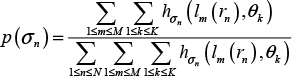
Assume that K is the number of bins in the histogram. hσ(lm(u0, v0, r), θk) is the value of the kth bin in the histogram

where:

According to the centre-surround mechanism, we suppose there is statistically significant difference between the responses of the central and surrounding regions at or near the salient location. Similar statistical suppositions have been discussed in many recent studies [7, 9, 11, 23]. To propose the local saliency decision by the variance analysis of the LGOH, we let Vk be the variance of the vector

and:

where h̄ is the mean of vector
3. The Whole Saliency Decision
This section introduces our integration strategy for the local and global saliency. We first describe the workflow of our complete saliency decision algorithm. Next, a global saliency detection method is introduced. Finally, a new integration strategy is discussed.
3.1 Workflow of our Saliency Decision
The whole process of the proposed saliency decision algorithm is shown in Figure 3. First, the low-level colour features are extracted. Since the perceptual differences in the CIELAB colour space approximates to Euclidian space [7, 24], we use the L*a*b* colour features.

Workflow of the proposed saliency detection algorithm
Next, we compute the local and global saliency of each colour channel, respectively. Local saliency represents the difference between a region and its surroundings. It can be computed by Equation (4). However, it is not enough to make decision only according to the local saliency, because high local saliency values may lie in some global texture regions, such as the skyline. So, it is necessary to use global saliency to provide global constraints and further reduce the effects of backgrounds.
Finally, we generate the final saliency map by a new integration strategy for the local and global saliency.
3.2 Global Saliency Decision
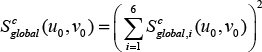
We apply the method of SF [25] to extract the multi-scale global saliency in each colour channel. Let Sglobalc(u0,v0),cϵ{l,a,b} be the global saliency of the pixel located at (u0, v0) on scale i, where 1 ≤ i ≤ 6. The first scale corresponds to the input image and the sixth scale corresponds to the coarsest scale. Accordingly, the global saliency of the pixel located at (u0, v0) in colour channel c can be expressed as:
3.3 Integration Strategy for Local and Global Saliency
The purpose of the integration strategy for local and global saliency is to enhance the response of the local contrast while inhibiting that of the background. Therefore, we calculate the exponent of local saliency and take the global saliency as a global constraint by using it to weight the exponential local saliency. Thus, the saliency in each colour channel can be expressed as:

where Sglobalc(u0,v0),cϵ{l,a,b} are calculated according to Equation (4). Lastly, to get the final saliency map, we combine the saliency maps of the l, a and b channels, as follows:

Different from other combining strategies for local and global saliency, ours is a soft-decision integration strategy. As such, we do not perform a binary threshold operation during the integration process. Figure 4 illustrates the effects of our integration strategy for the local and global saliency. Clearly, the final saliency maps weighted by global saliency - shown in the fifth column - are much better than all the local saliency maps shown in the second through to the fourth columns.

From left to right are: input images, local saliency maps of the 1-channel, the a-channel and the b-channel, final weighted saliency maps and ground truths, respectively
4. Experiments and Discussion
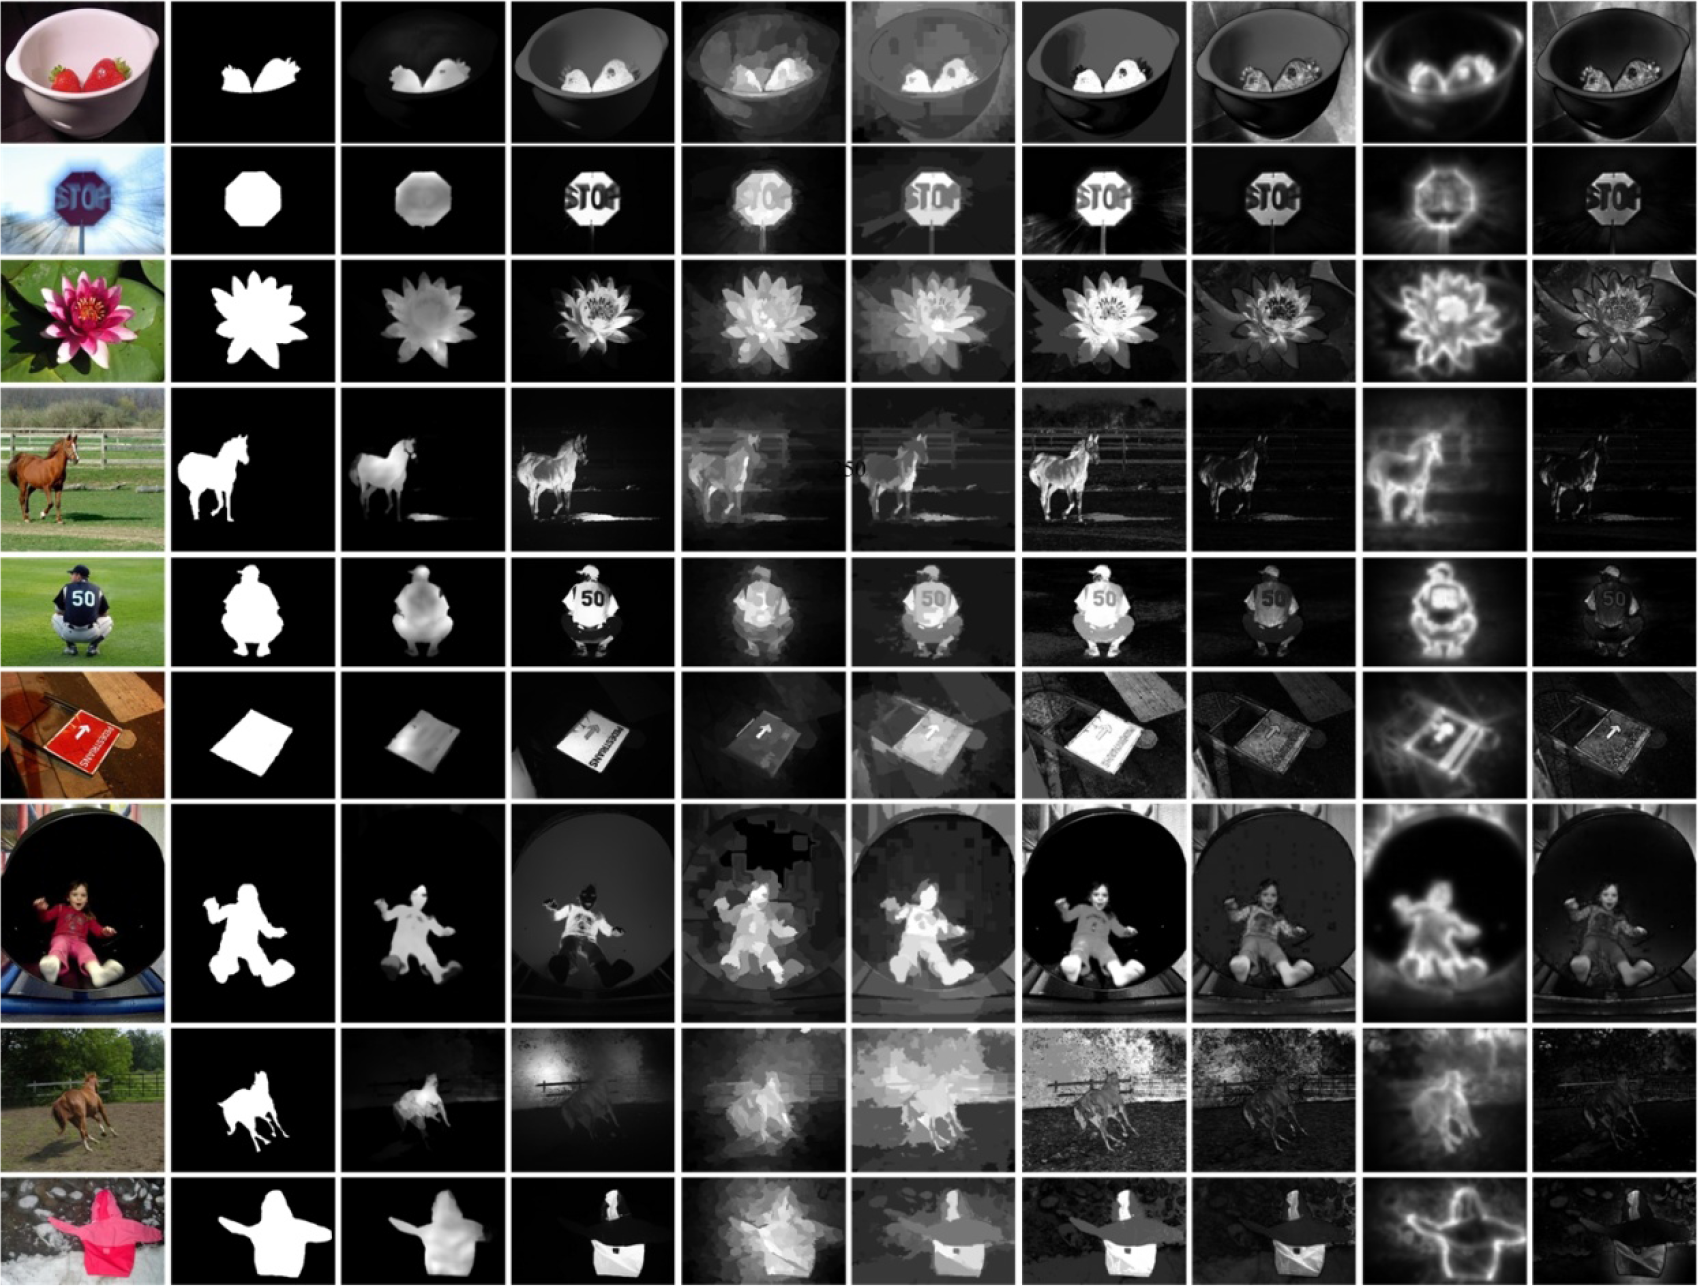
We evaluate our method on a commonly-used database that includes 1,000 images and their ground truths [8]. We select 12 state-of-the-art methods for comparison, namely: SF[25], LR[26], HC[27], RC[27], FT[8], AC[7], CA[28], GB[29], IT[1], LC[30], SR[31] and MZ[32]. Some visual comparison results are shown in Figure 5.
The original results of these 12 methods can be found at http://users.eecs.northwestern.edu/˜xsh835/LowRankSaliency.html, http://cg.cs.tsinghua.edu.cn/people/˜cmm/saliency/ and http://ivrgwww.epfl.ch/supplementary_material/RK_CVPR09/.
Considering the computational cost, the proposed centre-surround organization shown in Figure 2 should not be too complex. So, we take the medium values and set N = 3, M = 8 and K = 8. The binary threshold is 0.1 and the range of the saliency value is [0, 1]. Due to the combination of the local and global saliency decisions, our algorithm can extract more exact salient regions and - preferably - inhibit the saliency values at the non-salient regions.
In the following three subsections, we provide more concrete comparisons in terms of precision-recall, F-measure and mean absolute error (MAE).
4.1 Precision-recall Curve with Fixed Threshold
Precision and recall reflect the effectiveness and completeness of the saliency detection, respectively. The higher the recall ratio, the more complete the detected salient object. It is well-known that there exists a trade-off between precision and recall.
We first compare the precision-recall curves with a fixed threshold, which takes a value within the range [0,255]. For each fixed threshold, a binary salient map is generated from the saliency result and the corresponding precision and recall are calculated. The precision-recall curves are shown in Figure 6. Clearly, our method outperforms the other 12 methods in most cases.
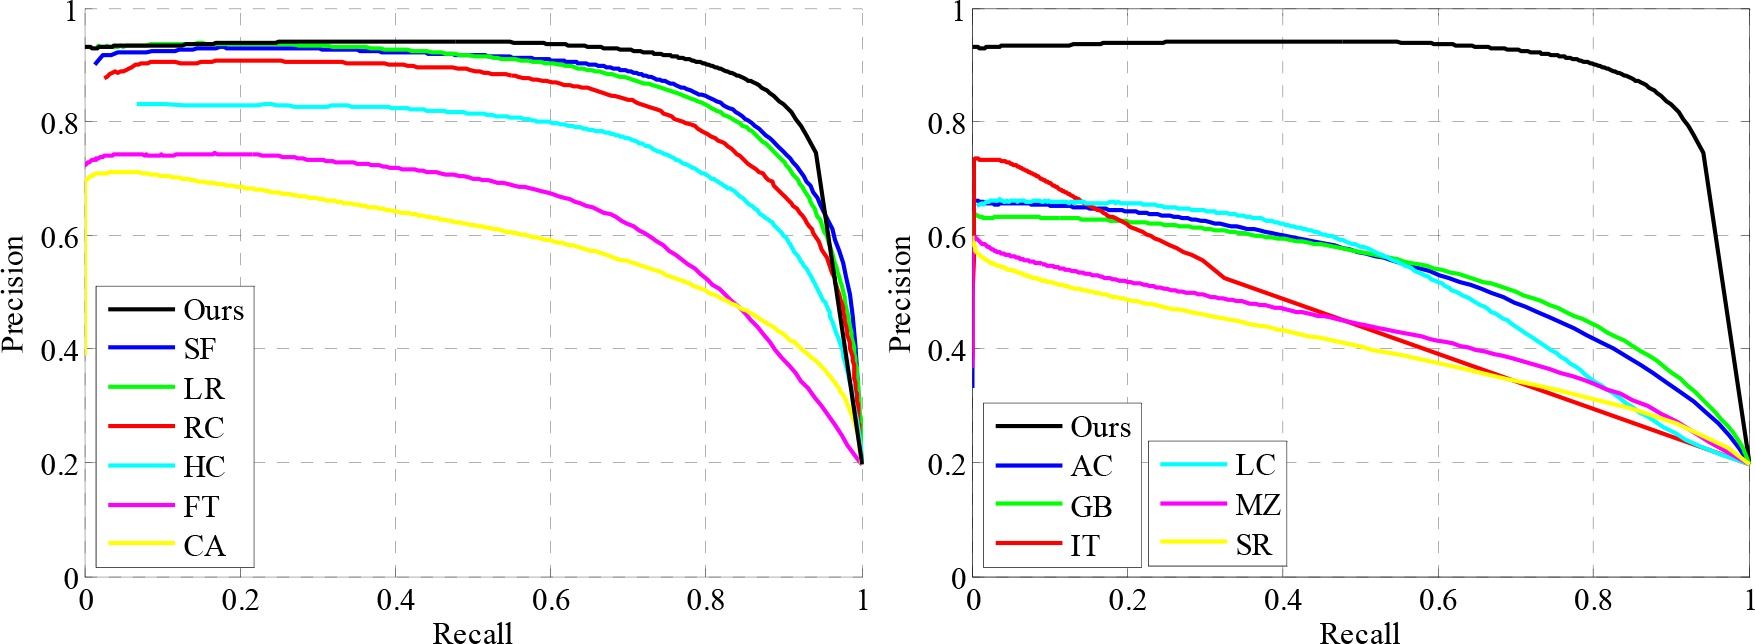
Evaluation of the precision and recall with a fixed threshold
4.2 Precision-recall Bar Char with Adaptive Threshold
We set the adaptive threshold as twice the mean of all the pixels' saliency, i.e.:

where w and h are the width and height of the saliency map S, respectively. The binary salient map is obtained by comparing each pixel's saliency with the adaptive threshold. In the calculation of the F-measure, we use the following equation:

where β2=0.3. Next, we draw the precision-recall bar chart with an adaptive threshold in Figure 7. Evidently, the precision, recall and F-measure of our method are the best among these methods.

Evaluation of the precision, recall and F-measure with adaptive threshold
4.3 Mean Absolute Error (MAE)
In the evaluation of the precision and recall, the selection of the threshold has a higher impact on the evaluation results. In particular, a different calculation method for the adaptive threshold may cause different evaluation results. From our viewpoint, it is difficult with the precision-recall evaluation to reflect the algorithm performance comprehensively. Furthermore, it is even harder to evaluate the effects of uniform highlighting and background inhibition.
The MAE estimates the approximation degree between the continuous saliency map S and the ground truth GT, which provides us with a new means of evaluation. We calculate the MAE according to the following definition:

where w and h are the width and height of the saliency map S, respectively. The comparison results in Figure 8 show that the MAE value of our method is the lowest.

Evaluation of the MAE
5. Conclusions
In this paper, a circular and multi-scale hierarchical centre-surround profile is designed. Afterwards, a simple but efficient discriminant centre-surround hypothesis and a local saliency decision based on the variance analysis of LGOH are presented. Finally, we discuss a soft-decision integration strategy for the local and global saliency in the CIELAB colour space.
Plenty of experiments have been done to verify the effectiveness of our method. In addition to the final saliency detection results, precision, recall and F-measure, we also provide more objective evaluation by MAE. All our experiments demonstrate that our algorithm can produce more complete salient objects and that it has a stronger response in salient regions and better inhibition performance in non-salient regions.
Future work might focus on finding a more effective integration strategy to inhibit the effects of the global texture and backgrounds while enhancing the response of the attention regions.
Footnotes
6. Acknowledgments
This work has been founded by the National Natural Science Foundation of China (No. 60902077, No. 61102146) and Zhejiang Provincial Natural Science Foundation of China (LY12F05004). The authors are grateful to the anonymous reviewers who made constructive comments.