
Abstract
Expected marginal seat revenue (EMSR) is a well-known method for airline seat inventory control airlines. However, this method employs a static model to study the dynamic reservation process, and does not take into account the risk tolerance of policy makers. Expected marginal seat utility (EMSU) replaces revenue by utility, which addresses the real situation of seat inventory control. However, there is still a lack of multi-leg seat control algorithms based on EMSU. Therefore, using EMSU and bucket algorithms, this paper applies the Markov decision-making process to simulate the flight reservation process and builds a dynamic multi-leg seat inventory control model. Experimental results validate the effectiveness of the proposed method.
1. Introduction
Airline seat inventory control is about “selling the appropriate seat to the right person at the right time” [1]. If all the airline's seats are sold at a cheap price, travellers on urgent business cannot buy short-notice tickets just before the plane takes off. On the other hand, if too many seats are allocated for travellers able to pay high prices, this may lead to many empty seats. Therefore, optimization of airline seats aims to allocate reasonable numbers of seats for the different levels of fare, in order to maximize flight revenue.
The most well-known airline seat inventory control method today is the expected marginal seat revenue (EMSR) method proposed by Belobaba [2]. Because this method is easy to understand and easy to implement, it was quickly adopted by many airline companies. EMSR has become the classic airline seat inventory control method and the normal foundation of seat optimization algorithms. But EMSR has two disadvantages. First, a reservation limit produced by EMSR cannot be changed as the reservation process progresses. In other words, the method is static. Secondly, the method does not consider the risk in the decision-making process [3]. To address these two shortcomings, the research community has recently proposed the expected marginal seat utility (EMSU) method [3–4]. EMSU has been applied in the single-leg seat control algorithm; however, for the multi-leg seat control problem there is not yet a sound solution. A popular method to address the multi-leg problem is the virtual bucket [2]. In this paper, a model based on the virtual bucket and EMSU ideas is proposed in order to solve the multi-leg problem.
2. Background and Previous Research
2.1 Introduction to EMSU
EMSU uses the expected marginal utility to replace the expected marginal revenue in the EMSR model [3]. The utility function is:

The model determines the level of risk. EMSU is defined as below:
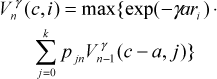
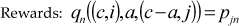
In Equation (2), c represents the number of remaining seats, i shows the requested class level, ri represents the fare of class i, γ means the risk factor, Pjn indicates the probability of requesting the level of class j in stage n, and a means the accepted number of passengers in stage n.
2.2 Virtual Bucket
To solve the multi-leg seat allocation problem, we should consider not only the fare level (F), but also the interaction between routing origin (O) and destination (D). The virtual bucket method is potentially important to solve multi-leg seat allocation effectively [4].
The steps are:
For each ODF combination fare, several virtual levels (or “buckets”) are set. The value of each bucket is the average of the ODF fares represented.
Each ODF fare is mapped to the corresponding bucket.
Every bucket can be treated as one level in a single-leg problem, and we can use the composite nested EMSR method to allocate seats.
Seats are allocated for each ODF. When an ODF seat is requested, the request can be accepted only if the bucket has seats. A connected ODF request can be accepted when all segments have seats.
3. Model and Policies
The assumptions of this study include:
Each passenger can only request one seat.
There is no overbooking and there are no cancellations.
There are several levels of ticket from 1 to k, where the corresponding fare is ri, 0 < rk < rk-1 < … < r1.
The aircraft capacity at each stopover point remains the same.
The model of the booking stage is divided into N stages.
In each stage, one person at most will arrive. The probability of one passenger arriving is found in the Poisson process. pjn shows the probability when class j is requested in stage n. The probability of no passenger arriving is:

3.1 model description
Markov decision processes are used to choose an action from the decision-making space, according to the various stages of decision-making. Decision-makers can also make a new decision according to the new state observed. This study uses Markov for dynamic decision-making in the booking process.
A Markov decision-making process includes the state space, action set, decision epochs, rewards and transition probabilities. In the model study herein, these are defined as follows.
State space: S={0,1…C}×{0,1…k}, where the first dimension stands for the remaining seat capacity and the second dimension is the fare class, with artificial fare class 0 with fare F0 = 0. A state (c, i) says that as c seats are remaining, we have a request for fare class i. Aircraft capacity is C, and the remaining capacity is the variable c, c ≤ C.
Action set:

This represents the “reject” and “accept” decision for a given state.
Decision epochs correspond to the time periods: T={0,1,.N}, where N represents the departure of flight and 0 is the start of booking.

To combine EMSU and virtual bucket, first we should divide the bucket according to the multi-leg fares; second, we attach the bucket to the corresponding leg, and then we calculate the EMSU values for every leg using Equation 1.
Then, we determine the structured protection number of various stages. The structured protection number is different from the protection number in the EMSR model: it means that the air company can accept reservations only when the remaining capacity is greater than the protection number. The calculation method is as follows:
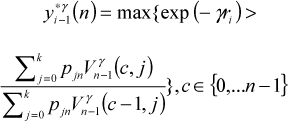
With the protection number, it is then possible to make a decision when a request arrives. The expression is:

In Equation (8), only when the remaining capacity is larger than the number of seats left at stage n can the reservation for the long leg ODF be accepted.
3.2 The division of stage and the transition probabilities' setting
As stated above, we require N-stage booking stages and transition probabilities based on the Poisson arrival process. These requirements are met as follows.
The booking time is divided into a series of short time intervals, and in each time interval the passenger arrival process follows a Poisson distribution.
Each interval is set to a number n, n=1,2,3…h. Time interval 1 represents the end of the booking time; time interval h represents the beginning of the booking.
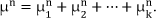
Since the model assumes that each decision interval has at most one passenger arrival, each time interval described above is divided into intervals related to the decisions required by the model. µkn means the expected arrivals in stage n at the required class level k. The expected arrivals in each class level in every stage corresponds to the following equation:
In each time interval, passengers arrive according to the Poisson distribution with a mean μn.
The interval n is divided into νk short decision intervals of equal length. Passenger arrivals in each short interval meet the Poisson distribution with a mean μn/vn; the most important constraint is that at most one passenger arrives in each interval.
ε is a very small probability value, which can be negligible; vn must then satisfy the equation P(x ≫ 2) < ε, where x is the number of passengers arriving within a decision interval. Because each interval meets the Poisson distribution with a mean μ
n
/ν
n
, where vn satisfies Equation 10, if given a value for ε we can easily find the value of vn:

The probability of passenger arrival in each decision interval is calculated. Passenger arrival meets the Poisson distribution with mean μ
n
/ν
n
, and

pk(n) stands for a passenger arriving, requiring class level k at stage n.
4. Numerical Simulation and Results
This study uses data from a Chinese domestic airline route, Nanjing (A) --- Shenzhen (B) --- Sanya (C), in simulation. Each ODF has two class level fares, Y and B, where Y denotes 100% fare and B denotes 80% fare. The number of available seats in the aircraft, C, is 140. There are three legs: AB, AC, and BC. We thus have ABY, ABB, ACY, ACB, BCY, and BCB as the six ODF combinations. ODF fares and demand data are shown in Table 1.
ODF fares and demand information

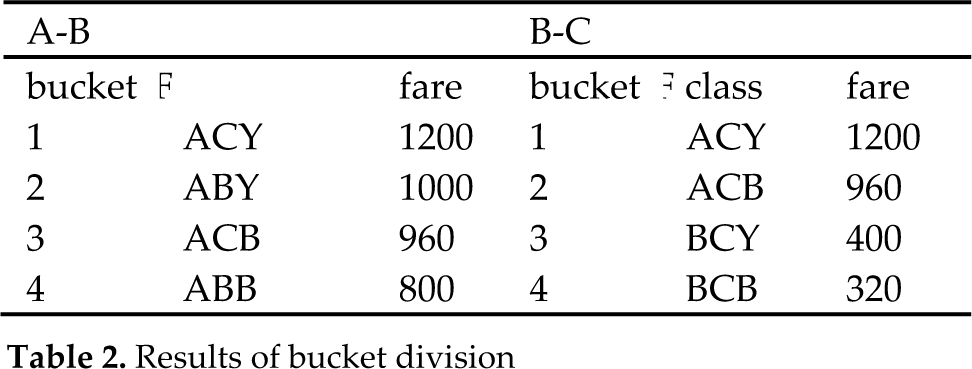
Because the number of ODF is not too high, we take each fare as a bucket. There are thus six virtual buckets. For the given data, the results of bucket division are as follows:
Results of bucket division
As passengers arrive in non-homogeneous Poisson distribution, we can obtain the probability and the number of passengers arriving at each stage, according to section B. The stimulation results are shown in Tables 3 and 4.
Probabilities of passenger arrival

Passenger arrival

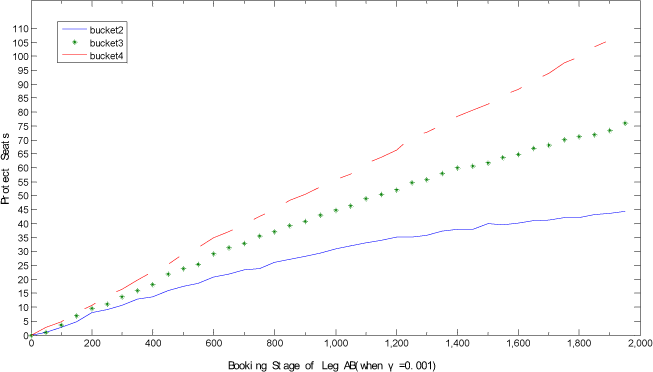
In this case, the risk factor γ was set to 0.002. Then, the protection number was obtained in each stage. The protection number of the AB leg is expressed in Fig. 1, and that of BC in Fig. 2. The risk factor was changed to 0.001, and the results are expressed in Figs. 3 and 4.

Segment AB's protection level

Segment BC's protection level
Segment AB's protection level

Segment BC's protection level
(See Table 2.) In Figs. 1 and 3, buckets 2, 3, and 4 mark the protected seats for ACY and respectively represent ODFs ABY, ACB and ABB. In Figs. 2 and 4, buckets 2,3, and 4 mark the protected seats for ACY and respectively represent ODFs ACB, BCY and BCB.
A comparison of the four graphs shows that a different risk factor may lead to different protected seats. It also indicates that the smaller the risk factor, the bigger the number of protected seats in general, and vice versa.
On the other hand, how does risk factor affect flight revenue? Table 5 shows the latest sales state of a simulation flight using the above method. The last column about the flight revenue shows that the smaller risk factor may bring more revenue; of course, this is on the premise that, no matter what the risk factors set, the flight requests should be consistent.
Last sales state and revenue of flight

Risk factor equates to risk tolerance, and is always set by the decision-maker or seat control employees in airlines. The decision-maker may thus control different seat allocation schemes at every stage over the sales period of a flight by setting different risk factors.
5. Conclusion
This paper combines the EMSU and the virtual bucket methods using a Markov decision process to approach the multi-leg seat inventory control problem. The authors simulated the arrival procedure of passengers with non-homogeneous Poisson distribution. The theoretical analysis and the experimental results show that with the reduction of the risk factor, the number of protected high-class seats rises. With the addition of risk-sensitive conditions that surpass the subjective rationality of decision-makers, the decision-making process better corresponds to real situations.
Footnotes
6. Acknowledgements
The authors acknowledge the support given by the United Funds of the Civil Aviation Administration of China and the National Natural Science Foundation (NSFC) under Grant No. U1333109.